Inequality in India
Back to Basics: Income Inequality
Income inequality is the unequal distribution of household or individual income across the various participants in an economy. Income inequality is often presented as the percentage of income to a percentage of the population.
The simplest way to understand inequality is by analysing the population by dividing it into quintiles (fifth) from poorest to richest and reporting the proportions of income held by them.
Example: if the bottom 20% of the population held 20% of the economy’s income and the top 20% held 20% of the economy’s income, then we can call the society highly equal. But it is hardly the case, as the bottom 20% of the population hardly owns more than 3% of the total wealth of the economy.
How to Measure Income Inequality.
Gini Coefficient
Gini is the most popular measure of income inequality. The Gini coefficient is derived from the Lorenz Curve.
Note for Students: Lorenz Curve
- The Lorenz curve shows the percentage of total income earned by cumulative percentage of the population.
- In a perfectly equal society, the “poorest” 25% of the population would earn 25% of the total income, the “poorest” 50% of the population would earn 50% of the total income and the Lorenz curve would follow the path of the 45° line of equality.
- As inequality increases, the Lorenz curve deviates from the line of equality; the “poorest” 25% of the population may earn 10% of the total income; the “poorest” 50% of the population may earn 20% of the total income and so on.
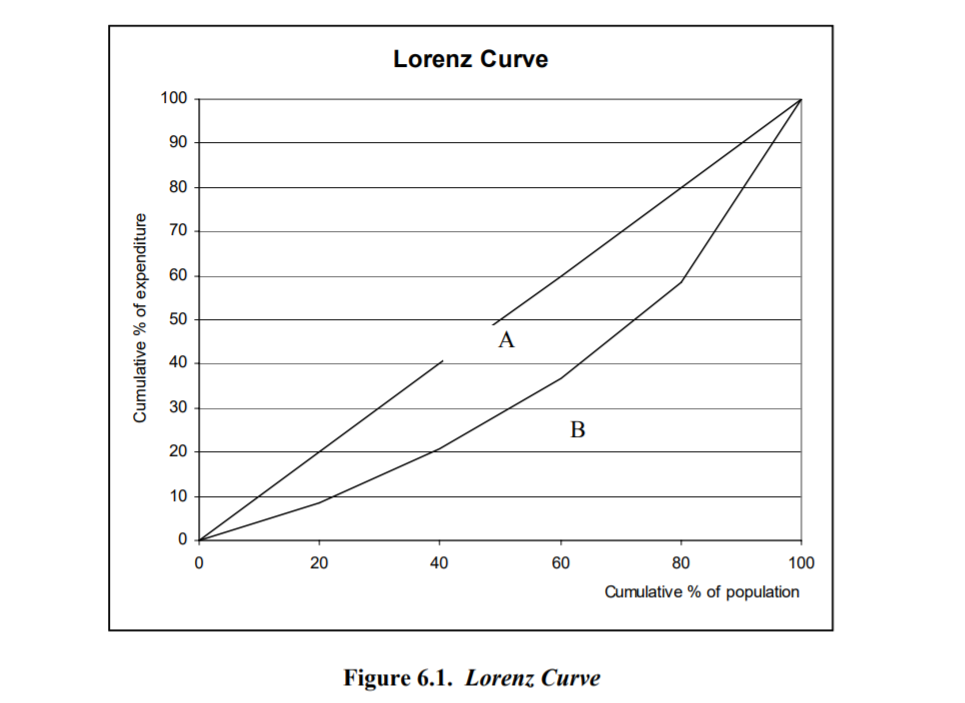
To construct the Gini coefficient, graph the cumulative percentage of households (from poor to rich) on the horizontal axis and the cumulative percentage of expenditure (or income) on the vertical axis.
The Lorenz curve is shown in the figure. The diagonal line represents perfect equality.
The Gini coefficient is defined as A/(A+B), where A and B are the areas shown on the graph. If A=0 the Gini coefficient becomes 0 which means perfect equality, whereas if B=0 the Gini coefficient becomes 1 which means complete inequality. In this example, the Gini coefficient is about 0.35.
Income Inequality: A Comparison
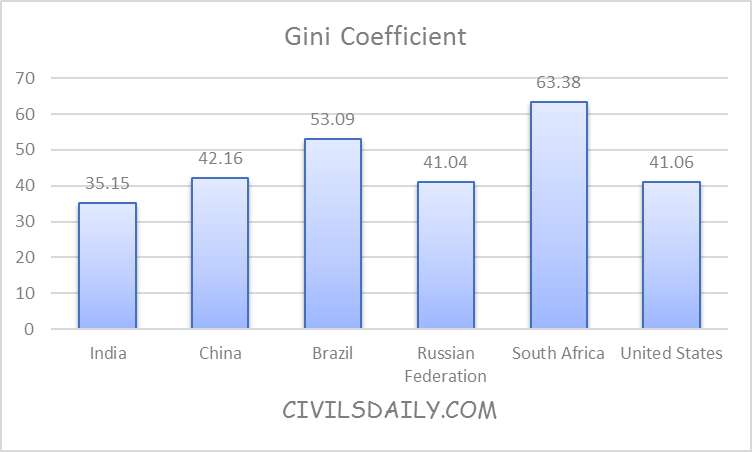
Source: World Bank, 2011.
The above graph represents the Gini Coefficient of the selected Countries for the year 2011.
The Gini index of 0 represents the perfect equality, whereas the Gini index of 100 represents perfect inequality.
India has one of the lowest inequality among the BRICS Countries with Gini Index of 35.15.
Income Inequality: Percentage of Income held by top 10% of the Population
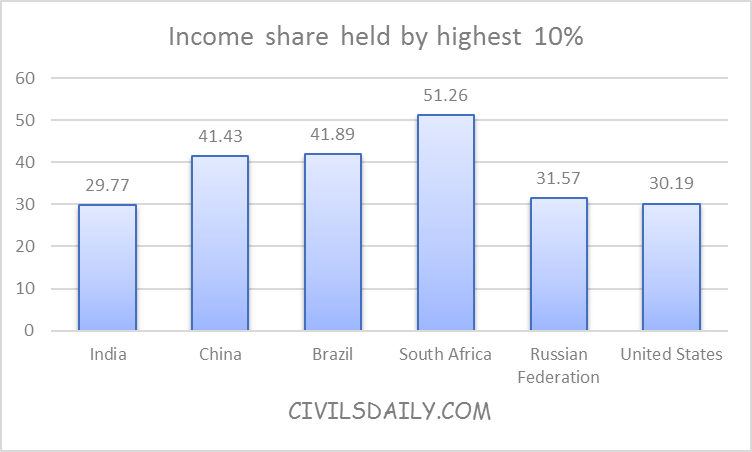
Source: World Bank, 2011
The graph represents the percentage of the income held by the top 10% of the population in the selected countries.
The percentage of the income held by the top 10% in India is close to 30 percent.
Income Inequality: Percentage of Income held by the poorest 10% of the population.
The graph below represents the percentage of the income held by the poorest 10% of the population in the selected countries.
The percentage of the income held by the poorest 10% in India is close to 3 percent.
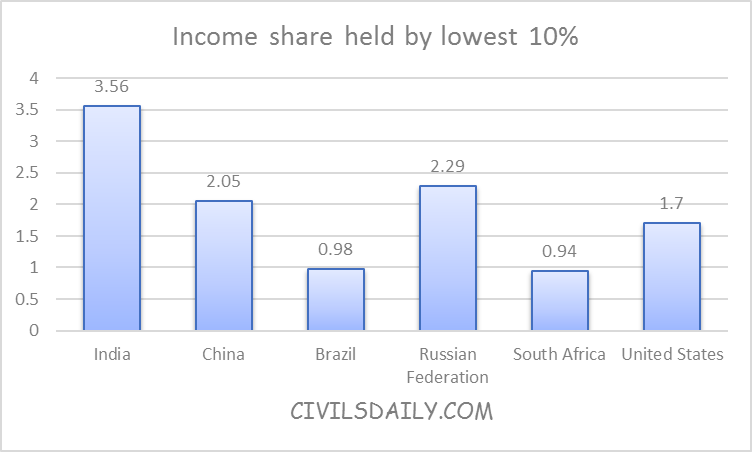
Source: World Bank, 2011
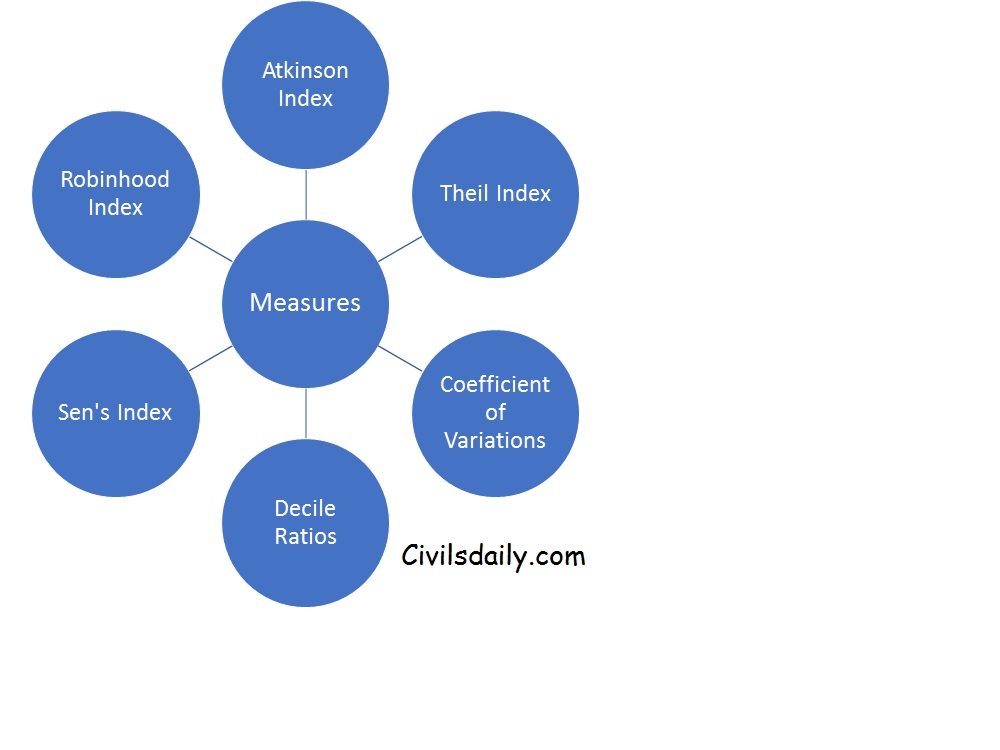
The Common measures of Inequality
By
Himanshu Arora
Doctoral Scholar in Economics & Senior Research Fellow, CDS, Jawaharlal Nehru University