💥Join UPSC 2027,2028 Mentorship (July Batch) + XFactor Notes & Microthemes PDF

Subject: Climate Change

1. Global Warming and Issues
2. All about Pollution

  • Why below average-rains don’t rule out flood threats

    Why in the News?

    India’s monsoon narrative is undergoing a structural shift: even below-average seasonal rainfall (92% of normal) no longer guarantees safety from floods. The real concern is the sharp rise in short-duration, high-intensity rainfall events, with extreme rainfall incidents increasing to 181 in 2024 (from 160 in 2023). This marks a decisive break from earlier patterns where floods were linked to overall excess rainfall.

    Why do below-average monsoons no longer reduce flood risks?

    1. Rainfall variability: Seasonal averages conceal intra-seasonal fluctuations, allowing extreme events despite overall deficit rainfall.
    2. Short-duration intensity: Rainfall now occurs in short, intense bursts, increasing runoff and flood risk.
    3. Historical evidence: Major disasters (e.g., 2015 Chennai floods, 2018 Kerala floods, 2023 Himachal floods) occurred even in relatively normal or deficit rainfall years.

    How has the frequency and intensity of extreme rainfall changed over time?

    1. Rising frequency: Extreme rainfall events increased from ~89 (2016) to 181 (2024).
    2. Threshold revision: IMD reduced extreme rainfall threshold from 244.5 mm to 204.5 mm (2016), reflecting changing climate patterns.
    3. Spatial spread: Events are now geographically widespread, affecting both coastal and inland regions.

    What explains the increasing unpredictability of rainfall patterns?

    1. Climate change impact: Warmer atmosphere holds more moisture, leading to intense precipitation events.
    2. Chaotic weather systems: Small initial changes lead to large deviations, limiting forecast accuracy.
    3. Forecast limitations: Even with improved models, predicting exact rainfall intensity (250 mm vs 500 mm) remains difficult.

    Why are Indian cities increasingly vulnerable to rainfall-induced disasters?

    1. Urban flooding: Cities like Delhi, Mumbai, Chennai, Bengaluru face repeated flooding due to poor drainage systems.
    2. Unplanned development: Construction on floodplains, wetlands, and water bodies reduces natural absorption capacity.
    3. Population density: High-density urban clusters amplify economic and human losses.

    What role do past disasters play in understanding current risks?

    1. Disaster clustering: India has experienced at least one major rainfall disaster every year since 2013 (e.g., Kedarnath 2013, Uttarakhand 2021, Assam 2022).
    2. Record-breaking events:
      1. Jammu & Kashmir (2014): Highest rainfall in 100 years.
      2. Kerala (2018): Worst floods in a century.
    3. Trend shift: Disasters are no longer rare but structural features of the monsoon system.

    How has the nature of rainfall-related disasters evolved?

    1. From scarcity to extremes: Earlier focus on rainfall deficiency has shifted to extreme variability.
    2. Urban-centric risks: Flooding increasingly affects urban agglomerations rather than only rural areas.
    3. Economic consequences: States spent over 55% of disaster expenditure on floods (2019-2023), indicating high fiscal burden.

    Conclusion

    India’s monsoon is no longer defined by total rainfall but by distribution, intensity, and timing. The growing disconnect between seasonal averages and disaster outcomes highlights the urgent need for climate-resilient urban planning, improved forecasting systems, and adaptive governance frameworks. The challenge lies not in managing scarcity alone, but in navigating climate-induced volatility.

    PYQ Relevance

    [UPSC 2020] Account for the huge flooding of million cities in India including the smart ones like Hyderabad and Pune. Suggest lasting remedial measures

    Linkage: Increasing extreme rainfall events despite normal/below-normal monsoon directly explain rising urban flooding trends in Indian cities. This PYQ links climatology (monsoon variability) with urban geography issues, making it relevant for both Mains (GS1/GS3) and Prelims (extreme rainfall, IMD classification).

  • Hindu Kush Himalaya (HKH) 

    Why in the News?

    • A report by the International Centre for Integrated Mountain Development highlights a record 27% decline in snow persistence in the HKH region.
    • Indicates accelerating climate change impacts on Asian water systems.

    About Hindu Kush Himalaya (HKH)
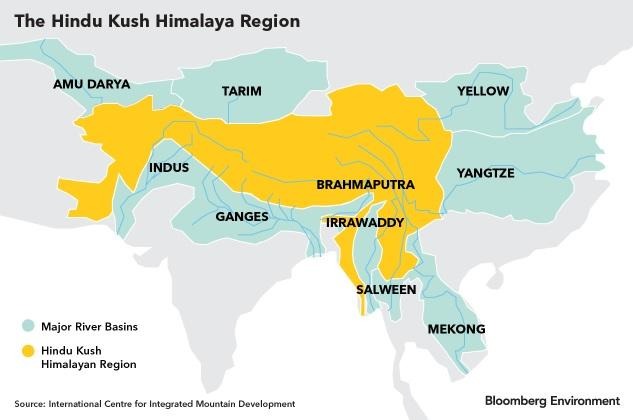
    • A vast mountain system extending about 3,500 km
    • Spans 8 countries: Afghanistan, Bangladesh, Bhutan, China, India, Nepal, Myanmar, and Pakistan.

    Why Called “Third Pole”?

    • Largest ice reserves outside Arctic and Antarctic
    • Critical for:
      • Global climate regulation
      • Freshwater supply

    Major Rivers Originating from HKH

    • Indus
    • Ganga
    • Brahmaputra
    • Amu Darya
    • Mekong
    • Yangtze
    • Yellow River
    • Irrawaddy
    • Salween
    • Tarim
    [2012] When you travel in Himalayas, you will see the following: 
    1 Deep gorges 
    2 U-turn river courses 
    3 Parallel mountain ranges 
    4 Steep gradients causing land sliding 
    Which of the above can be said to be the evidence for Himalayas being young fold mountains? 
    (a) 1 and 2 only (b) 1, 2 and 4 only (c) 3 and 4 only (d) 1, 2, 3 and 4
  • [24th April 2026] The Hindu OpED: Scaling climate adaptation from policy to grassroots

    PYQ Relevance[UPSC 2017] Climate change is a global problem. How will India be affected by climate change? How will Himalayan and coastal states of India be affected?Linkage: This is a core GS-III question linking climate vulnerability, sectoral impacts, and regional disparities. It directly tests understanding of adaptation and resilience frameworks.

    Mentor’s Comment

    India’s climate adaptation framework is under scrutiny due to a widening gap between ambitious policy commitments and weak on-ground implementation, especially as the country faces over 430 extreme weather events (1995-2024) costing $180 billion. While adaptation is gaining prominence globally, India’s budgetary tilt towards mitigation over adaptation and fragmented institutional mechanisms make this a critical policy challenge.

    What is climate adaptation?

    1. Climate adaptation is the process of adjusting to the current and expected effects of climate change to minimize harm and take advantage of new opportunities. 
    2. While mitigation focuses on tackling the causes of climate change by reducing greenhouse gas emissions, adaptation focuses on managing its impacts, such as rising sea levels, extreme heatwaves, and erratic rainfall. 
    3. In essence, it is about building resilience to live with a changing climate that is already “in the pipeline” due to historical emissions.

    Why is climate adaptation critical for India’s development trajectory?

    Climate adaptation is critical for India because climate change is no longer just an environmental issue; it is a direct threat to national economic stability and poverty reduction.

    1. Climate Vulnerability: India ranks among the most climate-vulnerable nations with 430 extreme events (1995-2024) causing $180 billion losses; demonstrates systemic risk to growth and livelihoods.
      1. GDP Protection: Heatwaves alone are projected to put 4.5% of India’s GDP at risk by 2030 due to lost labor hours in outdoor sectors like construction and mining.
    2. Policy Recognition: India’s updated NDCs (2022, under Paris Agreement framework) emphasize climate resilience, adaptation mainstreaming, and integration into development planning; align national priorities with evolving global climate commitments.
    3. Sectoral Exposure:Agriculture, infrastructure, biodiversity, water systems face direct climate risks;
      1. Example: National Innovations in Climate Resilient Agriculture (NICRA) targets climate-resilient agriculture in 151 districts.
      2. Water Scarcity: Adaptation involves revitalizing traditional water harvesting (like Amrit Sarovar) to manage the erratic rainfall patterns that currently swing between extreme drought and flash floods.
    4. Livelihood Impact: Vulnerable populations face income instability due to climate shocks; adaptation ensures socio-economic stability.
      1. Preventing Debt Traps: When a climate event (like a crop failure or a destroyed home) occurs, it often pushes families back into poverty. Adaptation measures, like the expansion of climate-indexed insurance, provide a safety net that keeps families socio-economically stable.
      2. Migration Management: Climate adaptation in rural areas reduces “distress migration” to already overcrowded cities, allowing for more planned and sustainable urbanization.

    How effective are India’s existing adaptation initiatives?

    1. Flagship Programme:National Innovations in Climate Resilient Agriculture): By covering 448 villages, it has successfully built a “technology bank” for farmers. Its strength lies in capacity building, teaching farmers to use custom-hiring centres for climate-smart machinery and weather-based crop insurance.
      1. Success Metrics: In the 2024-25 cycle, NICRA’s Technology Demonstration Component (TDC) showed that practices like mulching and zero-tillage increased yields by 13% to 26% even during drought years.
      2. Impact: It has successfully built “climate literacy” for over 3,000 farmers per cluster. It has established local seed banks and community nurseries that allow villages to recover faster after floods or droughts.
    2. Tamil Nadu Climate Resilient Villages (CRV): The Tamil Nadu Climate Resilient Villages (CRV) program is a cornerstone of India’s sub-national climate action. Managed by the Tamil Nadu Green Climate Company (TNGCC), it is often cited as a more holistic model than traditional sector-specific programs because it treats the village as an integrated ecosystem rather than just a farming unit.
      1. Holistic Reach: This model is noted for its community-driven design. By 2025, it helped nearly 2.7 million people across 11 districts by integrating solar energy with practical infrastructure, such as restoring canals to reduce urban/rural flooding.
      2. Outcome: It has shifted from just “agriculture” to “livelihood resilience,” creating green jobs in waste management and coastal restoration (e.g., mangrove touring and hatcheries).
    3. The Integrated “Mitigation-Adaptation” Synergy: India is increasingly using a dual-purpose strategy. For example:
      1. Solar Pumps: These reduce carbon emissions (mitigation) while providing farmers with reliable irrigation during erratic monsoons (adaptation).
      2. Afforestation: Large-scale planting acts as a carbon sink while simultaneously preventing soil erosion and cooling local micro-climates.
    4. Key Shortcomings: The “Scaling” Gap: Despite these successes, the overall effectiveness is hampered by several structural issues:
      1. Fragmented Efforts: Adaptation projects are often spread across different ministries (Agriculture, Water, Environment) with poor inter-departmental coordination, leading to overlapping or conflicting actions.
      2. Lack of Mainstreaming: While 151 districts have NICRA interventions, India has over 700 districts. The transition from pilot projects to national policy is slow.
      3. Funding Constraints: Most initiatives rely on government grants. There is a lack of private sector investment and scalable financial models (like climate bonds) to take these models to every village.
      4. Data Gaps: Real-time monitoring of how these initiatives actually reduce “climate-risk” over a decade is still in its infancy, making it hard to refine strategies.

    What are the financial constraints in scaling adaptation?

    1. Global Finance Gap: Developing countries face $215-387 billion annual gap (UNEP Adaptation Gap Report 2023); indicates structural underfunding.
    2. Domestic Budget Bias: India’s Union Budget prioritizes mitigation over adaptation; reduces resilience-building capacity.
      1. High-visibility projects like Green Hydrogen, solar parks, and EV subsidies receive the bulk of climate-related funding because they have clearer revenue models and private sector appeal.
    3. Return on Investment: According to the World Resources Institute (WRI), every $1 invested in adaptation can yield $2 to $10 in net benefits.
    4. Institutional Financing Gap: Lack of dedicated adaptation financing frameworks at state and district levels.
      1. Grant Dependency: Most adaptation work relies on one-time government grants. There is a critical lack of blended finance (mixing public and private funds) or “Climate Bonds” specifically designed for resilience projects in rural India.

    How can governance and institutional mechanisms be strengthened?

    1. Policy Integration: Aligns adaptation with national and state budgets; ensures institutional accountability.
      1. Climate-Tagged Budgeting: Introducing “Green Budgeting” at the state level ensures that every development rupee spent, whether on roads or schools, accounts for climate resilience.
    2. Revitalizing Planning Frameworks: While National Action Plans (NAP) exist, the real action happens at the sub-national level.
      1. Dynamic SAPCCs: State Action Plans on Climate Change (SAPCCs) must be updated to version 2.0, moving beyond broad goals to specific, actionable, and bankable projects.
      2. Decentralized Implementation: Shifting the focus from state capitals to District and Block-level planning, as climate impacts (like a localized cloudburst) are highly specific to geography.
    3. Precision Data Systems: Promotes climate vulnerability assessments at district/block levels; ensures evidence-based policymaking.
      1. Open-Access Climate Data: Creating a unified national portal for climate data allows local governments, NGOs, and the private sector to use the same scientific baseline for their resilience planning.
    4. Monitoring Mechanisms: Introduces standardized indicators and periodic reviews; ensures outcome tracking.
      1. Standardized Indicators: Introducing a “Resilience Index” for districts to track progress across water security, agricultural yield stability, and disaster recovery times.
      2. Third-Party Audits: Periodic reviews by independent scientific bodies to ensure that “adaptation” projects aren’t just “greenwashed” infrastructure.
    5. Capacity Building: Strengthens institutional and technical capacity; example: climate cells at state/district levels.

    Why is locally led adaptation crucial for climate resilience?

    1. Decentralized Governance: Empowers urban local bodies and Panchayati Raj Institutions; ensures context-specific interventions.
    2. Community Ownership: Enhances participation and accountability; example: CRV consultations with local communities.
    3. Localized Solutions: Adapts interventions to geography; example: flood vs drought-prone regions require different strategies.
    4. Behavioral Change: Builds resilience through awareness and capacity building; ensures long-term sustainability.

    What systemic changes are required to scale adaptation effectively?

    1. Whole-of-System Approach: Integrates governance across sectors and levels; ensures policy coherence.
    2. Cross-Sectoral Coordination: Links agriculture, water, infrastructure, and energy sectors.
    3. Private Sector Role: Encourages investment in adaptation projects; expands financial base.
    4. Continuous Data Collection: Enables real-time monitoring and adaptive policymaking.

    Conclusion

    India’s climate adaptation challenge is not one of policy absence but of execution gaps. Scaling adaptation requires financial prioritization, institutional convergence, and decentralized governance. Integrating local knowledge with national frameworks remains critical for achieving resilience at scale.

  • Extreme heat threatens global food systems, UN agencies warn

    Why in the News?

    A new joint report released for Earth Day 2026 by the Food and Agriculture Organization (FAO) and the World Meteorological Organization (WMO) confirms that extreme heat has become a “systemic risk multiplier” pushing global agri-food systems to the brink. The report, titled “Extreme Heat and Agriculture,” warns that these conditions now threaten the livelihoods and health of over one billion people.

    How is extreme heat reshaping global agri-food systems?

    Critical physiological limits are already being breached in major global breadbaskets: 

    1. Thermal stress thresholds: Exceeding critical temperature levels triggers crop failure, reduced yields, and ecosystem imbalance.
      1. Major Crops: Yields for staples like wheat, potatoes, and barley begin a sharp decline once temperatures exceed 30 degree celsius
      2. Livestock: Physiological stress starts at 25 degree celsius. Pigs and poultry are most vulnerable because they cannot sweat, leading to reduced dairy yields, growth issues, and mortality.
    2. System disruption: Alters crop cycles, fish migration, and forest productivity.
      1. Compound Hazards: Heat accelerates “flash droughts,” intensifies wildfires, and fosters the rapid spread of pests and diseases, such as locust swarms.
      2. Fisheries and Oceans: In 2024, 91% of the world’s oceans experienced at least one marine heatwave. This depletes oxygen levels, causing cardiac failure in fish and leading to economic losses in fisheries valued at over 6 billion.
      3. Forestry and Ecosystems: Extreme heat disrupts photosynthesis and has suppressed forest productivity by up to 50% in some regions. 
    3. Livelihood impact: Threatens over 1 billion people dependent on agriculture and allied sectors.
      1. Labour Loss: Heat already causes the loss of roughly 500 billion working hours annually.
      2. Unsafe Working Conditions: In regions like South Asia and sub-Saharan Africa, the number of days “too hot to work” could rise to 250 per year.
      3. Economic Vulnerability: Poor households lose an average of 5% of their annual income to heat stress, with female-headed households in rural low-income countries suffering losses up to 8%. 

    What are the impacts on crop production and food security?

    1. Yield reduction: The 6 percent rule: Each 1°C temperature rise reduces maize, rice, soy, and wheat yields by ~6%
    2. Economic Toll: In low-income countries alone, heat stress causes an average annual loss of $37 billion in crop production.
    3. Photosynthesis disruption: Heat doesn’t just stop growth; it forces plants to burn through their own energy:
      1. Night-time Stress: High night temperatures are particularly damaging because they increase respiration rates. Instead of storing energy for grain production, the plant consumes its carbon reserves just to survive the night.
      2. Energy Depletion: This metabolic imbalance leads to stunted plants and significantly smaller, less nutritious grains and fruits.
    4. Reproductive failure: Extreme heat acts as a “biological kill switch” during the most sensitive stage of a plant’s life: flowering.
      1. Pollen Sterility: In crops like rice and maize, temperatures exceeding critical thresholds during flowering cause pollen to dry out or become sterile.
      2. Empty Husks: This leads to a phenomenon known as “blanking” or “blindness,” where the plant appears healthy but produces empty husks or pods because fertilization never occurred. Even a few hours of extreme heat at the wrong time can wipe out an entire season’s potential.
    5. Compounding Food Security Risks: These biological failures create a domino effect on global food stability:
      1. Nutritional Insecurity: Beyond volume, heat stress reduces the protein and micronutrient content in staples like wheat and rice.
      2. Price Volatility: As major “breadbasket” regions hit these thermal ceilings simultaneously, global markets face supply shocks and rapid food price inflation.

    How does extreme heat affect livestock productivity?

    1. Heat stress: Triggered by high thermal humidity index levels.
    2. Milk production decline: Drops by up to 15-25% in dairy cattle.
    3. Fertility reduction: Significant decrease in reproductive efficiency.
      1. Reduced Conception: High Temperature Humidity Index (THI) levels lead to poor estrus expression and hormonal imbalances, with conception rates dropping to nearly 0% in severe conditions.
      2. Embryonic Mortality: Heat causes direct damage to developing embryos and oocytes, leading to higher rates of early embryonic loss and smaller, weaker offspring.
      3. Male Fertility: Spikes in temperature cause sperm deformity and reduced motility, sometimes resulting in temporary or permanent infertility in bulls and boars. 
    4. Poultry mortality: The report warns of an escalation in “mass mortality events”. Extreme temperature spikes cause mass deaths in farms lacking climate control.
    5. Disease and Immune Suppression: Heat stress compromises the immune system, making livestock more susceptible to existing and emerging pathogens. Altered temperature patterns also expand the range of disease-carrying vectors, such as those responsible for Foot and Mouth disease.

    Why are marine ecosystems increasingly vulnerable?

    1. Marine heatwaves: Marine heatwaves (MHWs) are now more frequent, longer-lasting, and more intense. By 2024, nearly the entire global ocean surface was impacted, compared to only 60% in 2021.
      1. Systemic Exposure: These events are no longer restricted to surface waters; they are reaching depths of 30-50 metres and even the seafloor, leaving sedentary species like coral and kelp with no “thermal refuge
    2. Ocean stress: 91% of oceans experienced at least one marine heatwave in 2024.
    3. Oxygen depletion: Reduces fish survival and productivity.
      1. Deoxygenation: Warmer water holds less dissolved oxygen. This creates hypoxic (low-oxygen) conditions that can lead to cardiac failure and mass mortality in fish populations.
      2. Metabolic Strain: Heat increases the metabolic rates of marine animals, meaning they require more food to survive exactly when their food supply, like plankton, is being disrupted by the same heat stress. 
    4. Fish stock decline: Around 15% of global fisheries have already been significantly impacted by extreme heat incidents.
    5. Disruption of Foundation Species
      1. Ecosystem Collapse: MHWs are “biological wildfires” that decimate foundation species such as coral reefs, kelp forests, and seagrass meadows.
      2. Habitat Loss: The loss of these “nurseries” triggers a domino effect, stripping away the shelter and food sources for thousands of other species.

    How does extreme heat act as a risk multiplier?

    The FAO and WMO joint report defines extreme heat as a “risk multiplier” because it does not just act alone; it creates a domino effect by magnifying existing vulnerabilities and triggering compound climate hazards. 

    1. Drought intensification: Reduces water availability for crops.
      1. Evaporative Stress: Heat-driven evaporation significantly reduces irrigation capacity. For example, a 2025 heat event in Kyrgyzstan saw temperatures 10 degree celsius above normal, which slashed irrigation and contributed to a 25% decline in cereal harvests.
      2. Case Study: In Brazil (2023-2024), extreme heat combined with drought cut soybean yields by up to 20%.
    2. Wildfires escalation: There is a direct, strong correlation between heatwaves and more catastrophic fire seasons:
      1. Vegetation Drying: Prolonged heat dries out forests and rangelands, turning them into highly combustible fuel.
      2. Case Study: Portugal’s 2017 fire season, driven by extreme heat, burned a record 540,000 hectares and caused over 1.2 billion in losses.
      3. Carbon Feedback: Wildfires triggered by heat turn natural carbon sinks (forests) into net carbon sources, accelerating global warming further. 
    3. Pest outbreaks:
      1. Increased Survival: Warm winters and extreme summer heat often increase the survival and reproduction rates of pests.
      2. Pest Migrations: Heatwaves have been specifically linked to sudden outbreaks, such as locust swarms in Central Asia following thermal shocks to crops.
    4. Combined impact: Amplifies food insecurity risks across regions.
      1. Cascading Failures: A single heat event can simultaneously wither crops, kill livestock, dry forests, and make it fatal for agricultural labourers to work outdoors, who may face up to 250 “unworkable” days per year in South Asia and sub-Saharan Africa.
      2. Market Volatility: By triggering simultaneous failures across different sectors (crops, fisheries, and forests), extreme heat overwhelms local economies and drives global food price spikes. 

    Why are current policy responses inadequate?

    1. Fragmented governance: Lack of integrated climate-agriculture strategies.
    2. Insufficient early warning systems: Limits preparedness for farmers and fishers.
    3. The “Relief vs. Resilience” Trap: Most funding is currently locked into a reactive cycle:
      1. Post-Disaster Focus: Significant resources are spent on emergency food aid and disaster relief after a crop failure has already occurred.
      2. Underinvestment in Prevention: There is a chronic lack of funding for long-term adaptation, such as developing heat-tolerant seed varieties, building sustainable irrigation, or establishing heat-indexed insurance that pays out before the crop dies.

    What solutions are suggested for mitigation and adaptation?

    1. Risk governance: Strengthens institutional response frameworks.
      1. National Heat Action Plans: Moving beyond urban areas to include specific agricultural protocols.
    2. Early warning systems: Enables preventive action for climate shocks.
      1. The Last Mile: Using SMS, radio, and local cooperatives to deliver hyper-local forecasts.
    3. Climate-resilient agriculture: Promotes heat-resistant crop varieties.
      1. Adaptive Breeding: Investing in “orphan crops” (like millets or sorghum) that are naturally heat-tolerant and developing new varieties of staples that can survive temperatures above 30 degree celsius
      2. Nature-Based Solutions: Expanding agroforestry (planting trees among crops) to create micro-climates that reduce ambient temperatures by several degrees.
      3. Livestock Management: Retrofitting farms with solar-powered ventilation and shifting grazing cycles to cooler night-time hours.
    4. Technological and financial integration: Supports forecasting and adaptive farming.
      1. Digital Twins: Using satellite data to create digital models of farms to predict where “flash droughts” are most likely to hit.
      2. Anticipatory Finance: Expanding weather-indexed insurance. These programs trigger automatic cash payouts to farmers as soon as a temperature threshold is crossed, providing the liquidity needed to buy extra water or cooling equipment before the crop fails.

    Conclusion

    Extreme heat is transitioning from an environmental issue to a systemic economic and food security crisis. Addressing it requires integrated climate governance, technological intervention, and proactive adaptation strategies.

    PYQ Relevance

    [UPSC 2017] Climate Change’ is a global problem. How will India be affected by climate change? How Himalayan and coastal states of India are affected by climate change?

    Linkage: The PYQ directly connects to climate-induced extreme heat impacts on agriculture, livestock, and fisheries, central to the article. It provides contemporary data (yield loss, marine heatwaves, heat stress) to enrich answers on regional vulnerability (Himalayan, coastal, agrarian systems).

  • Extreme Heat & Global Food Systems 

     Why in the News?

    • A joint report by the Food and Agriculture Organization and World Meteorological Organization warns that extreme heat is threatening global agrifood systems, impacting over a billion people.

    Key Findings

    • Heatwaves are: More frequent, More intense, and Longer-lasting
    • Crop yields decline sharply beyond: ~30°C threshold
      • Example: Morocco saw 40% fall in cereal yield
    • Impact on Major Crops: Every 1°C rise in temperature leads to:
      • ~6% reduction in yields of: Maize, Rice, Wheat, and Soybean
    • Marine Impact: Marine heatwaves: Reduce oxygen in oceans and Threaten fish stocks
      • In 2024: 91% of oceans experienced marine heatwaves
    • Risk Escalation:
      • 2°C warming → heat intensity doubles
      • 3°C warming → heat intensity quadruples
    • Livestock Impact
      • 15–25% drop in milk production
      • Reduced fertility
      • Poultry mortality
    [2014] The scientific view is that the increase in global temperature should not exceed 2°C above pre-industrial level. If the global temperature increases beyond 3°C above the pre-industrial level, what can be its possible impact/impacts on the world? 
    1 Terrestrial biosphere tends toward a net carbon source. 
    2 Widespread coral mortality will occur. 
    3 All the global wetlands will permanently disappear. 
    4 Cultivation of cereals will not be possible anywhere in the world. 
    Select the correct answer using the code given below. 
    a) 1 only b) 1 and 2 only c) 2, 3 and 4 only d) 1, 2, 3 and 4
  • Marine Spatial Plan: Odisha’s bid to strengthen climate resilience

    Why in the News?

    Odisha has signed an MoU with the National Centre for Coastal Research (NCCR) to implement a Marine Spatial Plan (MSP), making it one of the first Indian states to operationalize integrated ocean planning at a state scale. This is significant as coastal management in India has traditionally been sectoral (fisheries, ports, tourism) and reactive.

    What is Marine Spatial Planning (MSP) and why is it relevant?

    1. According to UNESCO, Marine Spatial Planning (MSP) is a public process of analyzing and allocating the spatial and temporal distribution of human activities in marine areas to achieve ecological, economic and social objectives that have been specified through a political process.
    2. It is a tool for sustainable and integrated ocean management aimed at boosting the blue economy and strengthening climate resilience. 
    3. It helps for sustainable utilisation of marine resources in energy, economic activities like developing ports, harbours, setting up industries, environment, fisheries, aquaculture and tourism and to formulate policies accordingly.
    4. It aligns with UNESCO-IOC guidelines for sustainable ocean management.
    5. Intergovernmental Oceanographic Commission
    6. Indian Context: Extends India-Norway collaboration on ocean management initiated in 2019.

    Why does Odisha require MSP at this stage?

    Odisha requires Marine Spatial Planning (MSP) at this stage, launched in April 2026 as the first state in India to enter the second phase of the India-Norway Sustainable Ocean Planning initiative. It was launched to balance intense developmental pressures with environmental conservation along its 574-km coastline. The planning is essential to resolve conflicts between economic activities (ports, tourism, fisheries) and the protection of ecologically sensitive habitats.

    1. Extensive Coastline: Covers 550+ km, including ecologically sensitive zones like lagoons and mangroves.
    2. Development Pressures: Increasing industrial, tourism, and port activities create resource conflicts.
    3. Biodiversity Significance: Coastal ecosystems support livelihoods and ecological balance.
    4. Climate Vulnerability: Frequent cyclones and rising sea levels necessitate adaptive planning.
    5. Data Gaps: Requires scientific mapping of salinity, temperature, and ecosystem components.

    How does MSP function as a governance mechanism?

    Marine Spatial Planning (MSP) functions as a governance mechanism by providing a public, data-driven process that integrates multiple maritime sectors (e.g., energy, fishing, shipping) to map, allocate, and manage ocean space sustainably. It reduces conflicts, creates efficiencies, protects ecosystems, and enables collaborative decision-making across jurisdictions

    1. Spatial Allocation: Identifies zones for fishing, tourism, conservation, and infrastructure.
    2. Scientific Mapping: Studies water parameters (salinity, temperature) to guide activity suitability.
    3. Conflict Resolution: Reduces sectoral conflicts through predefined spatial use.
    4. Policy Integration: Links economic policies with environmental safeguards.
    5. Stakeholder Coordination: Engages multiple sectors and coastal communities.

    What are the expected economic and ecological outcomes?

    1. Blue Economy Expansion: Enhances fisheries, tourism, and ocean energy sectors.
    2. Ecosystem Protection: Preserves mangroves, seagrasses, and marine biodiversity.
    3. Livelihood Security: Supports coastal populations dependent on marine resources.
    4. Efficient Resource Use: Ensures optimal allocation without ecological degradation.
    5. Long-term Sustainability: Maintains ecosystem health alongside economic growth.

    What complementary initiatives strengthen MSP in Odisha?

    1. OMBRIC Initiative: The Odisha Marine Biotechnology Research and Innovation Corridor (OMBRIC) supports marine biotechnology for environmental protection and economic use.
    2. Biotechnology Integration: OMBRIC involves seven leading research institutions, including IIT Bhubaneswar, NIT Rourkela, and ILS Bhubaneswar.  These focus on mapping marine bioresources, cultivating unculturable microorganisms for industrial enzymes, and breeding Indian horseshoe crabs.
    3. Tourism and Livelihood Linkages: Develops eco-tourism and scientific tourism models.
      1. It includes the development of an oceanarium and water sports along the Puri-Konark marine drive. 
      2. It also includes a “Million Mangroves by 2030” initiative to empower local fisherfolk and women-led groups through nature-based solutions.
    4. Policy Ecosystem: The initiative aligns with India’s Vision 2047, focusing on technology-driven resource management for climate-resilient growth. Key partnerships include the National Institute of Ocean Technology (NIOT) and the Odisha Marine Bio Resource Atlas project to publish data on marine life.

    Conclusion

    Odisha’s MSP represents a transition toward integrated, science-driven marine governance. It enhances climate resilience while supporting economic activities. Its success can provide a model for other coastal states in India.

    PYQ Relevance

    [UPSC 2023] Explain the causes and effects of coastal erosion in India. What are the available coastal management techniques for combating the hazard?

    Linkage: Marine Spatial Planning (MSP) acts as a preventive mitigation tool by regulating coastal activities and reducing erosion, habitat loss, and ecosystem degradation. It complements coastal management techniques through scientific zoning and ecosystem-based adaptation, strengthening long-term climate mitigation and resilience.

  • Marine Heatwaves (MHWs) 

    Why in the News?

    • A recent study shows that tropical cyclones passing over marine heatwaves become far more destructive, leading to about 60% more billion-dollar disasters due to rapid intensification.

    What are Marine Heatwaves

    • A prolonged period of unusually high sea surface temperature
    • Duration: Days to months
    • Temperature anomaly: Typically 1°C to 3°C above normal

    Key Characteristics

    • Region-specific phenomenon
    • Defined by: Duration, Intensity, and Spatial extent

    Causes of Marine Heatwaves

    1. Climate Change

    • Oceans absorb over 90% of excess heat
    • Raises baseline temperature

    2. Weakening Winds

    • Less: Evaporation and Vertical mixing

    3. Ocean Stratification

    • Warm water trapped at surface
    • No mixing with cooler deep water

    4. Ocean Currents

    • Transport warm water to new regions

    5. Climate Oscillations

    • Example: El Niño
    • Raises sea surface temperatures
    [2020] With reference to Ocean Mean Temperature (OMT), which of the following statements is/are correct? 
    1 OMT is measured up to a depth of 26°C isotherm which is 129 meters in the southwestern Indian Ocean during January — March. 
    2 OMT collected during January – March can be used in assessing whether the amount of rainfall in monsoon will be less or more than a certain long-term mean. 
    Select the correct answer using the code given below: 
    a) 1 only 
    b) 2 only 
    c) Both 1 and 2 
    d) Neither 1 nor 2

  • [16th April 2026] The Hindu OpED: Dry days: On rainfall deficit forecast

    PYQ Relevance[UPSC 2024] What are the major challenges faced by Indian irrigation system in recent times? State the measures taken by the government for efficient irrigation management.Linkage: Rainfall deficit directly stresses irrigation systems and reservoirs. It helps structure answers on water management under weak monsoon conditions.

    Mentor’s Comment

    India is entering a potentially risky monsoon year with the India Meteorological Department forecasting an 8% rainfall deficit (below normal) for the upcoming southwest monsoon. This is significant because it marks a sharp reversal after two consecutive years of surplus rainfall, raising concerns of drought-like conditions. 

    What explains the rising uncertainty in India’s monsoon predictions?

    1. Forecast Variability: IMD predicts 8% deficit with ±5% error margin, indicating inherent uncertainty.
    2. Historical Underestimation: IMD often forecasts “normal” but outcomes lean towards drought conditions.
    3. Lexical Limitation: IMD avoids term “drought,” classifies rainfall below 90% as “deficient,” masking severity.
    4. Case Evidence: 2015 forecast (93% LPA) resulted in 86% actual rainfall, showing prediction gaps.

    How does El Niño structurally impact Indian monsoon patterns?

    1. Ocean Heating Threshold: Central Pacific warming beyond 1°C correlates with weak monsoons.
    2. Statistical Link: 9 out of 16 El Niño years since 1950 resulted in deficient rainfall.
    3. Seasonal Impact: Expected suppression in second half (Aug-Sept), critical for crop maturity.
    4. Temporal Sensitivity: Impact depends on timing of warming, not just occurrence.

    Why is 2019 an important counter-example to El Niño effects?

    2019 is a crucial counter-example to El Niño effects because it defied the traditional, strong inverse correlation between Pacific warming and Indian monsoon rainfall. Despite the development of an El Niño-like state, India experienced above-normal rainfall, highlighting climate system non-linearity and reducing reliance on a single forecasting factor.

    1. Forecast Failure: IMD predicted deficit due to El Niño-like signals.
    2. Outcome Reversal: India experienced above-normal rainfall.
    3. Reason: Ocean warming was weaker than expected, reducing impact.
    4. Inference: Highlights non-linearity and unpredictability in climate systems.

    What role does the Indian Ocean Dipole (IOD) play in moderating risks?

    The Indian Ocean Dipole (IOD) moderates climate risks by acting as a “seesaw” of sea surface temperatures, where a positive IOD (+IOD) can offset the drying, drought-inducing impacts of El Niño on the Indian monsoon. It acts as a risk modifier, where +IOD increases rainfall in East Africa and India, while negative IOD (-IOD) increases drought risks in these regions. 

    1. Counter Mechanism: IOD may offset drying impact of El Niño.
    2. Conditional Effectiveness: Depends on strength and synchronization with monsoon cycle.
    3. Policy Relevance: Adds uncertainty buffer, but not reliable mitigation.

    How do geopolitical and economic factors compound monsoon risks?

    1. West Asia Instability: “War-like clouds” threaten fertilizer and gas supply chains.
    2. Input Cost Pressure: Fertilizer shortages may raise agricultural costs.
    3. Farmer Sentiment: Weak rains + input shocks can reduce sowing confidence.
    4. Macro Impact: Potential rise in food inflation and rural distress.

    What immediate policy responses are necessary to mitigate potential drought impacts?

    1. Fertilizer Security: Stockpiling and supply chain stabilization required.
    2. Water Management: Ensures equitable reservoir distribution, especially stressed regions.
    3. Agricultural Advisory: Provides timely sowing guidance and crop planning.
    4. Preparedness Approach: Shifts from reactive to anticipatory governance.
    5. Groundwater Conservation: Rejuvenate traditional water harvesting structures, such as ponds and tanks, and encourage artificial recharge, especially in over-exploited areas.

    Conclusion

    The anticipated rainfall deficit is not merely a climatic fluctuation but a systemic risk combining meteorological uncertainty, historical forecasting limitations, and geopolitical disruptions. Effective response requires early institutional preparedness, adaptive agricultural strategies, and resilient resource management frameworks.

  • Himalayan Vegetation Shifting Upwards 

    Why in the News?

    • A study published in Ecography shows that alpine vegetation in the Himalayas is shifting upward due to climate change, warming, and reduced snow depth.

    Key Findings

    • Study period: 1999 to 2022 (24 years)
    • Regions studied: Ladakh, Reckong, Ngari, Manthang (Nepal), Khumbu (Mt Everest region), and Bhutan

    Magnitude of Shift

    • Maximum shift: 6.95 metres/year (Manthang, Nepal)
    • Minimum shift: 1.42 metres/year (Khumbu region)
      • Indicates rapid ecological response to warming

    What is Alpine Vegetation

    • Found at: 4,100–5,000 m above mean sea level
    • Above this:
      • Sub-nival zone (5,000–5,500 m) → sparse vegetation
      • >5,500 m → snow, glaciers, rocks

    Causes of Upward Shift

    1. Rising Temperature

    • Himalayas warming faster than global average

    2. Reduced Snow Depth

    • Less snow cover → longer growing season

    3. Climate Change

    • Changes in: Temperature, Moisture, and Nutrient availability

    Greening vs Browning

    Greening

    • Increase in vegetation cover
    • More leafy growth
    • Observed in most regions

    Browning

    • Decline in vegetation / more woody shrubs
    • Seen in: Eastern Himalayas (Khumbu, Bhutan)
    • Main reason: Changes in precipitation patterns
    [2014] If you travel through the Himalayas, you are Iikely to see which of the following plants naturally growing there? 
    1. Oak 
    2. Rhododendron 
    3. Sandalwood 
    Select the correct answer using the code given below 
    [A] 1 and 2 only [B] 3 only [C] 1 and 3 only [D] 1, 2 and 3
  • [15th April 2026] The Hindu OpED: Mapping the legislative vacuum in India’s heat crisis

    PYQ Relevance[UPSC 2024] Industrial pollution of river water is a significant environmental issue in India. Discuss the various mitigation measures to deal with this problem and also the government’s initiatives in this regard.Linkage: The PYQ tests environmental governance + mitigation frameworks, similar to heat crisis requiring policy and institutional response. Both involve anthropogenic environmental stress disproportionately affecting vulnerable populations, demanding regulatory and welfare interventions.

    Mentor’s Comment

    India’s heat crisis reflects the intersection of climate change, labour vulnerability, and governance gaps. The absence of enforceable legal protections exposes structural inequalities. The issue demands integration of climate adaptation, occupational safety, and constitutional rights.

    Why has extreme heat transformed into a systemic national crisis?

    1. Geographical Expansion: Heatwaves now affect coastal and temperate regions, unlike earlier concentration in arid zones.
    2. Rising Vulnerability: Over 57% of districts classified as heat-prone, indicating nationwide exposure.
    3. Demographic Impact: 400-490 million informal workers face direct livelihood risks.
    4. Climate Shift: Transition from seasonal variability to persistent extreme temperature regimes.

    How does heat disproportionately affect informal and vulnerable workers?

    1. Cooling Inequality: Informal workers lack access to cooling infrastructure, unlike affluent populations.
    2. Productivity Loss: Even minor temperature rise leads to significant income decline.
    3. Occupational Exposure: Construction workers, street vendors, sanitation workers face direct heat stress.
    4. Health Risks: Increased incidence of heatstroke, burns, dehydration, especially in waste-handling sectors.
    5. Climate-Caste Nexus: Marginalised communities disproportionately engaged in high-exposure occupations.

    What evidence highlights the severity of ground-level impacts?

    1. Sanitation Workers: Exposure to toxic waste creates micro-climates up to 5°C hotter than surroundings.
    2. Physical Injuries: Reports of burns due to handling heated waste without protective gear.
    3. Economic Impact: Vendors face decline in customers and perishability of goods, reducing income.
    4. Gig Workers: Algorithmic penalties discourage rest during extreme heat alerts.

    What are the key legislative and institutional gaps?

    1. Factories Act, 1948: Covers only indoor workers, excludes outdoor labour.
    2. Occupational Safety, Health and Working Conditions Code, 2020: Lacks enforceable standards for heat exposure.
    3. Discretionary Governance: Section 23 of OSHWC Code, 2020 allows government notification but no mandatory safeguards.
      1. Empowers the appropriate government to declare standards for working conditions, including safety measures.
      2. It allows issuing regulations for occupational safety, including those related to environmental conditions like heat.
      3. However, it is discretionary in nature, meaning:
        1. It does not mandate compulsory heat-protection standards.
        2. It does not ensure enforceable rights for workers, especially outdoor workers.
    4. Absence in Disaster List: Heatwaves not included in Notified National Disaster list, limiting funding.
    5. Fiscal Constraints: While states can use up to 10% of their State Disaster Response Fund (SDRF) for localized disasters, they cannot access the National Disaster Response Fund (NDRF)

    How does the crisis reflect ‘thermal injustice’?

    1. Class Disparity: Heat is inconvenience for affluent, existential threat for poor.
    2. Labour Inequity: Workers forced to choose between health and livelihood.
    3. Policy Exclusion: Informal workers excluded from adaptation strategies.
    4. Urban Inequality: Lack of cooling infrastructure in public spaces worsens vulnerability.

    What policy and governance reforms are required?

    1. Legal Enforcement: Convert heat advisories into binding mandates for districts.
    2. Heat Index Adoption: Combine temperature and humidity for realistic heat assessment.
    3. Occupational Safety: Mandate work-rest cycles and PPE provisions.
    4. Urban Infrastructure: Ensure cooling shelters, water kiosks.
    5. Gig Economy Regulation: Prohibit algorithmic penalties during heat alerts.
    6. Financial Compensation: Introduce income-loss compensation frameworks.
    7. Insurance Models: Expand schemes like parametric heat insurance.

    How can disaster management frameworks be strengthened?

    1. Disaster Classification: Include heatwaves in National Disaster List (2026-31 cycle).
    2. Funding Access: Unlock National Disaster Response Fund (NDRF).
    3. Policy Integration: Align labour laws with climate adaptation strategies.
    4. Institutional Coordination: Integrate IMD alerts with labour and urban governance.

    Conclusion

    India’s heat crisis demands a transition from advisory governance to enforceable rights-based frameworks, integrating climate resilience, labour protection, and social justice. Policy response must prioritise vulnerable populations and institutional accountability.