The Department of Atomic Energy released draft rules under the Sustainable Harnessing and Advancement of Nuclear Energy for Transforming India (SHANTI) Act on 14 August 2026, opening nuclear power generation to private and captive users. Comments are invited until 4 September 2026.
What is the SHANTI Act?
Replaces the earlier state monopoly framework with a licensing regime for non-government operators.
Provides a single composite licence for building, owning, operating and decommissioning a reactor.
Key Provisions
Captive nuclear power: Industries can generate nuclear electricity mainly for their own consumption.
In-principle approval: Allows land acquisition and vendor negotiations before final licensing.
Foreign technology: Imported designs must be certified by the regulator in the country of origin and already operational.
Nuclear liability: Operators must maintain insurance or financial security; a Nuclear Liability Fund is proposed.
Eligible users: Aluminium, cement, data centres, semiconductor fabs and Artificial Intelligence (AI) facilities.
Key Concern
The country-of-origin certification may speed up safety approval but restrict technology sourcing to a few countries. Requiring continued support and retaining Intellectual Property Rights (IPR) with foreign developers could also limit technology transfer and indigenous reactor design.
India’s Nuclear Programme
Stage 1: Pressurised Heavy Water Reactors (PHWRs) using natural uranium.
Stage 2: Fast Breeder Reactors (FBRs) using plutonium.
Stage 3: Thorium-based reactors using Uranium-233 (U-233).
Target:100 GW nuclear capacity by 2047.
Challenges
Supplier liability concerns
Limited regulatory independence
Land and public acceptance
Uranium and fuel constraints
Nuclear waste management
High project costs and long construction timelines
Prelims Pointers
DAE: Department of Atomic Energy
AERB: Atomic Energy Regulatory Board
NPCIL: Nuclear Power Corporation of India Limited
BHAVINI: Bharatiya Nabhikiya Vidyut Nigam Limited
NPT: Nuclear Non-Proliferation Treaty
NSG: Nuclear Suppliers Group
India is not a signatory to NPT and received an NSG waiver in 2008.
[2018, GS3, 15 marks] With growing energy needs should India keep on expanding its nuclear energy programme? Discuss the facts and fears associated with nuclear energy.”
[2020] In India, why are some nuclear reactors kept under “IAEA safeguards” while others are not ?
a) Some use uranium and others use thorium b) Some use imported uranium and others use domestic supplies c) Some are operated by foreign enterprises and others are operated by domestic enterprises d) Some are State-owned and others are privately-owned
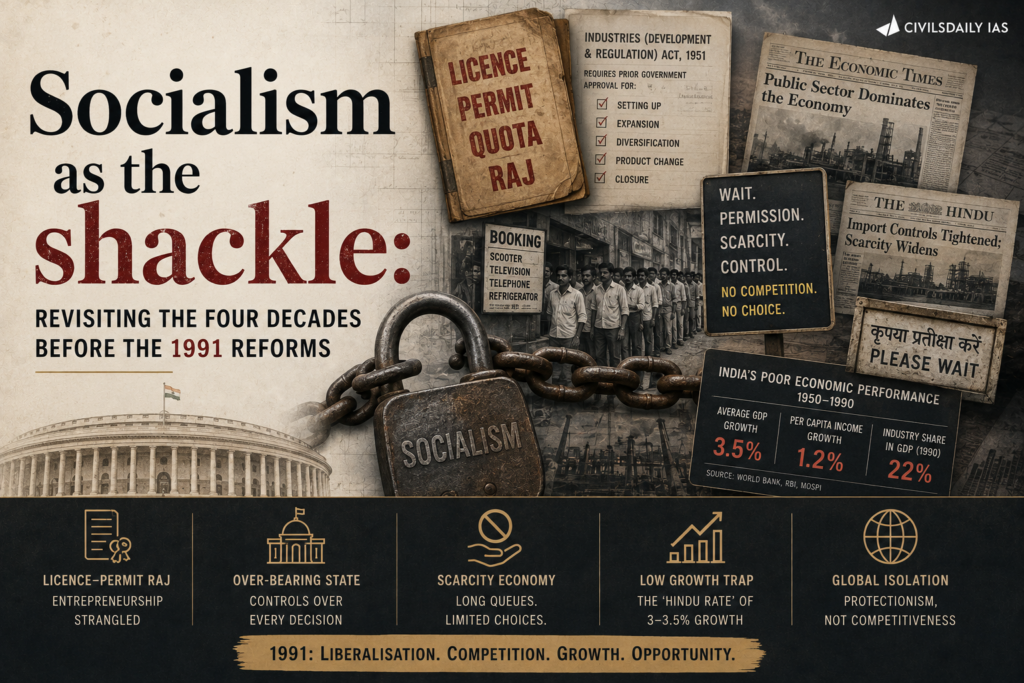
India holds foreign exchange reserves of $700 billion, including 880 tonnes of gold, on its 80th Independence Day. In early 1991 the same reserves had fallen below $1 billion, and the escape required a Prime Minister formed in socialist politics to pledge the country’s gold to foreign banks.
What was the licence permit quota system?
About: The administrative regime under which a private firm needed a government licence to set up capacity, expand output, change product mix or import inputs.
Legal basis: The Industries (Development and Regulation) Act, 1951 reserved industrial licensing to the Centre and listed the industries requiring approval.
Delivery vehicle: Investment was allocated through five year plans, which placed the public sector first in the commanding heights of the economy.
Effect on entry: Capacity was fixed by the licence rather than by demand, so a firm could not expand even when the market grew.
Effect on competition: New entrants competed for approvals rather than for customers, which made the licence itself the scarce asset.
What is a balance of payments crisis?
Definition: A country cannot meet payments for imports and external obligations because its foreign exchange earnings and reserves fall short of what it owes.
The operative measure: Severity is read in import cover, that is the number of weeks of imports the reserves can finance, not in the absolute size of the reserves.
What was the socialist pattern of society resolution?
Adoption: The Congress session at Avadi in Tamil Nadu in 1955 passed a resolution declaring a socialist pattern of society to be the goal of government policy.
Content: It committed the government to state ownership and state direction of the principal means of production.
What is the Bank for International Settlements (BIS)?
Definition: A Basel based institution owned by central banks that functions as a bank to central banks, with operations that made it one of the two lenders against India’s gold in 1991.
Function: It accepts deposits and gold from member central banks and extends short term credit against that collateral.
What was the 42nd Constitutional Amendment Act, 1976?
Preamble change: It inserted the words socialist, secular and integrity into the Preamble of the Constitution.
Wider effect: It also expanded the protection given to laws implementing Directive Principles and curtailed the scope of judicial review, and much of it was reversed by the 44th Amendment.
Why did the 1991 crisis force India to pledge its gold?
Reserve collapse: Foreign exchange reserves fell below $1 billion in early 1991, producing a full balance of payments crisis.
Import cover: The remaining reserves covered only about two weeks of imports.
The only option left: The Reserve Bank Governor advised that India’s gold be mortgaged to the Bank of England and the Bank for International Settlements in Switzerland, and dollars borrowed against it.
Quantum pledged: About 67 tonnes of gold moved out in two consignments during 1991.
Closed markets: A downgrade below investment grade had shut India out of ordinary commercial borrowing, which left collateralised lending as the only route.
How did socialism become the organising idea of Indian economic policy?
1927: A visit to Moscow for the decennial celebration of the October Revolution converted Jawaharlal Nehru to socialism.
1929: As president of the Indian National Congress he declared that India will have to go the socialist way.
1936: A revolt in the Congress Working Committee followed, in which seven senior leaders including Sardar Patel, Rajendra Prasad, C Rajagopalachari, J B Kripalani and Jamnalal Bajaj resigned.
Gandhi’s condition: Mahatma Gandhi extracted a commitment that socialism would not become the Congress’s official policy, and it was honoured as long as Gandhi and Patel were alive.
After 1950: The theme returned, and the 1955 Avadi resolution made a socialist pattern of society the declared goal of government.
Instrumentation: The goal was executed through five year plans and the licence permit quota system, which emphasised state led growth and discouraged individual entrepreneurship.
What did four decades of state led growth actually deliver?
Poverty rose: Decadal data published in 1965 showed the poverty rate had risen from 52.66 per cent to 58.60 per cent.
Food rationing persisted: India was the only country still running food rationing two decades after the Second World War.
Agriculture stagnated: Agricultural productivity remained among the lowest in the world.
The income floor: In Parliament in 1963 it was asserted that 270 million Indians lived on three annas, that is 19 paise, a day while the Prime Minister’s pet dog cost nearly three rupees a day.
Enterprise discouraged: Licensing made official approval rather than consumer demand the binding constraint on production.
Where did ideological commitment collide with fiscal solvency?
The formation: The Prime Minister of 1990 to 1991 had begun his political life under the socialist leaders Acharya Narendra Dev and Ram Manohar Lohia.
The dilemma: Pledging national gold to foreign banks contradicted the economic doctrine he had held throughout that political life.
The counter argument: The Reserve Bank Governor’s case was that the country ranked above the doctrine, and it prevailed.
Who acted: A lame duck government running on a thin majority took the decision that kept India solvent until a reform government could be formed.
Who is credited: The turnaround is attributed to the Prime Minister and Finance Minister who followed, not to the government that pledged the gold.
How much of the 1991 collapse can be attributed to socialism alone?
Oil shock: The Gulf conflict of 1990 raised crude prices and cut worker remittances from West Asia at the same time.
Deposit flight: Non resident deposits were withdrawn rapidly as confidence in repayment fell.
Fiscal position: The fiscal deficit had reached about 8.4 per cent of gross domestic product in 1990 to 1991, financed by borrowing.
Political instability: Three governments in two years delayed every corrective decision.
Model exhaustion: The licensing system had already produced four decades of low growth, so an external shock met an economy with no buffer.
What did other countries do when the same model failed?
China: The Four Modernisations introduced by Deng Xiaoping in 1978 opened agriculture, industry, defence and science and technology to market incentives, with special economic zones as the entry point for foreign capital.
Soviet Union: The planned economy did not reform in time and collapsed along with the state itself in the early 1990s.
Vietnam: The Doi Moi programme from 1986 replaced collective farming with household production and legalised private enterprise.
Poland: The stabilisation programme of 1990 freed prices and made the currency convertible in a single step rather than in stages.
Challenges to the post 1991 reform model
Manufacturing share stagnation: Industry has not absorbed labour at the expected scale, e.g. manufacturing has remained near 17 per cent of gross value added against the 25 per cent target set under Make in India.
Factor market reform stalled: Land and agricultural marketing reform remain politically blocked, e.g. the three farm laws enacted in 2020 were repealed in 2021 after a year of protest.
Labour codes unimplemented: Consolidation of labour law has not translated into uniform practice, e.g. the four labour codes passed by 2020 waited years for States to notify matching rules.
Disinvestment slippage: Public sector exits are announced faster than they are completed, e.g. the sale of Air India concluded in 2022 after two decades of failed attempts.
Credit cycle damage: Directed and concentrated lending has repeatedly produced stress, e.g. the asset quality review of 2015 exposed non performing assets built up in infrastructure and power lending.
Policy predictability: Retrospective changes deter long term capital, e.g. the retrospective tax amendment of 2012 triggered the Vodafone and Cairn arbitrations and was withdrawn only in 2021.
Conclusion
The crisis of 1991 was the terminal cost of a model in which official approval, not consumer demand, set the limit on production. The decisive moment came when a Prime Minister formed in socialist politics accepted that solvency outranked doctrine. Liberalisation removed the licence, but factor markets, manufacturing scale and policy predictability remain unresolved three decades later.
What is Economic Liberalisation?
About: Economic liberalisation is the removal of state controls on entry, capacity, prices and trade so that market signals rather than administrative permission allocate resources.
Rationale: It addresses the shortages, rent seeking and low productivity that follow when output is capped by licence rather than by demand.
Liberalisation: The first element removes industrial licensing, price controls and import restrictions on domestic producers.
Privatisation: The second element transfers ownership or management of state enterprises to private hands and opens reserved sectors to private entry.
Globalisation: The third element integrates the domestic economy with world markets through trade, investment and currency convertibility.
Key Concerns Regarding Economic Liberalisation
Jobless growth: Output growth has not produced proportionate formal employment, leaving a large workforce in low productivity informal work.
Regional divergence: Investment concentrates in States with existing infrastructure, widening the gap with lagging States.
Concentration of market power: Deregulation without strong competition enforcement allows dominant firms to entrench themselves.
External vulnerability: Open capital accounts transmit global shocks quickly through portfolio flows and the exchange rate.
Weak social protection: Removal of administered prices raises the burden on households where targeted transfers are incomplete.
Constitutional Framework Governing Economic Policy in India
Preamble: The word socialist, inserted by the 42nd Amendment in 1976, declares a normative economic orientation without prescribing a specific model.
Article 19(1)(g): Guarantees the freedom to practise any profession or carry on any occupation, trade or business.
Article 19(6): Permits reasonable restrictions on that freedom, including the creation of a complete or partial state monopoly in any trade.
Article 39(b): Directs that ownership and control of material resources be distributed to best subserve the common good.
Article 39(c): Directs that the operation of the economic system not result in concentration of wealth to the common detriment.
Article 31C: Protects laws made to give effect to Articles 39(b) and 39(c) from challenge on specified fundamental rights grounds.
Article 246 with Union List Entry 52: Places industries whose control by the Union is declared expedient in the public interest within Parliament’s exclusive competence, which is the basis of central industrial licensing.
Article 301: Guarantees freedom of trade, commerce and intercourse throughout the territory of India.
Laws and Rules Governing Industrial Policy in India
Industries (Development and Regulation) Act, 1951: Created the licensing system for industrial capacity; it remains in force but licensing now applies to only four industries.
Industrial Policy Resolution, 1956: Classified industries into three schedules and reserved the commanding heights for the public sector.
Monopolies and Restrictive Trade Practices Act, 1969: Restricted expansion by large firms above an asset threshold, and was repealed and replaced by the Competition Act, 2002.
Foreign Exchange Regulation Act, 1973: Capped foreign equity and criminalised exchange violations, and was replaced by the Foreign Exchange Management Act, 1999, which shifted violations from crime to civil penalty.
New Industrial Policy, 1991: Abolished industrial licensing except for a short list, opened reserved sectors and raised the automatic route for foreign investment.
Competition Act, 2002: Shifted regulation from restricting size to prohibiting anti competitive agreements and abuse of dominance.
Insolvency and Bankruptcy Code, 2016: Created a time bound resolution process, which supplied the exit mechanism the licence era economy never had.
Back2Basics: The 1991 New Economic Policy
Trigger: Foreign exchange reserves below $1 billion and import cover of about two weeks.
Gold pledge: About 67 tonnes of gold were pledged to the Bank of England and to a Swiss bank across two consignments in 1991.
Devaluation: The rupee was devalued in two steps on 1 and 3 July 1991, by roughly 9 per cent and 11 per cent.
External support: India drew on an International Monetary Fund standby arrangement, conditioned on fiscal correction and structural reform.
Industrial delicensing: Licensing was abolished for all but 18 industries, a list since reduced to four.
Trade and investment: Import tariffs were cut sharply and foreign direct investment up to 51 per cent was permitted through an automatic route in listed industries.
Government Initiatives for Industrial Growth
Make in India: Launched to raise manufacturing’s share of output and employment through sector specific facilitation.
Production Linked Incentive schemes: Pay incentives on incremental sales in named sectors such as electronics, pharmaceuticals and solar modules.
National Single Window System: Consolidates central and State approvals for a new industrial project into one application portal.
PM GatiShakti National Master Plan: Coordinates infrastructure planning across ministries to reduce logistics cost for industry.
Jan Vishwas (Amendment of Provisions) Act, 2023: Decriminalised a large number of minor business offences to reduce compliance risk.
Startup India: Provides tax benefits, a fund of funds and simplified compliance for recognised new enterprises.
Key Facts about the 1991 Reforms
The Budget of 1991: The reform Budget was presented in July 1991 and paired fiscal correction with trade liberalisation.
Licensing today: Only four industries still require an industrial licence, including alcoholic drinks, tobacco products, defence and aerospace equipment, and industrial explosives.
Reserve position now: Foreign exchange reserves stand at about $700 billion, with gold holdings of 880 tonnes.
Rate of change: Reserves more than doubled over the last twelve years.
Preamble litigation: The presence of the word socialist in the Preamble has been repeatedly challenged, and the Supreme Court has declined to read it as mandating a specific economic model.
Challenges in India’s Industrial Economy
Scale deficit in manufacturing: Firms stay small to retain benefits tied to size, e.g. the majority of registered manufacturing units remain micro enterprises with fewer than ten workers.
Import dependence in key inputs: Assembly has grown faster than component making, e.g. India still imports the bulk of active pharmaceutical ingredients and advanced electronic components from China.
Logistics cost: Freight moves disproportionately by road, e.g. rail’s share of freight traffic has fallen steadily since the 1950s, raising delivered cost for bulk industry.
Land acquisition friction: Project land remains slow and contested to assemble, e.g. the Nandigram and Singur episodes in West Bengal ended two large industrial projects outright.
Skills mismatch: Formal training does not match employer requirements, e.g. employability surveys repeatedly report that a minority of engineering graduates are job ready without retraining.
Power reliability and cost: Industrial tariffs cross subsidise other consumers, e.g. energy intensive units in several States run captive diesel or solar capacity to avoid grid interruption.
Way Forward
Complete factor market reform: Move on land assembly, tenancy and labour rule notification instead of amending statute without implementation.
Tie incentives to competitiveness: Structure production incentives to expire on a fixed schedule so that supported sectors face world prices.
Deepen component ecosystems: Extend support beyond final assembly to component, material and capital goods manufacturing.
Cut logistics cost: Shift bulk freight to rail and coastal shipping through dedicated corridors and multimodal terminals.
Stabilise tax and regulatory expectations: Rule out retrospective taxation by statute and publish advance rulings to reduce litigation.
Align skilling with employers: Fund apprenticeships tied to firm level hiring rather than to enrolment targets.
“[2017, GS3, 15 marks] “Industrial growth rate has lagged behind in the overall growth of Gross-Domestic-Product (GDP) in the post-reform period” Give reasons. How far the recent changes is Industrial Policy are capable of increasing the industrial growth rate?”
PYQ Relevance [UPSC 2016] Pradhan Mantri Jan-Dhan Yojana (PMJDY) is necessary for bringing unbanked to the institutional finance fold. Do you agree with this for financial inclusion of the poorer section of the Indian society? Give arguments to justify your option. Linkage: The PYQ tests whether PMJDY has translated bank-account access into substantive financial inclusion for the poor. The article extends the PYQ by examining the shift from account ownership to actual usage of savings, credit and insurance.
Mentor’s Comment
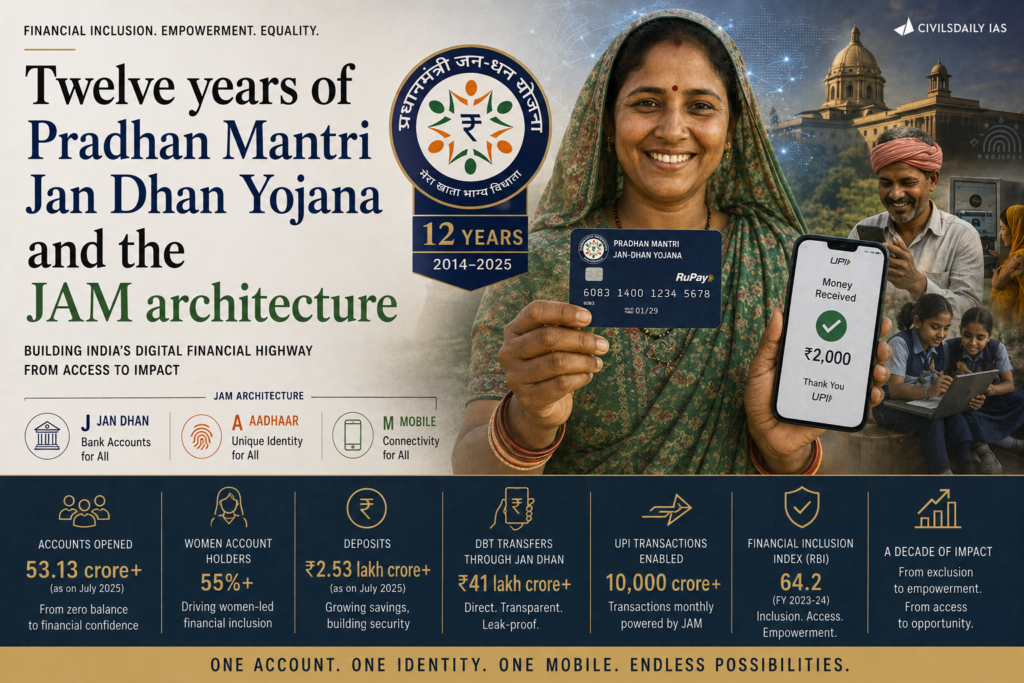
The Pradhan Mantri Jan Dhan Yojana (PMJDY) completed twelve years on Independence Day 2026, having crossed 58 crore accounts with deposits of about ₹3 lakh crore. The milestone exposes the distance between owning a bank account and actually using savings, credit and insurance through it.
What is the Pradhan Mantri Jan Dhan Yojana (PMJDY)?
About: National financial inclusion mission announced from the ramparts of the Red Fort on 15 August 2014 and formally launched at Vigyan Bhawan on 28 August 2014.
Core entitlement: Every household in India was to have a bank account, a RuPay debit card and insurance cover.
Zero balance design: The account can be opened and held without any minimum balance requirement.
Credit attachment: An overdraft facility of up to ₹10,000 is attached to the account so that it functions as more than a deposit box.
Administering authority: The Department of Financial Services, Ministry of Finance, runs the scheme through public and private sector banks.
What is Antyodaya?
Definition: The principle that the most deprived person is the most deserving claimant on the fruits of development.
Origin: The concept was propounded by both Mahatma Gandhi and Deendayal Upadhyaya.
What is the JAM trinity?
Definition: The linking of Jan Dhan bank accounts, Aadhaar digital identity and Mobile connectivity into one delivery rail.
Function: It allows a government payment to reach a verified individual account without passing through any intermediate handling point.
What is Direct Benefit Transfer (DBT)?
Definition: The transfer of a subsidy or entitlement directly into the beneficiary’s bank account instead of through a physical distribution chain.
Purpose: It removes the intermediate custody points at which cash and commodity leakage historically occurred.
What is Digital Public Infrastructure (DPI)?
Definition: Publicly governed digital rails for identity, payments and data sharing on which both government and private services are built.
The Indian stack: Aadhaar supplies identity, the Unified Payments Interface (UPI) supplies payments, and Jan Dhan accounts supply the account layer.
Why did political independence not deliver financial access to millions of Indians?
A distant formal system: Decades after 1947, a bank account, formal credit, insurance and a reliable channel to receive government support could not be taken for granted.
Leakage in delivery: A former Prime Minister acknowledged that when a rupee was sent from Delhi, only 15 paise reached the intended recipient.
No delivery address: Without an account, a citizen had no address to which government money could be sent directly.
Exclusion by balance: Minimum balance requirements made the formal banking system unusable for people whose incomes were small and irregular.
Incomplete freedom: Political freedom remains incomplete where a citizen cannot save securely, receive money directly or reach the institutions through which economic opportunity flows.
Why is access to formal finance treated as a responsibility of the state?
The Chanakya formulation: The launch invoked Sukhasya moolam dharmah, Dharmasya moolam artha, Arthasya moolam rajyam, that the root of happiness is dharma, the root of dharma is artha, and the root of artha is the state.
The claim it carries: Economic means are fundamental to human well being, so creating access to those means is a state obligation and not a discretionary favour.
The Antyodaya test: The architecture was built on the rule that the last person in the queue should not remain outside the system.
Entry point, not benefit: The account was designed as an entry point into the formal economy, not as one more transfer to be received.
A second independence: Sixty seven years after 1947, financial and digital literacy was placed at the centre of the Independence Day address as unfinished national business.
How was the Jan Dhan account designed so that the poorest could keep it?
No entry cost: The zero balance account meant that having little money was no longer a reason to stay outside the banking system.
A usable instrument: The RuPay debit card converted the account from a passbook into a transacting instrument.
Small credit line: The overdraft facility gave the holder a formal alternative to the moneylender for a consumption shortfall.
Embedded insurance: A ₹2 lakh accident insurance cover was attached to the RuPay card without a separate premium payment.
Household unit: Coverage was defined at the household level, so the target was universality rather than a beneficiary list.
What do twelve years of numbers show about the scale of the first step?
Account base: The scheme had crossed 58 crore accounts by July 2026.
Deposits held: Balances in these accounts run into about ₹3 lakh crore.
Women’s share:More than half of all Jan Dhan accounts are held by women.
Geographic spread:Roughly three fourths of the accounts are in rural and semi urban areas.
Average balance: The two figures together imply an average balance of about ₹5,200 per account.
How did a bank account become the first layer of a national digital infrastructure?
First layer of JAM: Jan Dhan supplied the account layer on which Aadhaar identity and mobile connectivity were stacked.
A direct channel: Once accounts were linked to identity and mobile, the government gained a direct route through which benefits could reach a named individual.
Transformed transfers: This changed what Direct Benefit Transfer could actually do, from a pilot idea to the default mode of payment.
Continuity with UPI: The same infrastructure carried the Unified Payments Interface into everyday retail payments.
Cross border reach: A merchant accepting a UPI payment in France in 2026 and a first time account holder of 2014 sit on the same financial infrastructure.
Does opening accounts amount to financial inclusion?
The ownership side: With 58 crore accounts and near universal household coverage, the question of formal access has been settled.
The usage side: Financial inclusion means participation in savings, payments, credit, insurance and economic opportunity, which an account count does not measure.
What the balances say: An average balance of about ₹5,200 indicates that the account works mainly as a receiving channel rather than as a savings instrument.
The credit gap: The overdraft remains the least used component of the design, so formal credit has not displaced the informal lender for most holders.
Dormancy: Close to a fifth of Jan Dhan accounts have been reported inoperative, which means the rail exists but is not always carrying traffic.
Why does a bank account function as a marker of identity?
Recognition with respect: The account gave people from marginalised sections a formal record of existence that the system had rarely offered them.
Visibility: It made those on the periphery visible and counted within the financial system.
The scheme’s own framing: The tagline Mera khaata, bhagya vidhata, my account the destiny maker, states the claim that the account itself changes standing.
Forward link: Financial inclusion is now positioned as an input into the Viksit Bharat 2047 goal.
What are the challenges to the Pradhan Mantri Jan Dhan Yojana?
Inoperative accounts: A large share of accounts records no customer induced transaction for long periods, e.g. the Finance Ministry ran a nationwide fresh KYC drive in 2024 covering roughly 11 crore inoperative Jan Dhan accounts.
Overdraft under use: Banks sanction the overdraft to a small fraction of eligible holders because these borrowers carry no credit score, e.g. lenders treat a zero balance account with irregular inflows as an unscorable credit risk.
Last mile agent viability: Business correspondents earn thin commissions on low value transactions, e.g. Bank Mitras in remote blocks handle deposits too small to cover travel and cash carrying costs.
Duplicate accounts: The 2014 enrolment drive produced multiple accounts per household, e.g. families opened a second account to capture the accident cover, inflating the headline count.
Unclaimed insurance: The accident cover lapses through ignorance of its conditions, e.g. holders do not know the RuPay card must have been used within a qualifying period before the accident for the claim to stand.
Misuse of dormant accounts:Idle zero balance accounts are rented out as conduits for fraud proceeds, e.g. mule account networks flagged by the Indian Cyber Crime Coordination Centre have used dormant no frills accounts.
Conclusion
Twelve years of Jan Dhan have settled the question of access and left the question of use open. The visible achievement is 58 crore accounts; the durable one is the rail that now carries Direct Benefit Transfer and UPI. The unfinished work is converting a receiving account into a working relationship with savings, credit and insurance.
Back2Basics:
What is Financial Inclusion?
About: Financial inclusion is the delivery of banking, payment, credit, insurance and pension services to every section of society at an affordable cost.
Rationale: Exclusion from formal finance forces households into informal credit at punitive rates and denies the state a clean channel to transfer entitlements.
Access: The first dimension is the availability of a formal account and a service point within reach of the household.
Usage: The second dimension is the actual frequency and depth of transactions, savings and borrowing through that account.
Quality: The third dimension covers consumer protection, grievance redress and financial literacy, and it is the dimension the Reserve Bank of India Financial Inclusion Index weights lowest.
Laws and Rules Governing Financial Inclusion in India
Reserve Bank of India Act, 1934: Establishes the central bank and its power to direct banking policy, including branch authorisation and priority sector norms.
Banking Regulation Act, 1949: Governs the licensing and conduct of banks, and is the basis for the Basic Savings Bank Deposit Account norms that permit zero balance accounts.
Aadhaar Act, 2016: Section 7 permits the use of Aadhaar authentication as a condition for receiving a subsidy or benefit funded from the Consolidated Fund of India.
Payment and Settlement Systems Act, 2007: Gives the Reserve Bank authority to regulate payment systems, and is the legal basis for the National Payments Corporation of India operating UPI, RuPay and the Aadhaar Enabled Payment System.
Prevention of Money Laundering Act, 2002 and Rules: Prescribe the customer identification and record keeping obligations that govern account opening and periodic verification.
Pradhan Mantri Jan Dhan Yojana
Ministry or Department: Ministry of Finance, Department of Financial Services.
Launch year: 2014, announced on 15 August and launched on 28 August.
Aims and objectives: Financial inclusion through zero balance accounts, insurance, overdraft and micro pension, forming the first leg of the JAM trinity.
Targeted beneficiaries: Unbanked adults, with a household level coverage target.
Key features: Basic Savings Bank Deposit accounts, an overdraft of up to ₹10,000, an accident cover of ₹2 lakh, and RuPay and Aadhaar Enabled Payment System interoperability.
Record: The scheme holds a Guinness World Record for the most bank accounts opened in a single week during its 2014 rollout.
Government Initiatives for Financial Inclusion
Pradhan Mantri Jeevan Jyoti Bima Yojana: Renewable one year life cover for account holders aged 18 to 50 at a low annual premium.
Pradhan Mantri Suraksha Bima Yojana: Accident death and disability cover for account holders aged 18 to 70 at a nominal annual premium.
Atal Pension Yojana: Guaranteed minimum pension for unorganised sector workers, delivered through the same bank accounts.
Pradhan Mantri Mudra Yojana: Collateral free institutional credit to micro enterprises under the Shishu, Kishore and Tarun categories.
Stand Up India: Bank loans for greenfield enterprises promoted by Scheduled Caste, Scheduled Tribe and women entrepreneurs.
PM SVANidhi: Working capital loans to street vendors, extending formal credit to a category with no collateral.
Key Facts about Financial Inclusion in India
JAM as a term: The JAM trinity entered official vocabulary through the Economic Survey that followed the launch of Jan Dhan.
Financial Inclusion Index: The Reserve Bank publishes an annual composite index built on Access, Usage and Quality, with Usage carrying the largest weight.
Priority Sector Lending: Scheduled commercial banks must direct 40 per cent of adjusted net bank credit to priority sectors, including weaker sections.
Payments banks: A separate bank category was licensed to accept small deposits and offer payments without lending, expanding the service point network.
Aadhaar Enabled Payment System: It allows cash withdrawal at a business correspondent point using fingerprint authentication alone, without a card or a branch.
Challenges in Financial Inclusion in India
Thin rural service points: Banking outlets remain concentrated in towns, e.g. aspirational districts in central India depend on a single business correspondent covering several villages.
Low insurance penetration: Micro insurance uptake stays low despite nominal premiums, e.g. renewal rates for the low cost life and accident schemes fall sharply after the first auto debit year.
Weak grievance redress: New account holders rarely reach an effective complaint channel, e.g. unauthorised debit complaints from rural holders often stop at the branch level and never reach the Banking Ombudsman.
Connectivity failures: Authentication depends on network availability, e.g. Aadhaar Enabled Payment System withdrawals fail in hilly and forest blocks where mobile data is intermittent.
Financial literacy gap: Holders do not understand interest, penalty and claim conditions, e.g. overdraft users treat the limit as a grant rather than as a loan carrying interest.
Gendered control of accounts: Women hold accounts that male household members operate, e.g. transfers under women centred schemes are frequently withdrawn by another family member at the agent point.
Way Forward
Shift the metric: Measure the scheme on transaction frequency, credit uptake and insurance claims settled rather than on accounts opened.
Build alternative credit scoring: Use account transaction history and Account Aggregator consented data to underwrite the overdraft for holders with no formal credit record.
Fix agent economics: Revise business correspondent commissions to reflect distance and transaction cost so that remote service points remain viable.
Run a dormancy clearance cycle: Institutionalise periodic verification and reactivation drives instead of one off campaigns.
Embed literacy in delivery: Attach a short standardised explanation of overdraft interest and insurance claim conditions to every account and card issued.
Harden the rail against misuse: Apply transaction pattern monitoring to dormant zero balance accounts to detect mule account recruitment early.
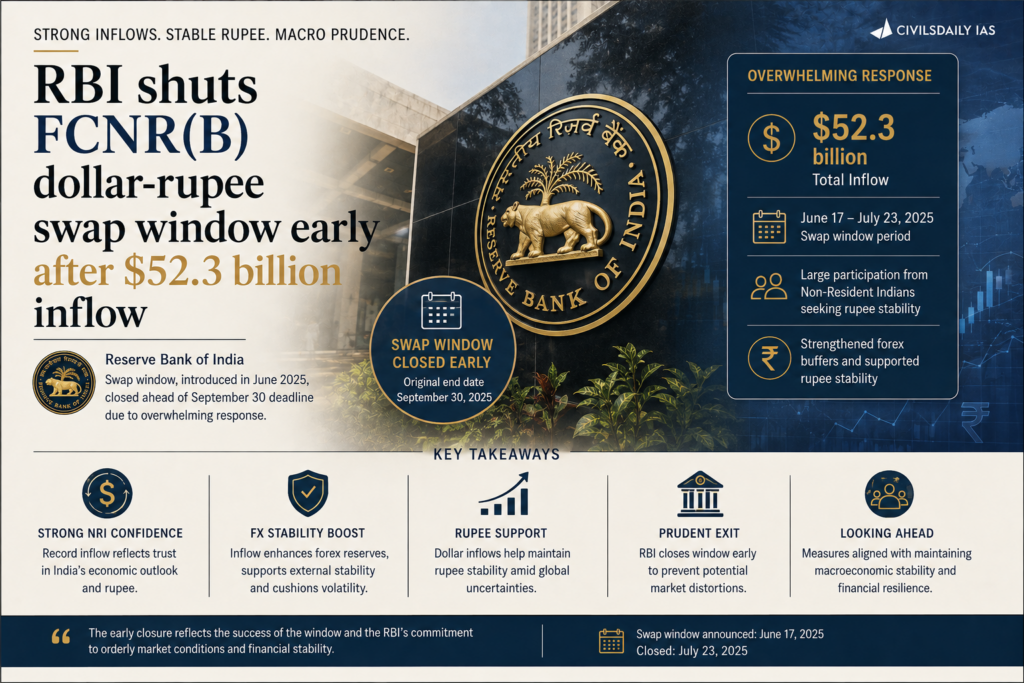
The Reserve Bank of India (RBI) will close its special US dollar-rupee swap window for fresh Foreign Currency Non-Resident (Bank) [FCNR(B)] deposits on 31 August 2026, after attracting $52.3 billion.
What is the FCNR(B) Swap Window?
Banks mobilise fresh 3 to 5 year FCNR(B) deposits in foreign currency.
Banks swap the dollars with the RBI for rupees at a concessional rate.
The RBI returns the dollars when the swap matures.
The concessional rate covers the bank’s hedging cost.
Key Definitions
FCNR(B): Foreign Currency Non-Resident (Bank) term deposit held by NRIs or Persons of Indian Origin in foreign currency.
Hedging Cost: Cost incurred to protect against exchange-rate fluctuations.
ECB: External Commercial Borrowing, or loans raised by eligible Indian entities from non-resident lenders.
OFCB: Overseas Foreign Currency Borrowing, or foreign currency funds borrowed by Indian banks from overseas markets.
Balance of Payments (BoP): Record of all economic transactions between residents of a country and the rest of the world during a period.
Why was the window closed early?
FCNR(B) route attracted $52.3 billion.
Total inflows through the three components reached $56.846 billion by 13 August.
High mobilisation indicated strong response.
Swaps against already mobilised deposits remain possible until 11 September.
Impact on Forex Reserves
India’s foreign exchange reserves reached around $707 billion as of 7 August, with foreign currency assets driving much of the increase.
However, FCNR(B) inflows are debt creating and will eventually require repayment in foreign currency.
“[2021] Consider the following:
1. Foreign currency convertible bonds
2. Foreign institutional investment with certain conditions
3. Global depository receipts
4. Non-resident external deposits.
Which of the above can be included in Foreign Direct Investments?
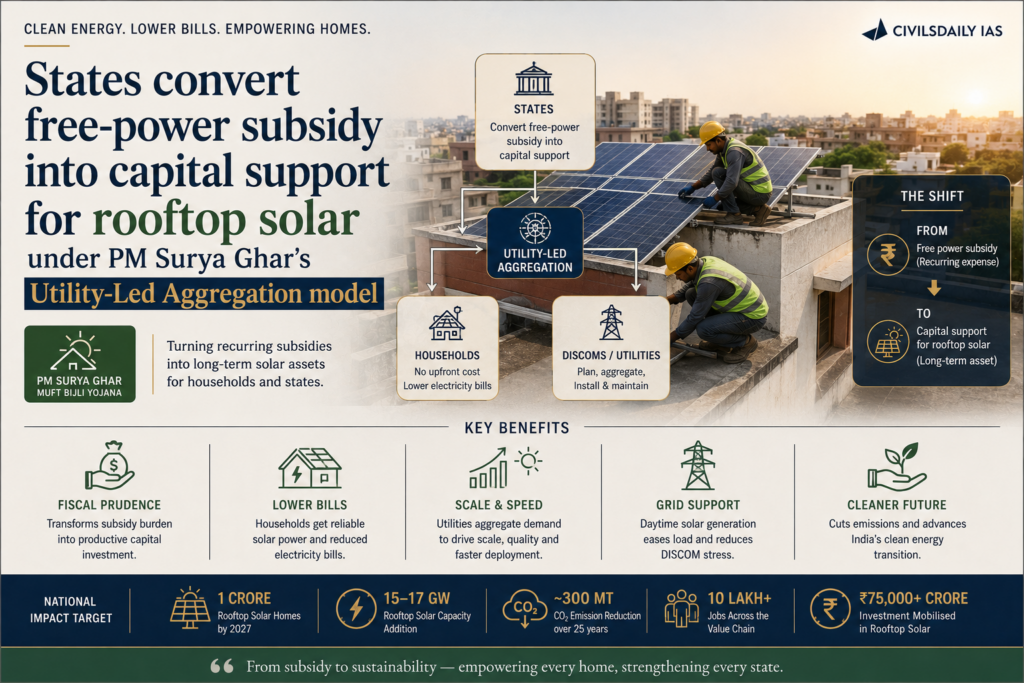
States such as Uttar Pradesh, Andhra Pradesh and Bihar are shifting recurring free-power subsidies towards one-time capital support for rooftop solar under the Utility-Led Aggregation (ULA) model.
What is PM Surya Ghar Yojana?
Ministry: Ministry of New and Renewable Energy (MNRE)
Launch: 13 February 2024
Target: 1 crore households with grid-connected rooftop solar by March 2027.
Outlay: ₹75,021 crore.
Benefit: Up to 300 units of free electricity per month.
Central subsidy: ₹30,000/kW up to 2 kW, plus ₹18,000 for the third kW, capped at ₹78,000.
Eligibility: Household must have a suitable roof and grid connection.
What is ULA?
Utility-Led Aggregation (ULA) is a model where the distribution company (DISCOM) aggregates household demand and arranges rooftop solar installations at scale.
States convert recurring electricity subsidies into one-time capital support for installing solar systems.
Why the Shift?
Reduces recurring State subsidy burden.
Creates a 25-year generating asset.
Reduces DISCOM’s cost of supplying subsidised daytime electricity.
Aggregated procurement can reduce installation costs.
Current Progress
52 lakh households had installed rooftop systems by 13 August.
About 2 lakh of 30 lakh ULA installations are complete.
Target: 1 crore households by March 2027.
Key Definitions
Rooftop Solar: Solar photovoltaic system installed on a building roof and connected to the electricity distribution network.
Net Metering: Allows surplus rooftop electricity exported to the grid to be adjusted against electricity consumed.
DISCOM: Distribution Company responsible for electricity distribution.
ALMM: Approved List of Models and Manufacturers for eligible solar modules.
Challenges
Financial stress of DISCOMs
High upfront installation costs
Limited rooftop access for tenants and apartment residents
No battery-storage subsidy
Grid and transformer capacity constraints
Dependence on imported solar cells and wafers
“[2025] Consider the following statements about ‘PM Surya Ghar Muft Bijli Yojana’:
I. It targets installation of one crore solar rooftop panels in the residential sector.
II. The Ministry of New and Renewable Energy aims to impart training on installation, operation, maintenance and repairs of solar rooftop systems at grassroot levels.
III. It aims to create more than three lakhs skilled manpower through fresh skilling and up-skilling, under scheme component of capacity building.
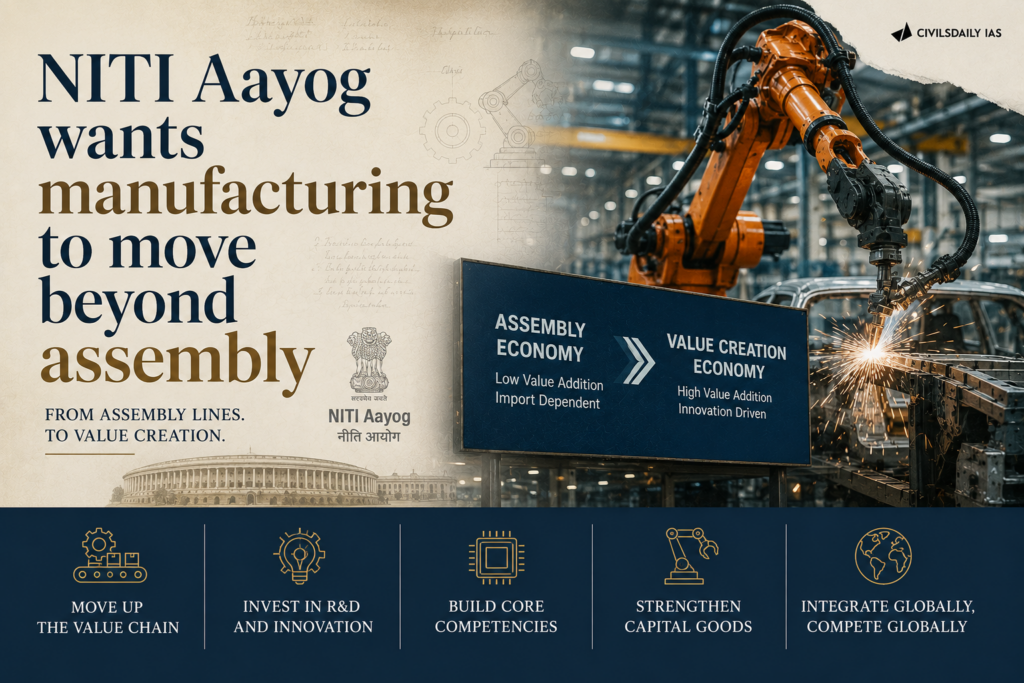
A NITI Aayog report titled Key Sectors to Position India as a Global Manufacturing Hub calls for deeper localisation and value addition across four sectors. It argues that India’s manufacturing remains stuck at assembly, with high import dependence for inputs.
What does the report cover?
Four focus sectors: Chemicals, telecom and networking equipment, textiles, and solar photovoltaic (PV).
Central diagnosis: India assembles finished goods but imports the high-value inputs, capping domestic value addition.
What are the sector-specific findings?
Chemicals: The industry stood at $200-220 billion in FY25, roughly 3% to 3.5% of the global market, growing 6% to 8%.
Textiles: About 80% of textile and apparel producers are MSMEs, limiting scale and technology adoption.
Import reliance: Around 35% of mono-ethylene glycol, a key textile input, is imported.
Solar PV: Domestic capacity depends on imported cells and wafers.
Why does deeper localisation matter?
Value capture: Assembly adds little domestic value, so moving up the chain raises incomes and jobs.
Strategic resilience: Import dependence for inputs exposes India to supply shocks and price volatility.
Trade balance: Substituting imported inputs narrows the manufacturing trade deficit.
What are the challenges to a manufacturing hub strategy
Scale deficit: An MSME-heavy base struggles to achieve globally competitive scale.
Technology gap: Weak research and development limits movement into complex components.
Logistics cost: High freight and power costs erode cost competitiveness.
Skilling shortfall: A shortage of trained industrial labour slows productivity gains.
Input ecosystem: Absence of a domestic supplier base for critical inputs keeps assembly dependent on imports.
Conclusion
The report reframes the manufacturing goal from output volume to domestic value addition. Its recommendations depend on building an input-supplier ecosystem, which the Production Linked Incentive (PLI) scheme alone has not delivered.
Back2Basics
Government Initiatives for manufacturing
Make in India: Umbrella programme to raise manufacturing’s share of GDP.
Production Linked Incentive (PLI) scheme: Output-linked incentives across 14 sectors.
National Manufacturing Mission: Announced to coordinate sectoral manufacturing push.
MUDRA & Credit Guarantee Scheme: Improve access to institutional credit for MSMEs, supporting investment, expansion and employment generation.
Semicon India Programme: Supports semiconductor fabrication, packaging and related ecosystems to build strategic manufacturing capabilities and reduce import dependence.
Key Concepts
Assembly vs. Value Addition
Assembly-led model: Importing components and assembling finished products in India.
Value-added manufacturing: Domestic production of components, intermediate goods, technology and final products.
Key concern: High domestic output does not necessarily mean high domestic value capture.
China+1 Strategy
Global firms are diversifying supply chains beyond China.
India can leverage this opportunity, but competitive costs, reliable infrastructure and deeper localisation are essential.
PYQ Relevance
[UPSC 2025] Discuss the rationale of the Production Linked Incentive (PLI) scheme. What are its achievements? In what way can the functioning and outcomes of the scheme be improved?
Linkage: The 2025 PYQ examines the role and effectiveness of the PLI scheme in strengthening India’s manufacturing sector. The report highlights the need to move beyond assembly towards deeper localisation, domestic value addition and stronger supplier ecosystems.
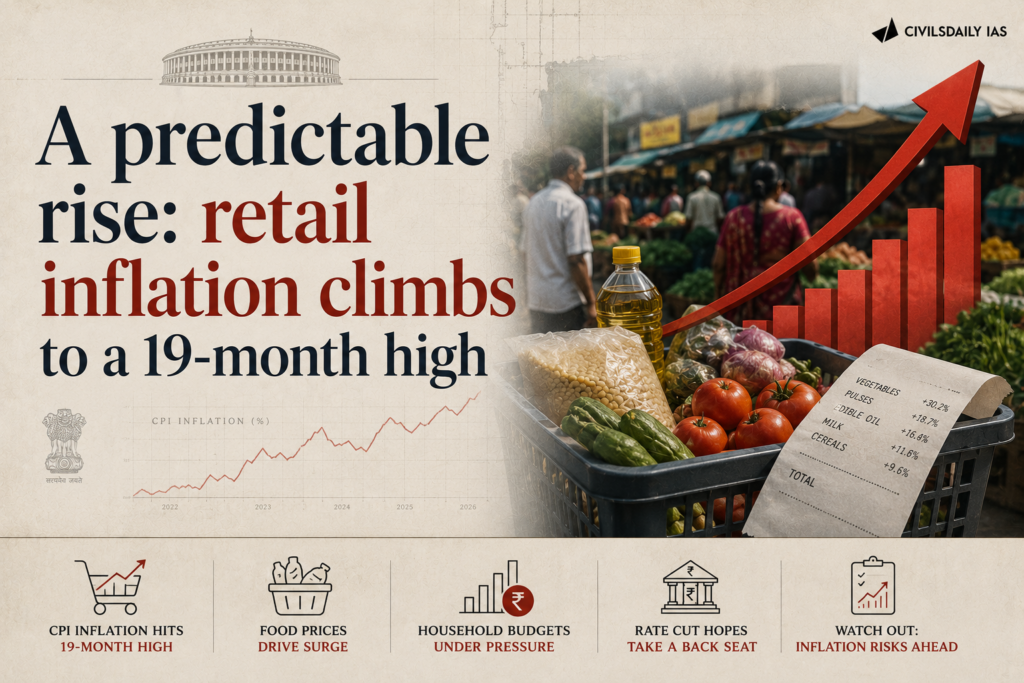
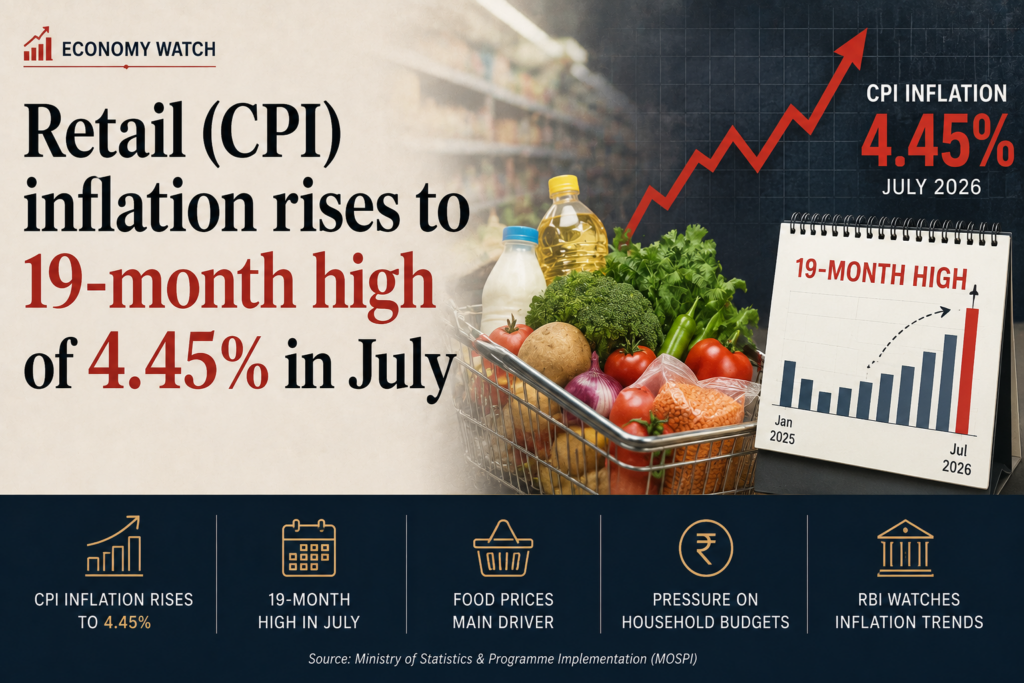
Retail inflation rose to 4.45% in July 2026, its highest reading in 19 months. The number stayed above the Reserve Bank of India (RBI) target of 4% for a second straight month, even as the central bank held its policy rate.
What is the Consumer Price Index (CPI) inflation target framework?
Flexible inflation targeting: The RBI is mandated to keep CPI inflation at 4%, within a tolerance band of 2% to 6%.
Monetary Policy Committee (MPC): A six-member committee sets the repo rate to steer inflation toward that target.
Mandate basis: The framework flows from the amended Reserve Bank of India Act, 1934, and a 2016 agreement between the government and the RBI.
What is driving the price rise?
Food inflation: Vegetables led the increase, with sharp jumps in onion, garlic and ginger prices.
Fuel and transport:Higher energy costs fed into the headline number.
Rural stress:Rural food inflation ran ahead of the national average.
Imported pressure: A depreciating rupee and disrupted West Asian crude supply raised input costs.
Why does core inflation tell a calmer story?
Core below 3%: Inflation excluding food and fuel stayed under 3%, showing weak underlying demand pressure.
Divergence: The gap between headline and core inflation points to a supply-side food shock rather than broad overheating.
Why did the RBI hold the repo rate?
Rate on hold: The MPC kept the repo rate at 5.25% for a fourth straight meeting.
Balancing act: A food-driven spike is not easily controlled by interest rates, so the RBI avoided tightening into a supply shock.
Conclusion
Headline inflation is being pushed by food and fuel, not by demand. The RBI has chosen to hold rates, and the trajectory depends on whether the monsoon eases vegetable prices in the coming months.
Back2Basics
What is Fiscal versus Monetary control of inflation?
Monetary tools: Repo rate, cash reserve ratio, and open market operations, used by the RBI to manage demand-side inflation.
Fiscal and supply tools: Buffer stocks, import duty cuts, and export curbs, used by the government to tackle food-supply shocks.
Types of Inflation
Headline Inflation: Overall CPI inflation, including food and fuel.
Core Inflation: Inflation excluding volatile food and fuel prices.
Food Inflation: Rise in prices of food items such as cereals, vegetables, pulses and edible oils.
Demand-Pull Inflation: Caused by aggregate demand growing faster than supply.
Cost-Push Inflation: Results from rising input costs such as fuel, wages and raw materials.
Imported Inflation: Domestic prices rise due to higher global commodity prices or currency depreciation.
Built-in Inflation: Persistent inflation arising from wage-price expectations and indexation.
Why Food Inflation Matters in India
Policy Challenge: Food inflation is largely supply-driven, limiting the effectiveness of monetary policy alone.
High CPI Weight: Food has a large weight in the CPI basket, making food-price changes strongly influence headline inflation.
Household Impact: Food inflation directly erodes purchasing power, especially for low-income households.
Rural Vulnerability: Rural households spend a larger share of income on food, making them more exposed to food-price shocks.
Inflation Expectations: Persistent food inflation can raise wage and price expectations, creating second-round effects. (Secod Round Effect: Persistent food inflation can spill over into wages, input costs and inflation expectations, turning a temporary supply shock into broader inflation.)
PYQ Relevance
[UPSC 2024] What are the causes of persistent high food inflation in India? Comment on the effectiveness of the monetary policy of the RBI to control this type of inflation.
Linkage: The PYQ talks about food inflation and limits of RBI monetary policy. Current inflation shows how supply-side food shocks can persist despite subdued core inflation.
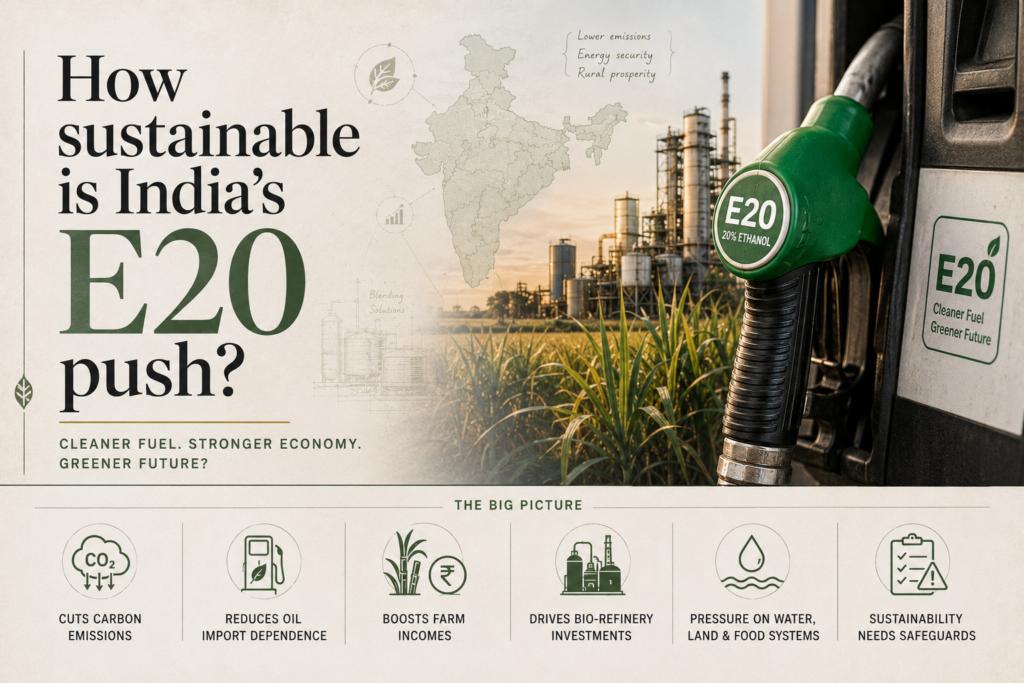
The government has told Parliament that its ethanol blending programme has saved large sums of foreign exchange, while Opposition leaders have launched campaigns arguing that E20 harms vehicles and is being forced on people. The debate exposes a tension between the energy security and forex gains of blending 20 per cent ethanol into petrol and the costs it imposes on the country’s large legacy vehicle fleet and, potentially, on food security. The dispute now runs through disputed damage studies and feedstock diversion.
What is E20?
About: E20 is petrol blended with 20 per cent ethanol, meant to replace a fifth of transport petrol with domestically produced ethanol.
Objective: The government targeted 10 to 11 billion litres of ethanol so that the money stays in the Indian economy rather than flowing out as a foreign exchange outgo on crude oil imports.
What is ethanol and why does it affect engines?
Polar solvent: Ethanol is a polar solvent that degrades older rubber compounds and plastics, hardening and cracking fuel hoses over time.
Hygroscopic behaviour: Ethanol absorbs atmospheric moisture, and in parked vehicles the ethanol-water mixture separates and forms an acidic layer that corrodes tanks, damages fuel pumps, and clogs filters with sludge.
What is the status of ethanol production?
Capacity ramp-up: India’s distillery capacity now can produce some 18 to 20 billion litres from around 500 distilleries.
Procurement contracted: For this ethanol year, which runs November to October, oil companies have contracted to procure some 10.5 billion litres of ethanol.
Feedstock mix: Government figures show 45 per cent of ethanol for petrol blending will come from maize, Food Corporation of India (FCI) rice about 22 per cent, sugarcane juice 16 per cent, B-heavy molasses about 10 per cent, damaged foodgrains around 4.5 per cent, and C-heavy molasses 1.1 per cent.
Maize expansion: India’s maize output grew 45 per cent in three years to 55 million tonnes in 2025-26, with more than 20 per cent of it going into ethanol.
Will E20 spur corn imports from the United States?
No import surge: There is no evidence of a surge in ethanol or maize imports in Ministry of Commerce statistics.
Import ban: Direct ethanol import for petroleum blending is banned, even as the US corn lobby pushes India to increase corn imports.
Sugar stocks stable: The closing stock of sugar was around 5 million tonnes and is expected to hold, indicating diversion to ethanol has not affected sugar availability.
Conditional risk: In the event of monsoon failure, crop losses, and foodgrain shortages, diversion of FCI rice, sugarcane juice, and B-heavy molasses will come under stress. This raises the possibility of corn imports.
Which vehicles are affected, and which are not?
Newer fleet safe: Vehicles bought after April 2023, when the Bharat Stage 6 Phase 2 mandate took effect, were factory-engineered for E20 with ethanol-resistant elastomers, fluorinated fuel lines, upgraded pump seals, and recalibrated engine control units.
Scale of newer fleet: These roughly 70 million vehicles are about 23 per cent of India’s active petrol fleet and face little cause for concern.
Legacy fleet at risk: The remaining 77 per cent, nearly 240 million legacy two-wheelers and cars built for E5 or E10, are the genuine worry.
Do the damage claims hold up? (the central tension)
Consumer complaints: Consumer surveys by LocalCircles found 66 per cent of pre-2023 owners reporting mileage losses exceeding 10 per cent, and 55 per cent reporting increased maintenance.
Institutional defence: IIT Kanpur’s Engine Research Laboratory maintains E20 causes no notable damage, with efficiency loss under 5 per cent, attributing most complaints to driving habits and traffic conditions.
Field disputes: Independent mechanics and automotive communities dispute this, citing real-world fuel pump and injector failures traced to ethanol’s solvent and low-lubricity properties.
Manufacturer data: The government told Parliament that one manufacturer serviced 2.84 crore vehicles in FY 2025-26, including about 1.5 crore legacy vehicles, without finding E20-linked engine damage, and reported an efficiency penalty of about 2 to 6 per cent in some E10-designed vehicles.
Why has the rollout drawn criticism?
Speed of transition: India reached the 10 per cent milestone in 2022 and ramped up to 20 per cent within three years, with very little information and advisories from manufacturers.
Contrast with Brazil: Brazil’s transition to high ethanol levels happened over several decades in a stable manner, alongside vehicle modifications, taking the public into confidence.
Information gap: The compressed rollout left legacy vehicle owners without clear guidance on effects and maintenance.
Has ethanol blending eased the oil supply burden?
Forex saving: The government said the programme has saved around 2 lakh crore rupees of foreign exchange and substituted some 32 million tonnes of crude oil imports.
Import substitution: Substituting 10 billion litres of petrol with ethanol amounts to dispensing with about a month of crude imports.
Price shielding claim: The government said that while crude prices rose 70 per cent during the war in West Asia, pump petrol prices rose only 7 to 8 per cent, though under-recoveries also increased.
Cost ambiguity: Oil companies procure ethanol at around 70 rupees per litre, and with the base price of petrol at 55 to 60 per cent of the pump price, it is difficult to conclude independently that ethanol has kept prices down.
Conclusion
The central idea is that E20 delivers real forex and energy-security gains but shifts costs onto a legacy fleet of nearly 240 million vehicles whose damage claims remain contested between consumer surveys and institutional studies. What remains unresolved is a transparent, phased communication of effects and maintenance, and a food-security cushion if monsoon failure forces feedstock diversion. A Brazil-style stable transition would have taken the public into confidence.
National Biofuel Policy: About
About: The National Policy on Biofuels sets targets for blending ethanol in petrol and biodiesel in diesel to cut import dependence.
Feedstock scope: It permits multiple feedstocks including sugarcane, damaged foodgrains, maize, and other surplus grains.
Blending target: The policy advanced the 20 per cent ethanol blending target, which India pursued aggressively from 2022.
Government Initiatives for Biofuels
Ethanol Blended Petrol (EBP) Programme: Mandates blending of ethanol with petrol and drives procurement by oil companies.
Pradhan Mantri JI-VAN Yojana: Supports second-generation ethanol from agricultural residues.
SATAT initiative: Promotes compressed biogas as a transport fuel from waste and biomass.
Key Facts about Ethanol Blending
Ethanol year: Runs from November to October.
Grades of molasses: B-heavy and C-heavy molasses are distinct sugar-industry by-products used as feedstock.
BS6 Phase 2: Took effect in April 2023 and coincided with factory engineering of vehicles for E20.
Challenges to the E20 push
Legacy fleet damage: Corrosion, hose degradation, and pump failures in pre-2023 vehicles.
Efficiency loss: Lower energy density reduces mileage, disputed in magnitude.
Food-fuel conflict: Diversion of rice, maize, and sugar feedstock risks food security in a bad monsoon.
Water intensity: Sugarcane and maize cultivation for ethanol strains groundwater.
Consumer information deficit: Rapid rollout without adequate advisories.
Cost transparency: Different tax and costing regimes obscure whether ethanol lowers pump prices.
Way Forward
Phased communication: Issue clear manufacturer advisories on effects and maintenance for legacy vehicles.
Feedstock diversification: Expand second-generation ethanol from residues to reduce grain diversion.
Food-security buffer: Build safeguards to pause grain diversion during monsoon failure.
Independent testing: Commission transparent, independent studies on legacy-vehicle impacts.
Consumer redress: Provide guidance and support for owners of affected pre-2023 vehicles.
PYQ Relevance
“[2020] According to India’s National Policy on Biofuels, which of the following can be used as raw materials for the production of biofuels?
India’s CPI (Consumer Price Index) inflation rose to 4.45% in July, driven mainly by food and fuel prices, while remaining within the RBI’s tolerance band.
What is CPI?
CPI = Consumer Price Index
Measures changes in retail prices of a fixed basket of goods and services.
India’s CPI was rebased to 2024.
Sector-wise data under the new series is available from January 2026.
What Drove Inflation?
Food inflation: 5.52%.
Onion inflation: 22.54%.
Restaurants & accommodation: 7.7%.
Transport: 4.4%.
Personal care: 14.8%.
What Remained Stable?
Core inflation: 3.9%, excluding food and fuel.
Health inflation: 1.3%.
Recreation: 1.6%.
Stable core inflation suggests limited demand-pull pressure, with the current rise largely driven by supply-side factors.