The Ministry of New and Renewable Energy (MNRE) launched the Green Hydrogen Certification Portal of India (GHCI) to ensure transparent certification and regulatory compliance for green hydrogen production.
GHCI
Developed by MNRE (Ministry of New and Renewable Energy).
Certifies green hydrogen under the Green Hydrogen Certification Scheme of India (GHCI Scheme).
Enhances transparency, traceability, and market credibility.
National Green Hydrogen Mission (NGHM)
Launched in 2023.
Outlay: ₹19,744 crore.
Targets by 2030
5 Million Metric Tonnes (MMT) of green hydrogen production.
125 Gigawatt (GW) dedicated renewable energy capacity.
₹8 lakh crore investment.
6 lakh jobs.
Reduction of 50 million tonnes of carbon dioxide (CO₂) emissions annually.
Key Progress
6 States have dedicated Green Hydrogen Policies; 7 States have integrated hydrogen into existing policies.
Incentives awarded to 15 companies for 3,000 MW (Megawatt) per year electrolyser manufacturing capacity.
Under SIGHT (Strategic Interventions for Green Hydrogen Transition), incentives approved for 8.62 lakh Metric Tonnes Per Annum (MTPA) of green hydrogen production.
Contracts awarded for 30,000 MTPA green hydrogen supply to refineries.
Agreements signed for 6.7 lakh MTPA of Green Ammonia supply to 11 fertilizer plants.
₹84 crore sanctioned for hydrogen injection pilot projects in the steel sector.
₹208 crore allocated for 37 hydrogen-powered vehicles and 9 refuelling stations.
₹113 crore allocated for Research and Development (R&D) projects.
₹100 crore startup fund; first 9 startups approved with ₹22 crore support.
Green Hydrogen
Hydrogen produced through electrolysis using renewable energy.
A zero-carbon fuel for sectors such as steel, fertilizers, refineries, shipping, and heavy transport.
[2023] With reference to green hydrogen, consider the following statements: 1. It can be used directly as a fuel for internal combustion. 2. It can be blended with natural gas and used as fuel for heat or power generation. 3. It can be used in the hydrogen fuel cell to run vehicles. How many of the above statements are correct?
The National Statistical Office (NSO) released the PLFS Monthly Bulletin for May 2026, showing a marginal softening in labour market conditions, while urban unemployment fell to its lowest level in one year.
Key Highlights (15 years and above, Current Weekly Status)
Labour Force Participation Rate (LFPR)
Overall LFPR: 54.4%
April 2026: 55.0%
May 2025: 54.8%
Rural LFPR: 56.6%
Urban LFPR: 49.8%
Female LFPR
Overall female LFPR: 32.8%
Rural female LFPR: 36.7%
Urban female LFPR: 24.8%
Urban female participation remained broadly stable compared to the previous month.
Worker Population Ratio (WPR)
Overall WPR: 51.4%
April 2026: 52.2%
May 2025: 51.7%
Rural WPR: 53.8%
Urban WPR: 46.6%
Urban WPR remained largely unchanged.
Unemployment Rate (UR)
Overall UR: 5.5%
Rural UR: 5.1%
Urban UR: 6.4%
April 2026: 6.6%
May 2025: 6.9%
Urban unemployment reached its lowest level since May 2025.
Urban Unemployment
Female urban UR: 8.2%
Male urban UR: 5.9% (unchanged from April 2026).
About PLFS
Conducted by the National Statistical Office (NSO) under the Ministry of Statistics and Programme Implementation (MoSPI).
It is India’s primary survey on employment and unemployment.
Since January 2025, the methodology has been modified to provide monthly and quarterly estimates.
[2020] With reference to the Indian economy after the 1991 economic liberalization, consider the following statements:
1.Worker productivity (Rs. per worker at 2004 — 05 prices) increased in urban areas while it decreased in rural areas. 2.The percentage share of rural areas in the workforce steadily increased. 3.In rural areas, the growth in non-farm economy increased. 4.The growth rate in rural employment decreased.
Which of the statements given above is/are Correct? a) 1 and 2 only b) 3 and 4 only c) 3 only d) 1, 2 and 4 only
India’s growth story is increasingly being shaped by logistics efficiency rather than income growth alone. There is a structural shift from a “hard-to-serve” economy to a “reachable” economy, where reliable logistics determines whether demand can actually translate into consumption. Also, India has improved from 44th rank in 2018 to 38th rank in 2023 in the World Bank’s Logistics Performance Index (LPI).
What does the shift from a “Hard-to-Serve” to a “Reachable” Economy signify?
Hard-to-Serve Markets: Consumers possess purchasing power but remain disconnected from efficient supply chains.
Reachability: Logistics networks ensure reliable movement of goods irrespective of geographic distance.
Demand Realisation: Consumption materialises only when products are physically available.
Economic Inclusion: Smaller towns and rural markets become part of mainstream consumption networks.
Structural Shift: Market access increasingly matters as much as income growth.
How is India’s Growth Narrative Shifting from Income to Reachability?
Traditional Growth Drivers: Wages, remittances, rural credit, and consumption expenditure have historically dominated macroeconomic discussions.
Emerging Constraint: Distribution efficiency rather than production capacity increasingly determines consumption expansion.
Distance Economics: Physical distance now affects demand realization more than production availability.
Consumption Geography: Growth increasingly depends on whether products can reliably reach underserved markets.
Reachability Paradigm: Economic opportunity is shifting from income availability to market accessibility.
How Have Logistics Reforms Reduced Internal Market Frictions?
Reduced Friction: Policy reforms have steadily lowered internal trade barriers.
Economic Corridors: Strengthen movement of goods across regions.
Line-Haul Predictability: Improves consistency of long-distance freight movement.
Digital Systems: Enhance shipment tracking and visibility.
Supply-Chain Transparency: Reduces uncertainty in inventory planning and replenishment.
Market Integration: Creates a more unified national market.
What Does India’s Logistics Performance Reveal?
World Bank LPI Improvement: India improved from 44th rank (2018) to 38th rank (2023) among 139 countries.
Competitiveness Gains: Reflects improvements in logistics infrastructure and service quality.
Infrastructure Modernization: Indicates gradual strengthening of transport and supply-chain ecosystems.
Expressway Connectivity: Supports reliable movement between production and consumption centres.
Competitive Inclusion: Small firms can participate in national markets.
Example: A farm-gate producer operating on thin margins can now serve distant markets with greater confidence due to predictable transportation schedules and reduced delivery uncertainty.
Why Does the Last-Mile Gap Remain India’s Biggest Logistics Challenge?
Operational Reality: Infrastructure efficiency on paper does not always translate into service quality.
Urban Congestion: Causes delays despite improved transport corridors.
Land Constraints: Limit logistics facility expansion.
India’s growth increasingly depends on converting purchasing power into actual consumption through efficient logistics. By improving market reachability and reducing supply-chain frictions, logistics is emerging as a key enabler of demand growth, economic integration, and inclusive development.
Value Addition
The National Logistics Policy (NLP)
It is a comprehensive, cross-sectoral framework launched in 2022, to reduce domestic logistics costs and enhance the global competitiveness of Indian goods.
Managed by the Department for Promotion of Industry and Internal Trade (DPIIT), the policy optimizes the “soft infrastructure” (processes, digital integration, and regulatory systems) to complement the hard infrastructure built under the PM GatiShakti National Master Plan.
Core Targets (To be Achieved by 2030)
Reduce Costs: Lower India’s logistics cost from 13-14% of GDP to a single-digit global benchmark (under 10%).
Improve Global Ranking: Propel India into the top 25 nations on the World Bank’s Logistics Performance Index (LPI).
Data-Driven Infrastructure: Build automated Decision Support Systems (DSS) for data-backed logistics planning.
Comprehensive Logistics Action Plan (CLAP)
The NLP executes its objectives through eight critical action areas outlined in the Comprehensive Logistics Action Plan:
Integrated Digital Logistics Systems: Merging multiple ministry platforms into one central gateway.
Physical Asset Standardization: Standardizing containers, trucks, and warehouses to improve service quality.
Human Resource Development: Building unified training modules to skill India’s massive logistics workforce.
State Engagement: Aligning central targets with state-level logistics actions and local city plans.
EXIM Logistics: Addressing structural bottlenecks to ease Export-Import container movement.
Service Improvement Framework: Setting up quick-response cells to clear regulatory and industry roadblocks.
Sectoral Efficiency Plans: Designing specialized movement plans for primary commodities like coal, steel, and grains.
Logistics Park Facilitation: Accelerating the development of Multi-Modal Logistics Parks (MMLPs).
PYQ Relevance
[UPSC 2021] “Investment in infrastructure is essential for more rapid and inclusive economic growth. Discuss in the light of India’s experience.”
Linkage: The question examines the role of infrastructure as a catalyst for economic growth, market integration, and inclusive development. The article demonstrates how logistics infrastructure, through Dedicated Freight Corridors, PM Gati Shakti, Bharatmala, digital logistics platforms, and supply-chain reforms, is reducing market frictions and improving reachability
India has announced measures to facilitate ethanol-petrol blends beyond E20, including the decision to permit ethanol blends ranging from 22% to 30% at retail outlets and proposed amendments to recognize E85 and higher blends under the Central Motor Vehicles Rules. This is the first major policy move toward creating a flex-fuel vehicle ecosystem in India.
What is E20 Fuel and Why is it Important?
Definition: E20 is a fuel blend containing 20% ethanol and 80% petrol by volume.
Ethanol: Ethyl alcohol produced primarily from sugarcane molasses, sugar syrup, maize, damaged food grains, and agricultural biomass.
National Standard: E20 has become India’s standard petrol blend under the Ethanol Blended Petrol (EBP) Programme.
Target Achievement: India advanced its E20 target from 2030 to 2025 and achieved rollout in several regions ahead of schedule.
Strategic Objective: Reduces crude oil imports, improves energy security, lowers carbon emissions, and provides additional income opportunities for farmers.
Supply Diversification: Expands use of domestically produced biofuels.
Agricultural Economy
Farmer Support: Creates stable demand for sugarcane and other ethanol feedstocks.
Regional Benefits: Strong support from agricultural regions, particularly Maharashtra and Uttar Pradesh, major sugarcane-producing states.
Climate and Decarbonization Goals
Cleaner Fuel: Ethanol blending reduces lifecycle carbon emissions compared with pure petrol.
Biofuel Expansion: Supports India’s National Biofuel Policy objectives.
Why is the E20 transition itself still incomplete?
Recent Transition: E20 became the nationwide standard only recently.
Limited Adaptation Time: Many vehicle owners have had insufficient time to assess long-term impacts.
Legacy Fleet: Large numbers of older vehicles remain on roads.
How can higher ethanol blends affect vehicle performance?
Engine Damage Concerns
Water Absorption: Ethanol attracts moisture and is corrosive in nature.
Material Degradation: May affect engine components not designed for higher ethanol content.
Vulnerable Components: Rubber parts, valves, piston heads and fuel-system components may experience wear.
Two-Wheeler Concerns: Older two-wheelers may face greater compatibility challenges.
Mileage Reduction
Lower Energy Density: Ethanol contains less energy than petrol.
Fuel Efficiency Impact: Consumers may experience lower mileage.
Estimated Loss: Mileage reduction could range between 5% and 12%, depending on vehicle design and model year.
Cold Start Problems
Ignition Issues: Higher ethanol content burns at a higher temperature.
Winter Performance: Vehicles may experience difficulty starting during cold mornings.
Are concerns regarding engine damage scientifically established?
Scientific Uncertainty
Government Position: Petroleum Ministry maintains that concerns regarding higher ethanol blends are not fully supported by conclusive scientific evidence.
Industry Assessment: Automobile experts acknowledge that long-term impacts require more extensive studies.
Vehicle Variation: Effects may differ across manufacturers, engine designs and vehicle age.
Long-Term Wear
Potential Risks: Accelerated wear of rubber parts, valves and piston heads remains a concern raised by industry stakeholders.
Data Gap: Long-duration field studies remain limited.
Material Compatibility: Fuel-system components require redesign for higher ethanol concentrations.
Corrosion Resistance: Manufacturers must improve resistance to ethanol-induced corrosion.
Durability Standards: Vehicle endurance testing requirements will increase.
Certification Challenges
Homologation Requirement: New fuel blends require fresh certification.
Current Approval Base: Existing vehicles are largely certified only for E20 compatibility.
Regulatory Delays: Industry seeks greater clarity before implementation.
Cost Implications
Higher Manufacturing Costs: Vehicle redesign increases production costs.
Consumer Burden: Additional costs likely to be passed on to consumers.
What fuel availability and market challenges remain?
Limited Consumer Choice
Single Blend Availability: Oil Marketing Companies (OMCs) currently indicate that only one ethanol blend may be available at a given fuel station.
No Fuel Selection: Consumers may not have freedom to choose between multiple blends.
Infrastructure Readiness
Distribution Constraints: Fuel stations require storage and dispensing adjustments.
Supply Chain Adaptation: OMCs must ensure uninterrupted supply of multiple blends.
Pricing Concerns
Vehicle-Fuel Compatibility: Consumers may need to consider both vehicle type and fuel availability.
Market Uncertainty: Pricing structure for higher blends remains unclear.
How has Brazil successfully implemented high ethanol blending?
Oil Shock Origins: Brazil’s ethanol programme began during the 1970s oil crisis.
Integrated Ecosystem: Ethanol production and automobile manufacturing evolved together.
Consumer Choice: Nearly every fuel station offers both petrol and ethanol options.
Flexible Fuel Market: Consumers can choose fuel based on price and availability.
Current Brazilian System
Blended Petrol: Contains approximately 27-32% ethanol.
Pure Ethanol Option: Availability of E100 (hydrous ethanol).
Flex-Fuel Dominance: Majority of vehicles can operate on multiple fuel blends.
Key Difference from India
Consumer Flexibility: Brazil offers fuel choice, whereas India currently lacks such flexibility.
Ecosystem Maturity: Brazil’s transition evolved over decades.
Value Addition
Ethanol Blending Programme (EBP)
Launch: Initiated in 2003, Accelerated under National Biofuel Policy.
Targets
E10 achieved nationwide.
E20 target achieved ahead of schedule in many regions.
Long-term movement toward higher blends and flex-fuel systems.
Conclusion
India’s transition beyond E20 marks the next phase of its energy security and biofuel strategy. Higher ethanol blends and flex-fuel vehicles can reduce crude oil dependence, strengthen farmer incomes, and support climate goals. However, the success of this transition will depend on a calibrated rollout, scientific validation of engine compatibility, adequate fuel infrastructure, consumer choice, and industry preparedness. The challenge is not merely increasing ethanol content but creating a reliable and economically viable flex-fuel ecosystem, as demonstrated by Brazil’s experience.
PYQ Relevance
[UUPSC 2018] Access to affordable, reliable, sustainable and modern energy is the sine qua non to achieve Sustainable Development Goals (SDGs). Comment on the progress made in India in this regard.
Linkage: The question examines India’s efforts towards achieving energy security through sustainable and alternative energy sources. India’s transition from E20 to higher ethanol blends (E25, E85 and flex-fuel vehicles) represents a major component of its clean energy and energy security strategy. Ethanol blending reduces crude oil imports, supports decarbonisation of the transport sector, and contributes to SDG 7 (Affordable and Clean Energy), SDG 12 (Responsible Consumption and Production), and SDG 13 (Climate Action).
Promotion of Hybrid and Round-the-Clock (RTC) renewable projects.
International Cooperation
India-UK Offshore Wind Taskforce launched in 2026.
Cooperation with Belgium focuses on offshore wind and R&D.
Offshore wind partnership with Denmark, initiated in 2019, was renewed in 2025.
[2025] Consider the following statements about ‘PM Surya Ghar Muft Bijli Yojana’: I. It targets installation of one crore solar rooftop panels in the residential sector. II. The Ministry of New and Renewable Energy aims to impart training on installation, operation, maintenance and repairs of solar rooftop systems at grassroot levels. III. It aims to create more than three lakhs skilled manpower through fresh skilling, and upskilling, under scheme component of capacity building. Which of the statements given above are correct?
India has unveiled the Coal Exchange Rules, 2026, marking a major structural reform in the coal sector. For the first time, coal will be traded through regulated exchange platforms similar to power exchanges
What are the Coal Exchange Rules, 2026?
The Coal Exchange Rules, 2026, notified by the Ministry of Coal, establish a legally binding framework for transparent, electronic “many-to-many” spot mineral trading. Regulated by the Coal Controller Organisation, the rules aim to improve price discovery and market access for consumers.
Key Features of the Rules
Electronic Trading: The system transitions coal marketing from the traditional “one-to-many” bilateral model to an efficient, competitive digital trading platform where multiple buyers and sellers can transact.
Mandatory Physical Delivery: All transactions must culminate in physical delivery of the coal. These are supported by independent quality verification to ensure contractual compliance.
Regulatory Oversight: The Coal Controller Organisation acts as the central market regulator, handling the registration, supervision, and auditing of exchanges, as well as enforcing safeguards against market manipulation.
Registration Validity: Eligible entities (incorporated as companies under the Companies Act, 2013) are granted authorizations to establish and operate exchanges for 25 years.
Financial Obligations: Operators pay a ₹50 Lakh one-time registration fee, a ₹3 Lakh application fee, and an annual fee calculated as either ₹30 Lakh or 0.02% of the total trading volume, capped at ₹5 Crore.
How can coal exchanges transform India’s coal market structure?
Market-Based Trading: Establishes regulated platforms for buying and selling coal through transparent mechanisms.
Price Discovery: Creates market-driven price signals instead of relying primarily on bilateral negotiations.
Transparency: Reduces opacity associated with traditional contractual arrangements.
Competition: Enables broader participation by producers and consumers.
Secondary Markets: Facilitates development of coal trading beyond primary allocation channels.
Why is the existing coal allocation mechanism considered inadequate?
Long-Term Contracts: Most coal transactions currently occur through long-duration agreements, particularly for the power sector.
Auction Dependence: Significant volumes are allocated through auctions where prices may rise substantially.
Coal India Dominance: Non-regulated consumers often depend on Coal India auctions.
Premium Pricing: Coal is frequently sold at premiums to the highest bidder.
Limited Market Signals: Existing mechanisms provide inadequate real-time information regarding shortages and surpluses.
What lessons can be drawn from India’s power exchange experience?
Market Signalling: Power exchanges evolved into indicators of scarcity and surplus conditions.
What institutional safeguards are required for successful implementation?
Volatility Management: Ensures protection against excessive price fluctuations.
Dispute Resolution: Provides mechanisms for conflict settlement.
Logistics Integration: Strengthens transportation and delivery systems.
Regulatory Oversight: Ensures compliance and market integrity.
Settlement Systems: Facilitates efficient trading and delivery.
Conclusion
The Coal Exchange Rules, 2026 represent a shift from administrative allocation towards market-based coal governance. Their success will depend on quality standardisation, liquidity creation, Coal India’s participation, efficient logistics, and strong regulatory oversight. If implemented effectively, coal exchanges can become an important mechanism for balancing regional shortages, improving transparency, and strengthening India’s energy security.
Value Addition
Coal Sector at a Glance
Coal accounts for around 70% of India’s electricity generation.
India is the second-largest coal producer globally.
Coal India Limited produces roughly 80% of India’s domestic coal output.
Major coal-producing states: Odisha, Chhattisgarh, Jharkhand, Madhya Pradesh and Telangana.
About the Coal Controller Organisation (CCO)
The Coal Controller Organisation (CCO) is a subordinate office under the Ministry of Coal. Established in 1916 during World War I, it is one of the oldest regulatory bodies in India’s energy sector.
Headquartered in Kolkata, the CCO operates field offices across major mining hubs including Delhi, Dhanbad, Ranchi, Bilaspur, Nagpur, Sambalpur, and Kothagudem.
Core Regulatory Functions: The CCO derives its executive powers from various statutes, including the Colliery Control Rules, 2004, the Collection of Statistics Act, 2008, and the Coal Bearing Areas Act, 1957. Its primary responsibilities include:
Production and Grade Surveillance: The CCO inspects collieries to verify the correctness of declared coal classes, grades, and sizes. It establishes and enforces strict coal grading and quality standards.
Dispute Resolution: It serves as the official appellate authority to resolve quality and grade conflicts between coal producers and consumers.
Mine Approvals: No coal mine, seam, or section can be opened, reopened, or sub-divided without formal opening/reopening permissions from the CCO. It also approves Mining and Mine Closure Plans.
Captive Mine Monitoring: The organization tracks and monitors the development and progress of captive coal and lignite blocks allocated to various companies.
Statistical Authority: The CCO acts as the primary source for national coal statistics. It collects monthly production data and publishes the Provisional Coal Statistics and Coal Directory of India.
Land Acquisition Hearing Authority: Under the Coal Bearing Areas (Acquisition & Development) Act, the Coal Controller hears legal objections regarding the government’s acquisition of coal-bearing land.
New Role Under the Coal Exchange Rules, 2026: Following the notification of the Coal Exchange Rules, 2026, the CCO’s regulatory footprint has significantly expanded:
Central Market Regulator: The government designated the CCO as the apex statutory body to register, regulate, and audit electronic Coal Exchanges in India.
Platform Authorization: The CCO processes registrations for eligible entities, granting them 25-year operational licenses to run digital spot trading platforms.
Market Surveillance: It monitors exchange activities to prevent market manipulation, ensure fair price discovery, and resolve stakeholder grievances.
Coal India Limited (CIL)
Coal India Limited (CIL) is a Maharatna Public Sector Undertaking (PSU) that serves as the backbone of India’s energy security infrastructure.
Production Volume: World’s largest coal-producing company, accounting for roughly 80% of India’s total domestic coal output.
Operates under the Ministry of Coal.
Plays a central role in India’s energy security architecture.
The Mumbai-Ahmedabad High-Speed Rail (MAHSR) Project, India’s first bullet train corridor, has achieved major construction milestones in 2026 and is expected to commence operations from August 2027.
About MAHSR
India’s first High-Speed Rail (HSR) corridor.
Foundation stone laid in September 2017.
Corridor Length: 508 km.
Connects: Maharashtra, Gujarat, and Dadra & Nagar Haveli
Implemented by the National High Speed Rail Corporation Limited (NHSRCL).
The corridor comprises 12 stations
Sabarmati Station: Planned as a multimodal transport hub.
Integrates: Bullet Train, Metro, BRTS, and Conventional Railways.
Speed and Travel Time
Design Speed: 350 km/h
Operational Speed: 320 km/h
Mumbai-Ahmedabad journey time: Around 1 hour 58 minutes
High-Speed Rail refers to rail systems operating at more than 250 km/h.
Technology Used
Developed using Japanese Shinkansen technology.
Introduces India’s first domestic high-speed rail ecosystem.
Major Technical Features
J-Slab ballastless track technology.
2×25 kV overhead traction system.
More than 20,000 OHE masts (Overhead Equipment Mast) is a vital vertical steel support used in railway electrification
12 traction substations (electrical substation that converts power from the public electricity grid into the specific voltage, current, and frequency required to power railways, trams, or trolleybuses)
16 distribution substations(electrical facility that receives high-voltage power from transmission or sub-transmission systems and “steps down” the voltage to medium levels).
Rolling stock depots at: Sabarmati, Surat, and Thane.
Engineering Highlights
Elevated Corridor
Around 90% of the corridor is elevated.
Uses Full Span Launching Method (FSLM).
FSLM is about 10 times faster than conventional segmental construction.
River Bridges: Total: 25 river bridges: Gujarat: 21. Maharashtra: 4.
Steel Bridges: 28 steel bridges over highways, canals, rivers and railway lines.
India’s First Undersea Rail Tunnel
Located beneath Thane Creek.
Tunnel Length: 21 km.
Undersea Stretch: 7 km.
Uses: Tunnel Boring Machine (TBM) and New Austrian Tunnelling Method (NATM).
TBM cutter head diameter: 13.6 metres (largest in an Indian railway project).
Safety Systems
Early Earthquake Detection System:28 seismometers. Detects primary waves and triggers automatic power shutdown.
Rainfall Monitoring System: 6 rain gauge stations. Provides real-time rainfall data to the Operation Control Centre (OCC).
Wind Speed Monitoring System:14 anemometer stations. Monitors wind speed and direction. Speed restrictions imposed when wind speeds exceed prescribed thresholds.
Economic Significance
Expected to generate: Around 4,000 direct jobs. 35,000 to 40,000 indirect jobs.
Supports Make in India through technology transfer and domestic manufacturing.
Dedicated High-Speed Rail Training Institute established at Vadodara.
Union Budget 2026-27: Proposed High-Speed Rail Corridors
Delhi-Varanasi, Varanasi-Patna-Siliguri, Chennai-Bengaluru, Bengaluru-Hyderabad, Chennai-Hyderabad, Mumbai-Pune, and Pune-Hyderabad
[2023] Consider the following statements : 1. In a seismograph, P waves are recorded earlier than S waves. 2. In P waves, the individual particles vibrate to and fro in the direction of wave propagation, whereas in S waves, the particles vibrate up and down at right angles to the direction of wave propagation. Which of the statements given above is/are correct?
The near-completion breakthrough of the Zojila Tunnel, being constructed at an altitude of 11,578 feet, marks one of India’s most ambitious and technically demanding infrastructure achievements.
What is the Zojila Tunnel?
The Zojila Tunnel is a 13-km bi-directional road tunnel being constructed beneath the Zojila Pass in the Himalayas.
Located at an elevation of 11,578 feet, it aims to provide all-weather connectivity between Kashmir Valley and Ladakh.
The project is among India’s most challenging infrastructure undertakings due to the complex geological and environmental conditions associated with Himalayan terrain.
How does Himalayan geology make tunnel construction exceptionally difficult?
Young Fold Mountains: The Himalayas are geologically young and remain tectonically active, resulting in unstable rock formations.
Variable Rock Strata: Rock composition can change within a few metres, creating unpredictable excavation conditions.
Structural Weaknesses: Rock formations contain fractures, cracks, fault zones, and shear zones that reduce stability.
Loose Geological Material: Engineers encounter loose rocks, boulders, and weak strata requiring different support systems.
Why do altitude and climatic conditions increase construction risks?
High Elevation: Construction occurs at approximately 11,578 feet, reducing worker efficiency and equipment performance.
Extreme Cold: Temperatures may fall to -30°C.
Harsh Winters: Severe weather limits construction windows.
Avalanche Threats: Snow avalanches create risks for workers and infrastructure.
Operational Challenges: Combustion engines and heavy machinery experience reduced efficiency at high altitude.
Why is water ingress one of the biggest engineering challenges in the Himalayas?
Stored Water Reservoirs: Mountains contain large volumes of groundwater trapped within rock layers.
Snowmelt Contribution: Melting snow continuously adds to underground water systems.
Water Ingress: Excavation frequently intersects water-bearing zones.
Hydrostatic Pressure: Excessive water pressure can destabilize tunnel structures.
Flooding Risk: Uncontrolled seepage may trigger tunnel flooding and structural failures.
Striking Observation
Massive Water Storage: Geological assessments indicate that Himalayan mountains may contain water volumes comparable to an “ocean’s worth” of stored water.
Why are shear zones and tectonic stresses particularly dangerous?
Shear Zones: High-strain zones create instability during excavation.
Rock Deformation: Tectonic pressure continuously alters stress distribution.
Collapse Risk: Excavation may trigger localized failures in weak zones.
Dynamic Conditions: Geological conditions often change unexpectedly during drilling.
What safety measures were adopted during the Zojila Tunnel project?
Ventilation Infrastructure: Three shafts were constructed along the tunnel length.
Emergency Response: Shafts provide access for rescue and evacuation operations.
Deep Access Shafts: The first shaft is 474.3 m deep, making it the deepest in India.
Additional Shafts: The second shaft is 367.5 m deep, while the third shaft is 213.5 m deep.
Operational Safety: Ventilation systems ensure worker safety during construction and future operation.
How does the New Austrian Tunnelling Method (NATM) help overcome Himalayan challenges?
The New Austrian Tunneling Method (NATM) is a modern, observational tunneling approach that reinforces the surrounding rock or soil, allowing it to deform slightly and become part of the tunnel’s primary load-bearing structure.
Selective Excavation: Facilitates controlled blasting based on rock conditions.
Sequential Construction: Excavation proceeds in stages rather than full-face excavation.
Top-Heading Method: Upper tunnel section is excavated first, followed by the lower section.
Adaptive Design: Allows modifications according to changing geological conditions.
Risk Reduction: Enhances stability in weak and variable rock formations.
About the NATM
Principle: “The surrounding rock mass itself becomes part of the support system.”
Key Components
Shotcrete: Sprayed concrete for immediate stabilization.
Rock Bolts: Reinforce fractured rock.
Monitoring Systems: Continuous assessment of rock behaviour.
Flexible Design: Engineering response adjusted to site conditions.
How are water and structural stability managed during excavation?
Drainage Pipes: Facilitate controlled water discharge.
Pressure Management: Prevents buildup of hydrostatic pressure.
Rock Bolting: Stabilizes fractured rock masses.
Shotcrete Lining: Binds loose rock surfaces.
Alignment Modification: Tunnel route can be altered to bypass weak geological sections.
Site-Specific Design: Tunnel shape and support configuration vary according to local conditions.
Why does the Zojila Tunnel have strategic significance beyond engineering?
All-Weather Connectivity: Reduces dependence on the seasonally closed Zojila Pass.
Regional Integration: Strengthens connectivity between Kashmir and Ladakh.
Defence Logistics: Improves movement of military personnel and supplies.
Economic Development: Facilitates tourism, trade, and local livelihoods.
National Infrastructure Capacity: Demonstrates India’s capability to execute mega-projects in difficult terrain.
Conclusion
The Zojila Tunnel demonstrates the intersection of strategic infrastructure, geological science, and engineering innovation in one of the world’s most challenging mountain environments. Its construction highlights the necessity of adaptive engineering, advanced tunnelling techniques, and robust safety systems for infrastructure development in the Himalayas. The project serves as a model for future high-altitude infrastructure while strengthening regional connectivity, national security, and economic integration.
Value Addition
Major Himalayan Infrastructure Projects
Zojila Tunnel: Kashmir-Ladakh connectivity.
Atal Tunnel: Rohtang Pass, Himachal Pradesh.
Sela Tunnel: Arunachal Pradesh.
Z-Morh Tunnel: Sonamarg connectivity.
PYQ Relevance
[UPSC 2016] The Himalayas are highly prone to landslides. Discuss the causes and suggest suitable measures of mitigation.
Linkage: The question examines the geological fragility, instability, and hazard-prone nature of the Himalayan mountain system. The Zojila Tunnel highlights how young Himalayan geology creates major engineering and disaster-management challenges during infrastructure construction.
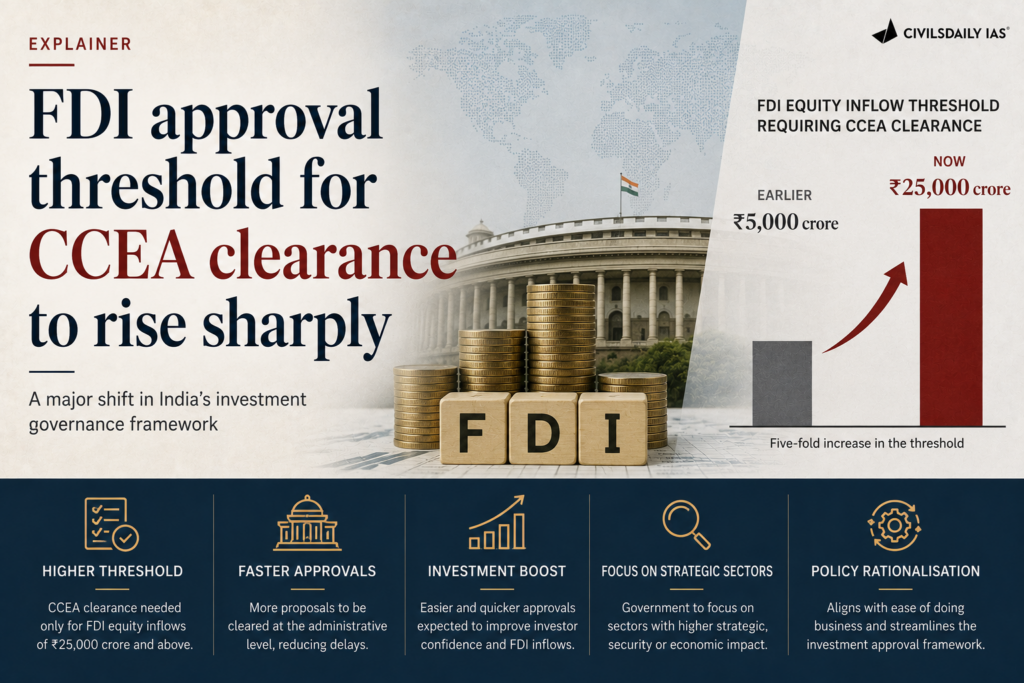
India’s net FDI has witnessed an extraordinary collapse, falling from almost $44 billion in 2020-21 to less than $1 billion in 2024-25, even as gross FDI inflows recovered to $94.6 billion. This sharp divergence has reignited debate over whether India is becoming a less attractive investment destination.
Why has India’s net FDI declined so sharply despite strong gross inflows?
Net FDI Measurement: Net FDI under the Balance of Payments (BoP) framework is calculated after adjusting gross inflows for FDI-related outflows.
Sharp Decline: Net FDI fell from nearly $44.0 billion in 2020-21 to less than $1 billion in 2024-25.
Strong Gross Inflows: Gross FDI inflows recovered to $94.6 billion in 2025-26.
Misleading Interpretation: Weak net FDI is often interpreted as a sign of declining investor confidence, while strong gross inflows are presented as evidence of economic strength.
Underlying Reality: Both views overlook the changing composition of international capital flows and the mechanisms governing inflows and outflows.
Does the conventional FDI debate overlook important structural changes?
Incomplete Narrative: Public discourse focuses primarily on aggregate FDI numbers rather than the nature of investments.
Shift in Focus: Policy gradually prioritised attracting larger inflows, while concerns regarding future external payment obligations and investment quality received less attention.
Need for Assessment: Evaluating FDI requires examining investor categories, sectoral allocation, and associated outflows rather than focusing solely on inflow volumes.
What types of FDI are entering India and how do they differ in developmental impact?
Traditional or Real FDI
Source: Multinational enterprises investing directly in production and services.
Contribution: Brings technology, brands, managerial capabilities, and production know-how.
Impact: Supports long-term industrial development and employment generation.
Financial Investor FDI
Source: Private equity funds, venture capital funds, sovereign wealth funds, and asset managers.
Objective: Capital appreciation rather than production expansion.
Impact: Provides financial capital but contributes less to technology transfer and industrial capacity creation.
Diaspora and SPV-Based Investments
Mechanism: Capital raised abroad and channelled through offshore financial centres.
Instrument: Special Purpose Vehicles (SPVs).
Characteristic: Frequently associated with round-tripping of domestic funds.
How has the composition of FDI changed in recent years?
Real FDI Share: Accounted for only 41.9% of effective inflows between 2022-23 and 2025-26.
Financial Investor Share: Contributed 40.5% of effective inflows.
Diaspora/SPV Share: Represented 17.6% of total inflows.
Developmental Concern: A rising share of financial investors and SPVs reduces the developmental gains usually associated with traditional FDI.
Technology Transfer: Becomes weaker when investments are motivated primarily by financial returns rather than production activity.
Why do rising investor exits matter for understanding net FDI trends?
Exit Signals: Business model of financial investors involves eventual exits through stake sales and disinvestment.
Large Exit Example: Singapore’s Temasek exited Schneider Electric India in 2025.
Scale of Exit: Exit generated approximately $6.4 billion.
Initial Investment: Around $637 million invested in 2020.
Return Multiple: Approximately 45 times the original investment.
PE and VC Exits: Foreign private equity and venture capital investors accounted for around $29 billion in outflows.
Implication: Such exits substantially increase capital outflows and depress net FDI.
Are gross FDI figures overstating actual fresh capital entering India?
Accounting Inclusion: Gross FDI statistics include intra-group ownership reorganisations.
Mergers and Acquisitions: Included even when no fresh capital enters the country.
Share Swaps: Recorded as FDI transactions despite limited resource transfer.
ECB Conversions: Conversion of external commercial borrowings into equity inflates inflow figures.
Blind Spot: Gross FDI figures often fail to distinguish between fresh investment and accounting transactions.
Illustrative Example: Large transactions involving Bosch and Mesee Technologies can significantly influence sectoral trends without necessarily bringing new productive capital.
Why can high gross FDI figures create a misleading picture of investment performance?
Gross FDI Recovery: Gross FDI inflows recovered to $94.6 billion, often cited as evidence of India’s continued attractiveness to foreign investors.
Accounting Transactions: Gross FDI statistics include intra-group ownership restructuring, mergers and acquisitions, share swaps, and conversion of external commercial borrowings (ECBs) into equity.
Limited Fresh Capital: Such transactions may alter ownership structures without necessarily bringing substantial new capital, technology, or productive capacity into the economy.
Sectoral Distortions: Large corporate restructuring exercises can inflate FDI numbers and create an impression of strong investment activity in particular sectors.
Developmental Concern: High gross inflows do not automatically translate into employment generation, manufacturing expansion, technology transfer, or export competitiveness.
Why is the decline in manufacturing FDI a major concern?
Four-Year Decline: Manufacturing FDI has fallen continuously for four consecutive years.
Low Share: Manufacturing accounted for only 10.6% of total effective inflows during the latest four-year period.
Employment Implications: Reduces potential for large-scale job creation.
Strategic Concern: Limits India’s ambition to become a major global manufacturing hub.
Does rising outward FDI represent globalisation or capital flight?
Rapid Growth: India’s outward FDI has increased significantly.
Sectoral Concentration: Around 45% of outward investments during 2023-24 to 2025-26 flowed into financial services, insurance, and business services.
Destination Pattern: Singapore and the UAE accounted for approximately 27% and 11% respectively.
Corporate Example: Tata Motors-owned subsidiary in Singapore invested $405 million to acquire IVECO Group in Italy.
GIFT City Link: FDI routed through GIFT City increased from $246 million in 2023-24 to $1.8 billion in 2025-26.
Extended Route: Total inflows and outward FDI through this channel reached approximately $1.40 billion, indicating expanding two-way flows.
Dual Interpretation: Outward FDI may indicate both global expansion of Indian firms and relocation of capital across jurisdictions.
How are FDI-related outflows reshaping India’s external sector?
Disinvestment Outflows
Magnitude: Disinvestment and capital withdrawals totalled approximately $178.9 billion.
Drivers: Secondary sales, IPO exits, and share buybacks.
Dividend Remittances
Amount: Reached $118.9 billion.
Source: Profits paid by multinational subsidiaries and affiliates, excluding reinvested earnings.
Intellectual Property Payments
Amount: Totalled $46.6 billion.
Nature: Payments for intellectual property and royalty use.
Estimated Allocation: Around 75% of total IPR payments assumed to be attributable to multinational subsidiaries and affiliates.
Technical and Service Payments
Amount: Around $250 billion transferred through technical and service/consultancy payments.
Difficulty: Separation between foreign and domestic company payments remains challenging.
Overall Outflows
Adjusted Outflows: Even after excluding OFDI, technical service payments, dividends and IPR-related outflows, total outflows remained around $344.4 billion.
Deteriorating Ratio: For every dollar of fresh inflow (excluding reinvested earnings), approximately $1.50 flowed out.
Historical Comparison: Outflow per dollar of inflow rose from 56 cents (2014-15 to 2017-18) to 70 cents (2018-19 to 2021-22) before reaching the current high.
Why should policymakers focus on the quality rather than the quantity of FDI?
Technology Transfer: Real FDI contributes more effectively to technological upgrading.
Industrial Development: Manufacturing-oriented FDI strengthens domestic production capabilities.
Investor Diversity: Different investor categories generate different developmental outcomes.
Policy Evaluation: FDI performance should be assessed through technology gains, industrial capacity creation, employment generation, and external-sector implications rather than gross inflow figures alone.
Core Message: Headline FDI numbers conceal important changes in investor composition, entry modes, exit strategies, and developmental impact.
Conclusion
India’s falling net FDI highlights that the quality and composition of foreign investment matter more than headline inflow numbers. Rising disinvestment, profit repatriation, and financial-investor-led flows have weakened net inflows despite strong gross FDI. Going forward, policy must prioritise productive, technology-intensive, and manufacturing-oriented FDI that strengthens industrial growth and external sector sustainability.
Value Addition
Net FDI vs Gross FDI
Indicator
Meaning
Gross FDI
Total foreign investment entering the economy
Net FDI
Gross inflows minus disinvestment and related outflows
Effective FDI
Fresh capital inflows after excluding accounting and restructuring transactions
Volatile Capital Flows: Increases external vulnerability.
Short-Term Orientation: Prioritises capital gains over industrial expansion.
PYQ Relevance
[UPSC 2016] Justify the need for FDI for the development of the Indian economy. Why is there a gap between MOUs signed and actual FDIs? Suggest remedial steps to increase actual FDIs in India.
Linkage: The question examines not merely the volume of FDI but its effectiveness, actual realization, and developmental contribution to the economy. The article highlights why the quality and developmental impact of FDI matter more than headline inflow numbers.
The two-day SAPLING (South Asian Policy Leadership for Improved Nutrition and Growth) Dialogue 2026 concluded on 10 June 2026 in Ahmedabad, Gujarat, with a call for a concrete action plan for the holistic development of the food processing sector in South Asia.
About SAPLING Dialogue 2026
Jointly organised by: Ministry of Food Processing Industries (MoFPI), Government of India and World Bank Group
Venue: Ahmedabad, Gujarat
Duration: 9-10 June 2026
Participants: Around 200 delegates.
Participants Included
Policymakers, Industry leaders, International organisations, Development partners, Researchers, Startups, Financial institutions, and Representatives from South Asian countries
Theme
“Unlocking Value: Advancing Food Processing for Employment Generation and Sustainable Growth in South Asia”
Key Objectives
Strengthen resilient, inclusive and sustainable food systems in South Asia.
Promote regional cooperation in food processing.
Encourage value addition in agriculture.
Facilitate technology adoption in the sector.
Generate employment opportunities.
Enhance farmer incomes and rural development.
Support MSMEs and women entrepreneurs.
[2023] Consider the following statements with reference to India: 1. According to the Micro, Small and Medium Enterprises Development (MSMED) Act, 2006, the ‘medium enterprises’ are those with and machinery between is crore and 25 crore. 2. All bank loans to the Micro, Small and Medium Enterprises qualify under the priority sector. Which of the statements given above is/are correct?