An e-commerce revenue model where the seller has control over pricing but doesn’t keep products in stock and instead transfers customer orders and shipment details to a third-party supplier, who then ships the goods directly to the customer, is called:
Subject: Economics
-
Which one of the following correctly represents the three key sub-indices of the Financial Inclusion Index (FI-Index) of the RBI
Which one of the following correctly represents the three key sub-indices of the Financial Inclusion Index (FI-Index) of the RBI?
-
Which one of the following pairs of semiconductor plants in India and their locations is NOT correctly matched
Which one of the following pairs of semiconductor plants in India and their locations is NOT correctly matched?
-
Consider the following statements with reference to the Sagarmala Programme of the Government of India
Consider the following statements with reference to the Sagarmala Programme of the Government of India:
I. The Sagarmala Programme seeks to achieve port-led economic growth through cost-effective and sustainable coastal infrastructure.
II. The success of the Sagarmala Programme is reflected in significant growth in coastal and inland waterway shipping, along with improved global port rankings.
III. Sagarmala 2.0 aims to position India as a global maritime innovation hub aligned with Atmanirbhar Bharat and Viksit Bharat 2047 visions.Which of the following relationships among the above statements is/are correct?
1.Statement II validates the effectiveness of the strategies envisioned in Statement I.
2.Statement III extends the objectives of Statement I by embedding them into a future-oriented innovation framework.
3.Statement I contradicts Statement III by focusing only on traditional infrastructure instead of modern innovation.Select the answer using the code given below:
-
In what way(s) does the Vizhinjam International Seaport represent a structural shift in India’s maritime trade and logistics policy
In what way(s) does the Vizhinjam International Seaport represent a structural shift in India’s maritime trade and logistics policy?
1. By functioning exclusively as a domestic cargo hub to reduce reliance on coastal shipping and eliminate the need for foreign collaborations.
2. By focusing primarily on passenger cruise tourism and heritage shipping to increase Kerala’s profile as a maritime heritage destination.
3. By leveraging its natural deep draft and strategic location to reduce dependence on foreign trans-shipment ports, enhance revenue retention, and reposition India in regional maritime trade.
Select the answer using the code given below: -
Why inflation rate is not the same as affordability
Why in the News?
India’s inflation has remained mostly under the RBI’s target range of 2-6%, showing success in controlling price rise. However, many people still feel daily expenses are high because prices have increased over the years faster than incomes for many families. This has raised an important question: Does low inflation really mean things are affordable?
Why is inflation different from affordability?
- Different Meaning: Inflation measures the rise in prices, while affordability measures whether people can still buy goods and services comfortably.
- Different Basis: Inflation focuses on price increase, whereas affordability depends on income growth relative to prices.
- Lower Inflation ≠ Lower Prices: A fall in inflation means prices are rising slowly, not that prices have reduced.
- Cumulative Effect: Affordability depends on the total increase in prices over time, not only yearly inflation.
- Real Purchasing Power: Even with low inflation, affordability declines if wages and incomes do not rise adequately.
How has RBI succeeded in controlling inflation but not affordability concerns?
- Inflation Targeting Framework: RBI adopted formal inflation targeting in 2016, aiming to maintain retail inflation at 4% ±2%.
- Policy Success: Retail inflation remained largely within the 2-6% comfort band, except during exceptional shocks.
- Monetary Tightening: RBI increased repo rates to curb inflationary pressures arising from excess demand.
- Structural Limitation: Monetary policy controls the rate of price increase, not already elevated prices.
- Persistent Cost Burden: Even with lower inflation, consumers continue paying higher prices accumulated over previous years.
Data Highlight:
- General price level increased by around 75% between April 2014 and March 2026.
- Prices rose by 41% between March 2019 and March 2026.
How have rising prices affected different categories of workers?
- Salaried Workers: Experienced relatively better affordability as income growth outpaced inflation in several periods.
- Self-Employed Workers: Faced weaker affordability due to slower and irregular income growth.
- Casual Labourers: Remained most vulnerable because of lower absolute earnings despite wage increases.
- PLFS Classification: Periodic Labour Force Survey (PLFS) divides workers into:
- Salaried workers
- Self-employed workers
- Casual labourers
- Data (2017-18 to 2023-24):
- Casual Labour Income: Increased by 43%, yet average monthly earnings remained only around ₹13,590.
- Self-Employed Income: Reached around ₹14,861/month.
- Salaried Workers: Earned around ₹22,690/month, showing relatively higher resilience.
Why does cumulative inflation matter more than annual inflation?
- Limited Picture of Annual Inflation: Shows price increase only compared to the previous year and may hide long-term cost burden.
- Rising Cost of Living: Cumulative inflation reflects the total increase in prices over several years, giving a clearer picture of household expenses.
- Real Affordability: Affordability depends on whether incomes grow faster than total price rise, not yearly inflation alone.
- Consumer Experience: Households feel the effect of accumulated increase in food, rent, transport, health, and education costs.
- Example from Article: If the price index was 100 in 2014 and rose to 175 by 2026, even moderate yearly inflation still results in much higher everyday costs.
Why is affordability becoming a major policy concern?
- Consumption Slowdown: Weak purchasing power suppresses domestic demand.
- Growth Challenge: Lower household spending affects sectors dependent on mass consumption.
- Income Inequality: Divergence in wage growth widens economic disparities.
- Employment Quality Issue: Income growth depends on availability of stable and productive jobs.
- Policy Dilemma: Excessive inflation control through higher interest rates may further suppress investment and employment.
Can RBI alone solve the affordability challenge?
- Monetary Policy Constraint: RBI can contain inflation but cannot directly raise incomes.
- Fiscal Policy Role: Government intervention through wage support, social protection, and targeted subsidies improves affordability.
- Employment Generation: Productive employment raises real wages sustainably.
- Supply-Side Reforms: Better logistics, food supply chains, and productivity reduce cost pressures.
- Welfare Measures: Public provisioning in health, education, and food reduces household expenditure burden.
Conclusion
Inflation management and affordability are not synonymous. While India has achieved relative success in maintaining inflation within RBI’s target range, household well-being ultimately depends on real purchasing power rather than inflation statistics alone. Sustainable affordability requires a combination of price stability, faster income growth, productive employment generation, and reduced cost burden on essential services.
PYQ Relevance
[UPSC 2024] What are the causes of persistent high food inflation in India? Comment on the effectiveness of the monetary policy of the RBI to control this type of inflation.
Linkage: The PYQ tests understanding of inflation, RBI’s monetary policy, and limits of inflation control in improving economic outcomes. The article extends this debate by arguing that controlling inflation alone does not ensure affordability, as real income growth determines purchasing power.
-
RBI data shows why government is concerned about dollars flowing outs
Why in the News?
RBI’s Annual Report 2025-26 showed that India’s Balance of Payments (BoP) deficit widened sharply to $30.8 billion in 2025-26, compared to $5 billion in 2024-25. This marks a major reversal from the $63.7 billion surplus in 2023-24. This highlights rising pressure on India’s external sector due to weaker foreign investments and high dollar outflows for imports such as oil and gold.
What is Balance of Payments (BoP)?
The Balance of Payments (BoP) is a systematic record of all economic transactions between a country and the rest of the world during a specific period (usually a year). It tracks the flow of foreign currency (mainly dollars) into and out of the country. In simple terms, BoP shows whether a country is earning more dollars than it spends or spending more than it earns.
What are the components of BoP?
- Current Account (Trade and Income Flows): It records transactions related to:
- Goods Trade: Exports and imports of merchandise (e.g., crude oil, machinery).
- Services Trade: IT services, tourism, consulting, shipping.
- Remittances: Money sent by Indians working abroad.
- Investment Income: Interest, dividends, profits.
- Example: India imports crude oil and exports IT services.
- Capital Account: Investments and Capital Flows: It records:
- Foreign Direct Investment (FDI): Long-term investments in industries.
- Foreign Portfolio Investment (FPI): Investment in stocks and bonds.
- External Borrowings: Loans from abroad.
- Banking Capital and Other Transfers
- Example: A foreign company investing in India or FIIs buying Indian shares.
How is BoP interpreted?
- BoP Surplus: Dollar inflows exceed outflows, strengthens forex reserves.
- BoP Deficit: Dollar outflows exceed inflows, RBI may use foreign exchange reserves to bridge the gap.
- In 2025-26, India recorded a BoP deficit of $30.8 billion, meaning the country spent more foreign currency than it received, raising concerns about external sector stability.
Why has India’s Balance of Payments deteriorated sharply in 2025-26?
- Balance of Payments Deficit: India recorded a BoP deficit of $30.8 billion in 2025-26, compared to $5 billion in 2024-25, showing a sharp deterioration in external sector stability.
- Sharp Reversal: India moved from a BoP surplus of $63.7 billion in 2023-24 to a large deficit in just two years, indicating weakening capital inflows.
- Foreign Exchange Pressure: RBI had to finance the deficit through foreign exchange reserves, leading to reserve depletion.
- Investment Slowdown: Net foreign investment inflows into India witnessed a sharp decline, worsening the external financing gap.
How do the current account and capital account shape India’s external position?
- Current Account: Captures trade in goods and services, remittances, and cross-border income flows.
- Capital Account: Includes foreign direct investment (FDI), foreign portfolio investment (FPI), external borrowings, and assistance.
- Persistent Current Account Deficit (CAD): India generally imports more than it exports, making CAD a structural feature of the economy.
- Trade Deficit: India’s merchandise trade deficit stood at $251.6 billion in 2025–26, improving from $286.9 billion in the previous year, but still remaining substantially large.
- Services Surplus (‘Invisible Trade’): India earned a services surplus of $221.4 billion in 2025-26, lower than $263.9 billion in 2024-25, reducing the cushion available against merchandise deficits.
Why did the capital account weaken despite India’s growth story?
- Capital Account Contraction: Capital account surplus declined sharply to $72 million in 2025-26, compared to $16.6 billion in 2024-25. This indicates weak external financing.
- Funds Held Abroad: Indians parked larger amounts abroad through delayed export receipts, advance import payments, and overseas holdings. This creates a deficit of $22.6 billion, compared to $7.4 billion previously.
- Geopolitical Impact: Trade disruptions linked to the West Asia crisis increased payment uncertainties and external pressures.
- Foreign Portfolio Investor (FPI) Outflows: FPIs withdrew $4.3 billion more than they invested in 2025-26, reversing the previous trend where inflows exceeded outflows.
Why is the government especially concerned about oil and gold imports?
- Oil Dependence: India imports nearly 90% of its crude oil requirement, making external balances highly vulnerable to global oil price shocks.
- Gold Demand: India produces negligible gold domestically despite large consumer demand, increasing pressure on dollar reserves.
- Dollar Outflow: A substantial portion of India’s foreign exchange outflow is used to pay for oil and gold imports.
- Policy Response: The government raised import duty on gold and silver from 6% to 15% and restricted imports of several silver categories to reduce external pressure.
- Consumption Advisory: Prime Minister Narendra Modi urged citizens to moderate fuel consumption and gold purchases, reflecting concern regarding dollar outflows.
What are the broader macroeconomic implications of a worsening BoP deficit?
- Forex Reserve Depletion: Persistent BoP deficits force RBI to utilise foreign exchange reserves, reducing external buffers.
- Currency Pressure: Sustained dollar outflows may weaken the Indian Rupee, increasing imported inflation.
- Inflationary Impact: Higher oil import costs raise transportation and manufacturing expenses.
- External Vulnerability: Reduced capital inflows increase dependence on volatile external borrowing.
- Investor Sentiment: Weak BoP signals may affect foreign investor confidence and macroeconomic stability perceptions.
Can India reduce structural vulnerability in its external sector?
- Export Diversification: Strengthens merchandise exports beyond traditional sectors.
- Manufacturing Expansion: Supports Make in India and production-linked incentives to reduce import dependence.
- Energy Transition: Accelerates renewable energy and domestic energy security to reduce oil import dependence.
- Financial Stability: Enhances resilience through stable FDI rather than volatile portfolio flows.
- Gold Monetisation: Encourages financialisation of savings through sovereign gold bonds and monetisation schemes.
Conclusion
RBI’s latest data highlights a growing imbalance in India’s external sector marked by widening dollar outflows, weakening foreign investments, and structural dependence on imported commodities. While India’s strong services exports continue to provide resilience, sustaining external stability will require export competitiveness, reduced import dependence, stable capital inflows, and prudent macroeconomic management.
PYQ Relevance
[UPSC 2019] How would the recent phenomena of protectionism and currency manipulations in world trade affect macroeconomic stability of India?
Linkage: India’s worsening Balance of Payments (BoP) and rising dollar outflows directly affect macroeconomic stability, exchange rate management, foreign exchange reserves, and external vulnerability. The issue links external trade dynamics with rupee stability and capital flows.
- Current Account (Trade and Income Flows): It records transactions related to:
-
Balance of Payments (BoP) Deficit & Dollar Outflow
Why in the news?
The Reserve Bank of India’s (RBI) Annual Report for 2025-26 revealed that India’s Balance of Payments (BoP) stood at a major deficit of $30.8 billion, marking an alarmingly sharp, six-fold increase over the previous year’s deficit.
Key Findings
- The Deficit Surge: The overall BoP went from a surplus of $63.7 billion in 2023-24 to a deficit of $5 billion in 2024-25, before cascading further to a $30.8 billion deficit in 2025-26 (provisional data up to Dec 31).
- Depletion of Forex: To plug this widening gap, the RBI had to draw directly from India’s foreign exchange reserves, causing a significant dent in national buffers.
Understanding the Double Whammy: Current vs. Capital Account
The sudden collapse of India’s BoP position is driven by structural slippages in both component accounts:
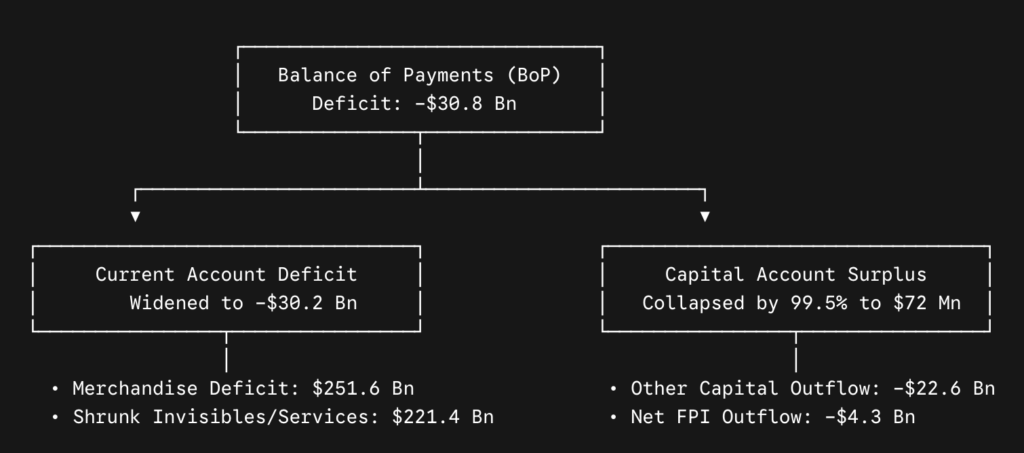
1. Widening Current Account Deficit (CAD)
- Status: Hit a three-year high of $30.2 billion in 2025-26.
- The Core Mechanism: While the physical trade deficit (merchandise) actually improved slightly—dropping to $251.6 billion from $286.9 billion—the surplus from India’s “invisibles” (software, services, and remittances) shrank much faster (falling from $263.9 billion to $221.4 billion).
- Result: The services sector could no longer cushion the trade deficit, causing CAD to expand.
2. Near-Total Collapse of the Capital Account Surplus
- Status: Shrank by an unprecedented 99.5%, collapsing down to a mere $72 million from $16.6 billion the year prior.
- Driven by “Other Capital”: Hit a record deficit of $22.6 billion. This reflects delayed export receipts, advance payments for imports amidst geopolitical friction, and domestic funds being parked abroad.
- Foreign Portfolio Investment (FPI) Flight: Reversing a two-year positive streak, FPIs turned into net sellers, pulling out $4.3 billion more from Indian markets than they put in.
[2014] With reference to Balance of Payments, which of the following constitutes/constitute the Current Account?
1.Balance of invisibles
2.Special Drawing Rights
3.Balance of trade
Select the correct answer using the codes given below;[A] 1 only
[B] .2 and 3 only
[C] .1 and 3 only
[D] 1, 2 and 3
-
Anti-Dumping Duties on Chemicals
Why in News?
Indian chemical industry associations and several ministries have sought a pause on anti-dumping investigations due to rising chemical prices and shortages caused by the West Asia conflict.
What are Anti-Dumping Duties?
- Anti-dumping duties are tariffs imposed on imported goods sold below fair market value to protect domestic industries from unfair competition.
Key Issues Raised
Rising Input Costs
- Anti-dumping duties increase prices of chemical intermediates.
- Impacts downstream sectors such as:
- Textiles
- Footwear
- Packaging
- Auto components
- Paints
Supply Chain Disruptions
- West Asia conflict has caused shortages and price volatility in petrochemicals.
Government Response
- Duty Exemptions: Government of India exempted import duty on 40 petrochemical products till June 30.
Indigenous Manufacturing Push
The Department for Promotion of Industry and Internal Trade (DPIIT) asked industry to explore domestic production of over 200 highly import-dependent petrochemical items.
WTO Trade Policy Review Findings
- 51% of India’s anti-dumping measures relate to chemicals and allied industries.
- China is the main target of these investigations.
India’s Chemical Trade Scenario
- Chemical imports: about $75 billion
- Chemical exports: about $44 billion
- Trade deficit: around $31 billion
[2020] With reference to the international trade of India at present, which of the following statements is/are correct?
1.India’s merchandise exports are less than its merchandise imports.
2.India’s imports of iron and steel, chemicals, fertilisers and machinery have decreased in recent years.
3.India’s exports of services are more than its imports of services.
4.India suffers from an overall trade/current account deficit.
Select the correct answer using the code given below:
a) 1 and 2 only
b) 2 and 4 only
c) 3 only
d) 1, 3 and 4 only -
Why is the Indian Rupee falling
Why in the News?
The Indian rupee recently crossed ₹96 per U.S. dollar in May 2025, compared to nearly ₹85 a year earlier. This marked a sharp depreciation amid global geopolitical tensions, foreign portfolio outflows, and rising import dependence.
Why does the Indian rupee continue to depreciate despite India’s growing economy?
- Demand-Supply Dynamics: Currency prices depend on market demand relative to other currencies. A higher demand for dollars than rupees weakens the rupee.
- Import Dependence: India imports large quantities of crude oil, electronics, machinery, and industrial inputs, increasing demand for dollars.
- Trade Deficit: India’s imports consistently exceed exports, creating a merchandise trade deficit.
- Data Point: Merchandise trade deficit worsened from USD 244.9 billion (2023-24) to USD 286.9 billion (2024-25).
- Geopolitical Uncertainty: Global instability encourages investors to shift funds toward safer assets such as the U.S. dollar, strengthening it relative to emerging market currencies.
- Dollar Strength: Higher U.S. interest rates attract global capital into dollar-denominated assets.
How does India’s Balance of Payments (BoP) shape the rupee’s exchange rate?
India’s Balance of Payments (BoP) directly shapes the rupee’s exchange rate by determining the net demand and supply of foreign currency within the economy.
- Analyze Current Account ImpactThe Current Account reflects the net balance of trade in goods, services, and transfer payments
- Merchandise Trade Deficit: Increased from USD 244.9 billion (2023-24) to USD 286.9 billion (2024-25).
- Invisibles Surplus Buffers Rupee: Strong software services exports and remittances from workers abroad (especially West Asia) created a net invisible surplus rise from USD 218.8 billion to USD 263.9 billion. This creates massive inflows of foreign currency, supporting rupee stability.
- Net Deficit Weakens Rupee: Because the merchandise deficit outweighs the invisibles surplus, the overall current account remains in a deficit (CAD).
- Evaluate Capital Account Dynamics: The Capital Account tracks the flow of investment capital, loans, and banking capital across national borders.
- Financing the Gap: India relies on foreign capital inflows to bridge the CAD.
- FDI and Portfolio Inflows: Inflows from Foreign Direct Investment (FDI) and Foreign Portfolio Investment (FPI) demand Indian currency. Foreigners convert USD to INR to buy assets, which strengthens the rupee.
- External Borrowing Risks: Relying on short-term loans and external borrowings can cause sudden rupee volatility if global interest rates spike or investors pull funds out rapidly.
- Review Exchange Rate Outcomes: The final value of the rupee hinges on the net interaction between these two accounts.
BoP Condition Market Mechanism Impact on Indian Rupee Overall BoP Surplus Capital Inflows > Current Account Deficit Appreciates (Rupee strengthens) Overall BoP Deficit Capital Inflows < Current Account Deficit Depreciates (Rupee weakens) India’s BoP Snapshot (Figures in USD billion)
Component 2023-24 2024-25 Current Account -26.1 -23.1 Merchandise Trade -244.9 -286.9 Invisibles 218.8 263.9 Capital Account 89.4 116.6 FDI 54.2 4.52 Loans 6.5 29.3 Others 28.7 -17.2 Forex Reserves Change -63.7 +5 How do foreign capital outflows weaken the rupee?
Foreign capital outflows weaken the rupee through a direct market mechanism of asset liquidation and currency conversion.
- The Conversion Mechanism: When foreign portfolio investors (FPIs) decide to exit the Indian market, they liquidate their holdings in domestic stocks and bonds. This process unfolds in two distinct steps that put downward pressure on the currency:
- Asset Liquidation: Investors sell Indian equities and debt instruments, receiving payments in Indian Rupees (INR).
- Currency Conversion: To repatriate their capital, these investors must immediately sell their newly acquired rupees in the foreign exchange market to buy US Dollars (USD).
- Supply and Demand Imbalance: The mass exit of foreign capital disrupts the equilibrium of the foreign exchange market:
- Surplus of Rupee: The market experiences a sudden, heavy supply of rupees as exiting investors rush to dump the currency.
- Scarcity of Dollars: Simultaneously, the demand for US dollars spikes sharply.
- Depreciation: According to standard economic laws of supply and demand, an oversupply of a currency combined with intense demand for a foreign counterparty currency causes the domestic currency (the rupee) to lose value.
- FPI vs. FDI Stability: The nature of the capital leaving the country dictates the severity of the exchange rate impact:
- High Volatility (FPI): Foreign Portfolio Investment is highly liquid and seeking short-term financial returns. It can exit a country almost instantly, earning it the label “hot money.” This makes FPI the primary driver of sudden, sharp currency depreciation during global market panics.
- Resilient Cushion (FDI): Foreign Direct Investment (FDI) involves long-term, physical investments like building factories or buying corporate infrastructure. Because these assets cannot be quickly liquidated, FDI remains stable during crises and serves as a critical structural anchor for the rupee.
Why does a falling rupee become costly for India’s economy?
- Imported Inflation: Depreciation raises costs of imported goods.
- Oil Burden: India imports a substantial share of crude oil, making energy prices vulnerable to currency depreciation.
- Data Illustration: At ₹96 per dollar, purchasing USD 100 worth of oil requires ₹9,600, compared to ₹8,500 at ₹85 per dollar.
- Inflationary Transmission: Higher fuel costs increase logistics and transportation expenses across sectors.
- Manufacturing Constraints: Expensive imported raw materials raise production costs.
- Growth Trade-off: Depreciation may support exports but simultaneously increases import dependence.
Does a weaker rupee improve India’s exports automatically?
- Export Competitiveness: A cheaper rupee can make Indian goods more affordable globally.
- Structural Constraints: Export gains remain limited when manufacturing competitiveness is weak.
- Even if the rupee depreciates from ₹96 to ₹120, export gains may remain modest due to supply-side constraints.
- Import Dependence in Manufacturing: Many exporters rely on imported inputs, reducing net gains from depreciation.
What role does the Reserve Bank of India (RBI) play in defending the rupee?
- Forex Intervention: RBI sells dollars from reserves to reduce excessive rupee depreciation.
- Market Stabilisation: Dollar sales increase dollar supply in forex markets and support rupee demand.
- Forex Reserve Strength: India’s reserves stood at approximately USD 691 billion by March 2026, sufficient for around 10.8 months of imports.
- Intervention Evidence: RBI actively intervened during October 2024-January 2025 and August-December 2025.
- Limitation: RBI can moderate volatility but cannot permanently reverse depreciation caused by structural deficits.
Why is oil dependency central to rupee vulnerability?
- Crude Oil Imports: India imports nearly 85% of its crude oil requirement, increasing dollar demand.
- External Vulnerability: Oil price shocks worsen trade deficits and strain forex reserves.
- Geopolitical Linkage: Conflicts in energy-producing regions raise crude prices, amplifying pressure on the rupee.
- Policy Imperative: Reducing oil dependence through renewables, EVs, ethanol blending, and domestic energy diversification strengthens currency stability.
Conclusion
The rupee’s depreciation reflects deeper structural realities of India’s external sector rather than merely short-term market fluctuations. Persistent trade deficits, dependence on imported oil, volatile portfolio flows, and geopolitical disruptions continue to pressure the currency. While RBI intervention and strong forex reserves provide temporary insulation, durable currency stability ultimately depends on strengthening exports, reducing import dependence, and improving external sector resilience.
PYQ Relevance
[UPSC 2018] How would the recent phenomena of protectionism and currency manipulations in world trade affect macroeconomic stability of India?
Linkage: The PYQ tests understanding of exchange rate volatility, external sector vulnerabilities, capital flows, and macroeconomic stability. The article explains how rupee depreciation, trade deficits, foreign capital outflows, geopolitical tensions, and dollar strengthening affect India’s macroeconomic stability and Balance of Payments.