Finance Minister Nirmala Sitharaman highlighted concerns regarding “3Fs” Fuel, Fertiliser and Foreign Exchange amid the economic impact of the ongoing West Asia crisis.
Key Economic Concerns
Rupee Depreciation
Rupee weakened sharply against the U.S. dollar after the war began.
RBI reportedly intervened heavily in forex markets.
Foreign Portfolio Investment (FPI) Outflows
Foreign investors sold: Indian stocks and bonds leading to:
Capital outflows
Pressure on forex reserves
Forex Reserves Decline
India’s forex reserves reportedly fell significantly compared to pre-war levels.
Government Measures Taken
Higher import duty on:
Gold
Silver
Platinum
Restrictions on duty-free gold imports
Fuel price hikes
Appeals to reduce non-essential imports and foreign travel
[2022] With reference to the Indian economy, consider the following statements: 1. If the inflation is too high, Reserve Bank of India (RBI) is likely to buy government securities. 2. If the rupee is rapidly depreciating, RBI is likely to sell dollars in the market. 3. If interest rates in the USA or European Union were to fall, that is likely to induce RBI to buy dollars
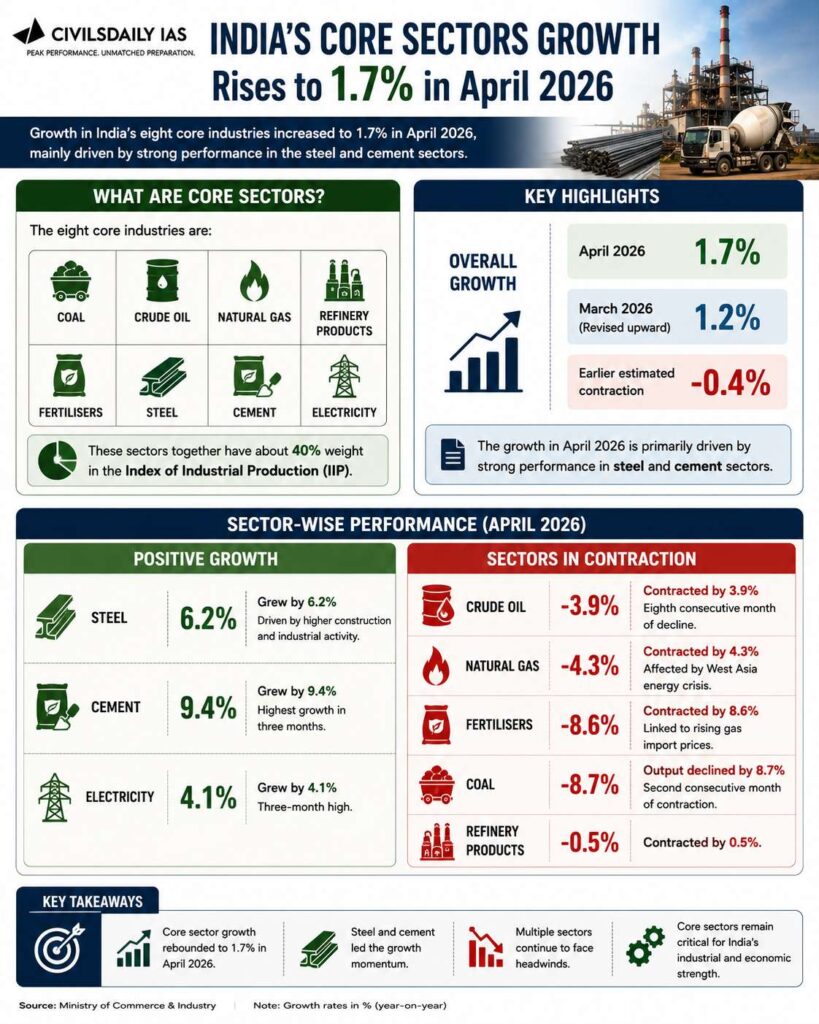
The Ministry of Statistics and Programme Implementation (MoSPI) released the report of the Technical Advisory Committee (TAC) on revising the base year of the All-India Index of Industrial Production (IIP) from 2011-12 to 2022-23.
About IIP
The Index of Industrial Production (IIP) measures: Growth in industrial activity in India.
Published By: National Statistical Office (NSO) Under MoSPI
Technical Advisory Committee (TAC-IIP)
Chairman: Mridul K. Saggar
Constituted: September 2024
Purpose
Guide the revision of IIP base year.
Improve methodology, coverage, and accuracy.
Major Changes in New IIP Series (2022-23)
Expanded Coverage: New sectors included:
Minor minerals
Rare earth minerals
Gas supply
Water supply
Sewerage and waste management
Revised Item Basket
Total products: 1,042
Mapped into: 463 item groups
Based on: National Industrial Classification (NIC)-2025
National Industrial Classification (NIC)-2025
National Industrial Classification (NIC) is India’s official system for classifying economic and industrial activities.
It helps in:
Collection of statistical data
Industrial surveys
National accounts compilation
Economic analysis and policy formulation
Released by the Ministry of Statistics and Programme Implementation (MoSPI) through the National Statistical Office (NSO).
[2012] In India the overall Index of Industrial Production, the Indices of Eighth Core Industries have combined weight of 37.90%. Which of the following are among those Eight Core Industries? 1. Cement 2. Fertilizers 3. Natural Gas 4. Refinery products 5. Textiles Select the correct answer using the codes given below:
Government bond yields across major economies have risen sharply, reaching some of the highest levels since the 2008 Global Financial Crisis. India’s 10-year government bond yield increased from 6.58% (Dec 2025) to 7.08% (May 2026), while major economies such as the United States and the United Kingdom also witnessed rising yields.
Why Do Governments Borrow Money?
Revenue Gap: Governments frequently face expenditure commitments exceeding tax and non-tax revenues, requiring borrowing to bridge fiscal deficits.
Developmental Spending: Developing countries often require greater public expenditure on infrastructure, welfare, health, and education.
Weak Tax Base: Lower-middle-income countries face constraints in revenue mobilization due to a smaller formal tax-paying population.
Counter-Cyclical Fiscal Policy: Governments borrow during economic slowdowns to sustain growth through public expenditure.
Debt Refinancing: Existing debt obligations often require fresh borrowing for repayment and rollover.
Example: Advanced economies with slow growth increasingly depend on debt-financed expenditure.
What Are Bonds?
Debt Instrument: A bond is a financial instrument through which governments or companies borrow money from investors for a fixed period.
Loan Mechanism: Investors lend money to the issuer, who promises periodic interest payments and repayment of principal at maturity.
Fixed Return Structure: Most bonds carry a fixed coupon rate, ensuring regular interest income.
How Do Governments Borrow Through Bonds?
Government Securities (G-Secs): Governments issue bonds to investors for a specified period in return for annual interest payments.
Fixed Coupon Payments: A bond issued at ₹100 with a 5% coupon pays ₹5annually until maturity.
Principal Repayment: Governments return the original invested amount at maturity.
Sovereign Guarantee: Government bonds are considered relatively safer because sovereign default risks remain comparatively low.
Benchmark Role: Government bond yields influence borrowing rates for homes, factories, businesses, and infrastructure financing.
Example: India issues government securities (G-Secs), while the United States issues Treasury bonds.
Why Are Government Bond Yields Rising Globally?
Bond yield is simply the return (profit/interest) an investor earns from lending money to the government through bonds. Bond yields rise and fall because bond prices change in the market.
Inflationary Pressures: Rising inflation reduces the real return on investments, compelling investors to demand higher yields.
Increased Borrowing Requirements: Governments facing wars, welfare commitments, or fiscal stress require greater borrowing, increasing bond supply.
Higher Risk Perception: Investors demand greater compensation where macroeconomic uncertainty or fiscal deficits rise.
Monetary Tightening: Central banks maintain higher policy rates to control inflation, indirectly pushing bond yields upward.
Debt Sustainability Concerns: High public debt increases investor caution regarding fiscal management.
Example: A hypothetical war-induced rise in government spending increases borrowing demand, leading lenders to seek higher returns.
How Do Rising Bond Yields Affect Existing Bond Prices?
Inverse Relationship: Bond prices move inversely to yields.
Price Correction: A bond paying a fixed annual return becomes less attractive when newer bonds offer higher returns.
Capital Loss Risk: Existing bondholders may incur losses if they sell older low-yield bonds before maturity.
Illustration: A bond bought at $100 with 5% annual returns becomes unattractive when new bonds offer 10% returns, forcing its market value downward, potentially toward $50.
Why Are Rising Bond Yields Bad News for Governments?
Fiscal Stress: Governments spend a larger share of budgets on interest payments.
Crowding Out: Higher sovereign borrowing costs reduce fiscal space for productive expenditure.
Welfare Compression: Governments may reduce social welfare spending to accommodate debt servicing.
Tax Burden: States may increase taxes to meet rising debt obligations.
Refinancing Risk: Countries refinancing trillions of dollars face increased fiscal pressure.
Example: High debt servicing can reduce expenditure on welfare schemes and defence modernization.
How Do Rising Bond Yields Affect Businesses and Citizens?
Higher Loan Costs: Banks and lenders raise interest rates for businesses and households.
Why Is the Current Global Yield Trend Significant?
Post-2008 Highs: Borrowing costs have reached levels not witnessed since the Global Financial Crisis.
Global Synchronisation: Yield increases are visible across both developed and emerging economies.
Debt Vulnerability: High public debt accumulated after COVID-19 increases refinancing risks.
Policy Dilemma: Governments face trade-offs between inflation control and economic growth support.
Conclusion
Rising government bond yields signify tightening financial conditions and growing fiscal pressures across economies. Since sovereign yields act as the benchmark for economy-wide borrowing costs, persistent increases can constrain welfare spending, private investment, and growth prospects. Fiscal prudence, inflation management, and sustainable debt strategies remain essential to mitigate the long-term risks of expensive borrowing.
PYQ Relevance
[UPSC 2019] The public expenditure management is a challenge to the Government of India in context of budget making during the post liberalization period. Clarify it.
Linkage: The PYQ focuses on public expenditure management and fiscal pressures in budget-making after liberalisation. Rising bond yields increase government borrowing costs and interest burden. This reduces fiscal space for welfare, infrastructure, and development spending.
The Indian rupee has witnessed sustained losses and approached nearly ₹97 against the U.S. dollar. This has revived debate over whether the Reserve Bank of India (RBI) should allow market-driven depreciation or actively intervene. The issue has become significant because depreciation coincides with rising global inflationary pressures and volatile foreign capital flows, increasing risks of imported inflation in essential goods.
Why Has the Rupee’s Depreciation Become a Major Macroeconomic Concern?
Sustained Depreciation: The rupee has experienced continuous losses and moved close to ₹97 per U.S. dollar, indicating prolonged pressure rather than temporary volatility.
Imported Inflation: A weaker rupee increases costs of imported goods, especially fuel, edible oil, fertilizers, electronics, and industrial inputs, intensifying domestic inflation.
Global Commodity Exposure: Rising energy and commodity prices amplify economic stress because India remains significantly dependent on imports.
Household Impact: Higher import costs translate into increased prices of essential goods, disproportionately affecting lower and middle-income households.
Macroeconomic Vulnerability: Persistent depreciation raises concerns regarding inflation management, current account deficits, and external debt servicing.
Why Is the Distinction Between a Weak Rupee and a Falling Rupee Important?
India currently faces a falling rupee, not necessarily a weak rupee, because the decline is linked more to external capital movements than worsening domestic fundamentals.
Weak Rupee: Reflects deeper structural issues such as lower export competitiveness, persistent inflation, weak productivity, or prolonged external imbalances. It indicates pressure arising from domestic economic fundamentals.
Falling Rupee: Refers to a short-term depreciation in currency value, often driven by external factors such as global uncertainty, rising U.S. interest rates, or foreign investor withdrawals.
Current Context: India’s rupee decline reflects temporary market pressures and capital outflows more than deterioration in macroeconomic fundamentals such as growth or reserves.
Policy Implication: Structural weakness requires long-term reforms in exports, manufacturing, and productivity, whereas temporary depreciation may require measured RBI intervention to reduce volatility.
Example: During the 2013 Taper Tantrum, sudden foreign capital exits sharply weakened the rupee despite no immediate collapse in domestic fundamentals.
Can Currency Depreciation Automatically Correct India’s Current Account Deficit?
A Current Account Deficit (CAD) occurs when a country’s total outflows for imported goods, services, income, and transfers exceed its total inflows from exports. It means a nation is spending more foreign currency abroad than it is earning, relying on foreign borrowing or investment to cover the gap.
Current Account Adjustment: Currency depreciation theoretically improves trade balance by making exports cheaper and imports costlier.
Export Competitiveness: A weaker rupee can support sectors such as IT services, pharmaceuticals, textiles, engineering goods, and merchandise exports.
Import Compression: Higher import prices may reduce demand for non-essential imported goods.
Structural Limitation: India imports essential commodities such as crude oil, where demand remains relatively inelastic; import reduction therefore remains limited.
Delayed Impact: Trade balance improvements often emerge after a time lag due to the J-Curve Effect, where trade deficits may initially worsen before improving.
Capital Flow Dependence: Current account correction requires adequate foreign capital inflows; persistent capital exits weaken adjustment capacity.
Why May Market-Driven Depreciation Fail to Deliver Expected Benefits?
Speculative Capital Outflows: The article highlights that much of the rupee’s decline is driven by withdrawals by Foreign Institutional Investors (FIIs) rather than trade fundamentals.
Interest Rate Expectations: Anticipation of rising global interest rates makes Indian assets relatively less attractive, encouraging capital flight.
Uncertain Export Gains: Export growth may remain weak if global demand slows or domestic production constraints persist.
Imported Inflation Pressure: Rising costs of imported inputs increase production expenses, reducing gains from export competitiveness.
Negative Market Sentiment: Continued depreciation may create expectations of further decline, reinforcing speculative selling.
How Can Unchecked Rupee Depreciation Intensify Inflationary Risks?
Essential Commodity Inflation: Depreciation increases prices of imported essentials, especially fuel and edible oils, feeding broad-based inflation.
Inflation Expectations: Businesses and consumers may expect future price increases, encouraging advance purchases and demand-side inflation.
Cost-Push Inflation: Higher import costs raise production expenses across industries.
Monetary Policy Constraints: Persistent inflation may compel tighter monetary policy and higher interest rates.
Growth-Inflation Trade-off: Higher rates can slow investments and economic growth while attempting to contain inflation.
What Role Do Foreign Capital Flows Play in Exchange Rate Movements?
Portfolio Capital Dependence: India’s external sector remains dependent on foreign portfolio investment for financing deficits.
FII Outflows: Speculative withdrawal of foreign institutional capital weakens demand for rupees.
Interest Rate Differential: Higher interest rates in advanced economies, especially the U.S. The Federal Reserve tightening cycle often pulls capital away from emerging economies.
Sentiment-Driven Volatility: Exchange rates often reflect investor expectations rather than actual consumption demand.
External Vulnerability: Excessive dependence on volatile capital flows increases susceptibility to sudden exchange rate shocks.
Should the RBI Intervene or Allow Market Forces to Determine Rupee Value?
Global Precedent: Even advanced economies intervene during excessive volatility. Japan signaled decisive intervention to support the yen during sharp depreciation pressures.
How Should India Balance Market Forces and Currency Stability?
Calibrated Intervention: RBI may allow gradual market adjustment while preventing disorderly volatility.
Export Diversification: Expanding high-value manufacturing and services exports strengthens resilience.
Energy Security: Reduced oil dependence lowers vulnerability to imported inflation.
Macroeconomic Coordination: Monetary, fiscal, and trade policies require alignment to stabilize external accounts.
Conclusion
Rupee depreciation can help exports and correct trade imbalances, but unchecked decline may increase imported inflation and economic instability. India needs a balanced approach where the RBI allows gradual market adjustment while preventing excessive volatility to protect growth and price stability.
PYQ Relevance
[UPSC 2018] How would the recent phenomena of protectionism and currency manipulations in world trade affect macroeconomic stability of India?
Linkage: This PYQ directly links with the article’s core debate on rupee depreciation, currency valuation, and macroeconomic stability. It tests understanding of how exchange-rate movements, capital flows, inflation, trade balance, and external vulnerabilities affect India’s economy.
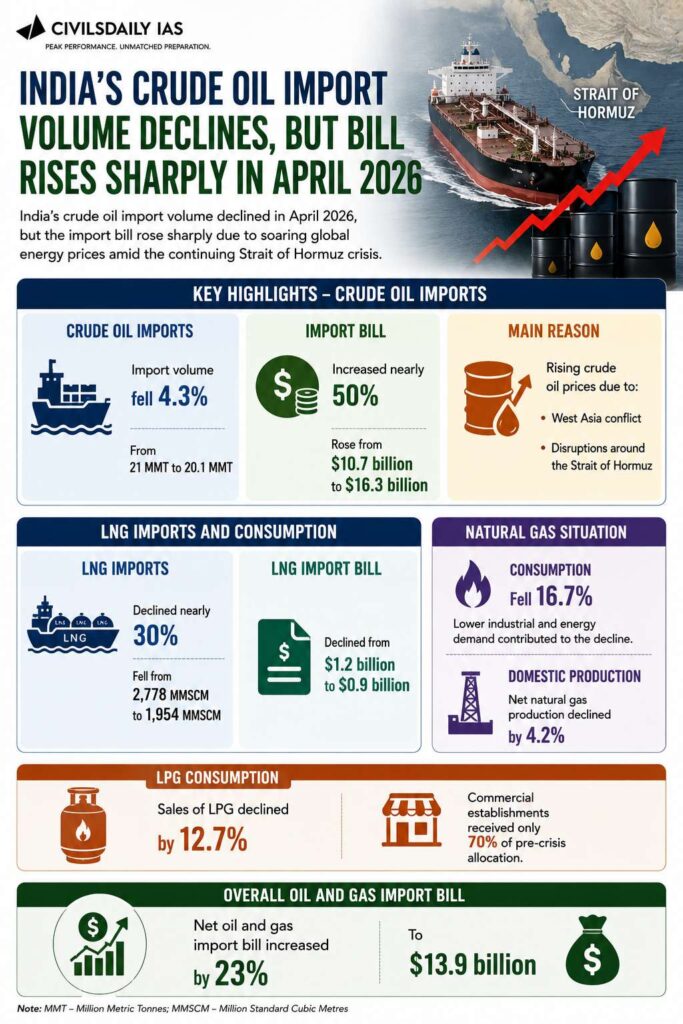
India’s crude oil import volume declined in April 2026, but the import bill rose sharply due to soaring global energy prices amid the continuing Strait of Hormuz crisis.
Key Highlights
Crude Oil Imports
Import volume:
Fell 4.3%
From 21 MMT to 20.1 MMT
Import Bill
Increased nearly 50%
Rose from:
$10.7 billion to $16.3 billion
Main Reason
Rising crude oil prices due to:
West Asia conflict
Disruptions around the Strait of Hormuz
LNG Imports and Consumption
LNG Imports
Declined nearly 30%
Fell from: 2,778 MMSCM to 1,954 MMSCM
LNG Import Bill
Declined from $1.2 billion to $0.9 billion
Natural Gas Situation
Consumption
Fell 16.7%
Lower industrial and energy demand contributed to the decline.
Domestic Production
Net natural gas production declined:
By 4.2%
LPG Consumption
Sales of LPG declined:
By 12.7%
Commercial establishments received only 70% of pre-crisis allocation.
Overall Oil and Gas Import Bill
Net oil and gas import bill increased:
By 23%
To $13.9 billion
About PPAC
Petroleum Planning and Analysis Cell
Attached office of the Ministry of Petroleum and Natural Gas.
Provides data and analysis on India’s petroleum sector.
[2020] The term ‘West Texas Intermediate’, sometimes found in the news, refers to a grade of:
India’s long-term energy security debate has renewed focus on thorium-based nuclear power as the country seeks reliable clean energy to meet its net-zero target by 2070. The issue gains significance because India possesses nearly 21% of global thorium reserves. At the same time, commissioning of the 500 MW Prototype Fast Breeder Reactor (PFBR) at Kalpakkam marks a major step toward operationalising the third stage of India’s nuclear programme.
How Does Thorium Fit into India’s Long-Term Energy Security Strategy?
Thorium Abundance: India possesses nearly 21% of global thorium reserves, largely concentrated in monazite sands of Kerala, Andhra Pradesh, Odisha, and Tamil Nadu.
Energy Security: Reduces dependence on imported uranium and fossil fuels, strengthening strategic autonomy in electricity generation.
Baseload Power: Supports continuous electricity generation unlike intermittent renewable sources such as solar and wind.
Climate Commitments: Facilitates low-carbon electricity generation essential for achieving India’s net-zero target by 2070.
Import Reduction: Limits exposure to volatile global uranium and hydrocarbon markets.
How Does India’s Three-Stage Nuclear Programme Function?
Stage-I (PHWRs): Uses natural uranium in Pressurised Heavy Water Reactors (PHWRs) to generate electricity and produce plutonium.
Stage-II (Fast Breeder Reactors): Uses plutonium in Fast Breeder Reactors (FBRs) to generate more fissile material than consumed.
Stage-III (Thorium Reactors): Converts thorium into Uranium-233 (U-233) for sustained long-term nuclear power generation.
Why Has India Traditionally Relied on a Three-Stage Nuclear Programme?
Limited Uranium Availability: India possesses low reserves of high-grade uranium, constraining large-scale expansion of conventional uranium-based reactors.
Abundant Thorium Reserves: India holds nearly 21% of global thorium reserves, necessitating a long-term strategy to utilise domestic resources.
Energy Security Imperative: Reduces dependence on imported uranium and strengthens strategic autonomy in electricity generation.
Long-Term Fuel Sustainability: Ensures continuity of nuclear fuel supply through breeder technology and fissile material regeneration.
Clean Baseload Requirement: Supports stable, low-carbon electricity generation essential for industrialisation and climate commitments.
Indigenous Nuclear Vision: Reflects Homi Bhabha’s three-stage strategy designed around India’s resource endowment.
Why Is the Prototype Fast Breeder Reactor (PFBR) a Critical Milestone?
A Prototype Fast Breeder Reactor (PFBR) is an advanced nuclear reactor that produces more fissile fuel than it consumes, making it a crucial technology for long-term nuclear energy security. In India’s case, the 500 MW PFBR at Kalpakkam, Tamil Nadu, developed by Bharatiya Nabhikiya Vidyut Nigam Limited, is the first reactor of Stage-II of India’s three-stage nuclear programme.
Technological Breakthrough: Represents India’s transition from experimental capability to near-commercial breeder reactor technology.
Fuel Multiplication: Produces more fissile material than it consumes, ensuring long-term nuclear fuel sustainability.
Thorium Enabler: Creates necessary fissile inventory for Stage-III thorium reactors.
Import Dependence Reduction: Strengthens indigenous nuclear capability and reduces vulnerability to external fuel markets.
Strategic Milestone: Marks a shift from conceptual planning toward practical thorium deployment.
Why is it called a “Fast Breeder Reactor”?
Fast: Uses fast neutrons (without slowing them using a moderator) to sustain nuclear fission.
Breeder: Produces more fissile material than it consumes. It converts non-fissile Uranium-238 into Plutonium-239, which can later be used as nuclear fuel.
How Does India’s PFBR Work?
Fuel Composition: Uses Mixed Oxide (MOX) fuel, comprising plutonium and uranium, to sustain nuclear fission and generate power.
Fast Neutron Technology: Operates using fast neutrons without a moderator, enabling efficient breeding of additional fissile material.
Sodium Cooling System: Uses liquid sodium coolant instead of water, facilitating high-temperature operation and efficient heat transfer.
Electricity Generation: Produces 500 MW of electricity, strengthening India’s clean baseload power capacity.
Fissile Fuel Multiplication: Converts non-fissile Uranium-238 into fissile Plutonium-239, thereby producing more fuel than it consumes.
Thorium Linkage: Generates the plutonium required as a “starter fuel” for Stage-III thorium reactors, since Thorium-232 itself is non-fissile and cannot directly undergo nuclear fission.
Thorium Conversion: Enables the conversion of Thorium-232 into fissile Uranium-233 (U-233), which can sustain nuclear reactions for long-term energy generation.
What Are the Major Technological Challenges in Thorium Utilisation?
Non-Fissile Nature: Thorium itself is not fissile and must first convert into Uranium-233 (U-233).
Fissile Material Requirement: Requires plutonium or enriched uranium to initiate reactions.
The “Ignition” Problem: Natural uranium contains a tiny fraction (0.7%) of Uranium-235, which is fissile (it splits easily and starts a chain reaction naturally). Thorium (232) is fertile, meaning it must sit inside an active reactor, absorb a neutron from a different fissile material (like Enriched Uranium or Plutonium-239), and slowly transform into Uranium-233.
The “Gamma Ray” Shielding Challenge
When Thorium converts to Uranium-233, it always produces a tiny impurity called Uranium-232.
Uranium-232 decays into daughter isotopes that emit incredibly intense, highly penetrating gamma radiation.
Because of this, used thorium fuel cannot be handled or manufactured manually behind standard protective glass. The entire fabrication and reprocessing pipeline must be completely automated using heavy robotics shielded behind massive walls of lead or concrete. This exponentially inflates infrastructure costs.
Delayed Commercialisation: Thorium reactor systems remain technologically complex and commercially underdeveloped.
Because uranium commercialization has a 70-year head start, the global nuclear supply chain is fully optimized for it.
Infrastructure Constraints: Requires specialised reactor systems and long gestation periods.
The commercial viability is further challenged by the fact that thorium requires a closed fuel cycle (reprocessing and reusing spent fuel) to make economic sense. An open, “once-through” cycle where you throw away the thorium after one use loses all its resource advantages.
Can Thorium Strengthen India’s Geopolitical and Strategic Position?
Net-Zero Transition: Supports India’s goal of achieving net-zero emissions by 2070 by providing reliable, low-carbon baseload electricity alongside renewables.
Energy Independence: Reduces external vulnerabilities arising from uranium imports.
Technology Leadership: Positions India among few countries pursuing advanced thorium fuel cycles.
Export Potential: Enables long-term prospects for indigenous reactor technology exports.
Strategic Autonomy: Strengthens sovereign energy choices amid global supply disruptions.
Climate Diplomacy: Supports India’s credibility in global clean-energy negotiations.
Why Does Nuclear Energy Remain Important Despite Renewable Expansion?
Intermittency Challenge: Solar and wind generation fluctuate based on weather conditions.
Reliable Baseload: Nuclear ensures uninterrupted electricity supply for industrial growth.
Grid Stability: Supports integration of renewable energy into national grids.
Large-Scale Decarbonisation: Reduces emissions without compromising industrial energy demand.
Land Efficiency: Requires comparatively less land than renewable alternatives for equivalent power generation.
Conclusion
Thorium offers India a unique opportunity to align energy security, clean growth, and technological self-reliance through its abundant domestic reserves. However, translating this strategic advantage into energy leadership depends on the successful operationalisation of the three-stage nuclear programme, particularly the scaling of Fast Breeder Reactors and thorium-based technologies. As India pursues net-zero emissions by 2070, thorium can emerge as a critical pillar of reliable, indigenous, and low-carbon energy transition.
PYQ Relevance
[UPSC 2018] With growing energy needs should India keep on expanding its nuclear energy programme? Discuss the facts and fears associated with nuclear energy.
Linkage: The PYQ tests understanding of India’s energy security, nuclear expansion, clean energy transition, and associated technological concerns. The article examines how thorium-based nuclear energy and PFBR can support India’s long-term energy needs.
India’s gold loan market has emerged as the fastest-growing retail lending segment. It recorded a sharp 50.4% year-on-year growth, with five southern states, and Tamil Nadu, Andhra Pradesh, Karnataka, Telangana, and Kerala, accounted for nearly 75% of India’s outstanding gold loans. The trend is significant because it reveals a stark regional contrast in credit behaviour, with even populous states like Uttar Pradesh (₹42,300 crore) lagging far behind Tamil Nadu (₹5.96 lakh crore) in gold loan penetration.
Why Has Southern India Emerged as the Epicentre of Gold Loans?
Agricultural Credit Linkages: High prevalence of agri-gold loans supports southern dominance, as banks use gold-backed lending to meet Priority Sector Lending (PSL) targets for agriculture.
High Household Gold Ownership: Southern households traditionally hold larger quantities of gold jewellery, creating a stronger collateral base for borrowing.
Cultural Acceptance of Gold Monetisation: Gold is widely treated as a financial asset rather than only ornamentation. This makes pledging jewellery socially acceptable during emergencies or for business needs.
Dense Institutional Ecosystem: Strong presence of specialised gold loan NBFCs and bank branches ensures faster disbursal, easier access, and lower transaction costs.
Example: Finance Giants like Muthoot Finance and Manappuram Finance both originated in Kerala.
Greater Formal Credit Adoption: Borrowers in southern states show higher familiarity with organised gold-backed lending compared to informal borrowing channels.
Higher Gold Prices and Loan Ticket Expansion: Rising gold valuations increased collateral worth, enabling borrowers to access larger loans and accelerating market growth.
What Does the Data Reveal About Southern Dominance?
Regional Concentration: Tamil Nadu, Andhra Pradesh, Karnataka, Telangana, and Kerala account for nearly 75% of India’s gold loan outstanding.
Outstanding Share: Out of ₹18.6 lakh crore, southern states account for ₹13.94 lakh crore (March 2026).
State-wise Distribution:
Tamil Nadu: ₹5.96 lakh crore
Andhra Pradesh: ₹3.08 lakh crore
Karnataka: ₹1.81 lakh crore
Telangana: ₹1.60 lakh crore
Kerala: ₹1.45 lakh crores
Why Is Uttar Pradesh’s Low Gold Loan Penetration Significant?
Population-Credit Disconnect: Despite being India’s most populous state and possessing substantial household gold holdings, Uttar Pradesh records only ₹42,300 crore in gold loan outstanding. This indicates weak formal credit uptake
Regional Financial Imbalance: Sharp contrast with southern states highlights uneven regional deepening of secured retail credit, despite similar household demand for liquidity.
Lower Formalisation of Household Finance: Greater dependence on informal borrowing channels may persist due to weaker penetration of organised gold-loan institutions.
Limited Banking and NBFC Ecosystem: Lower density of specialised gold-loan providers reduces accessibility and familiarity with gold-backed borrowing.
Credit Behaviour Differences: Unlike southern states where gold functions as a frequently monetised financial asset, northern households may treat gold more as a store of wealth/social asset than collateral.
What Does the Comparative Data Reveal?
Uttar Pradesh: ₹42,300 crore
West Bengal: ₹35,000 crore
Rajasthan: ₹41,700 crore
Gujarat: ₹57,100 crore
What Factors Are Driving the Rapid Expansion of Gold Loans?
Rising Gold Prices: Higher collateral value enables borrowers to access larger loan amounts.
Example: More Cash for the Same Gold: If a borrower pledged 50 grams of gold a few years ago, they might have qualified for a loan of ₹1.5 lakh. Today, that exact same jewelry can unlock ₹2.5 lakh or more.
Secured Borrowing Preference: Gold loans provide relatively easier access to credit than unsecured personal loans.
Gold loans require zero credit score checks (CIBIL scores are practically irrelevant), require no proof of income, and can be approved in under 15 minutes.
Digital/Online Gold Loans: The rise of Online Gold Loans (OGL) and fintech partnerships has helped in:
Locker-as-a-Service: Borrowers can store their gold in a bank’s secure vault once.
Instant Drawdowns: Whenever they need cash, they can use a mobile app to instantly draw down a loan against that stored gold directly into their bank account, 24/7. They only pay interest for the exact number of days they use the funds.
Increasing Credit Demand: Borrowers increasingly use gold loans to meet household expenses, consumption needs, and business requirements.
Agricultural Reclassification: Shift of agri-gold loans into retail classification has contributed to portfolio expansion.
Economic Uncertainty: Consumers increasingly prefer asset-backed borrowing during financial stress.
Collateral Strength: Larger loans in ₹2.5-5 lakh and ₹5 lakh+ categories witnessed improved collateral coverage.
What Are the Broader Economic and Financial Implications?
Financial Inclusion: Gold loans improve access to formal credit for households lacking traditional collateral.
Credit Formalisation: Reduces dependence on informal moneylenders charging exorbitant interest.
Consumption Stabilisation: Ensures liquidity during emergencies and supports household spending.
MSME Financing: Facilitates short-term working capital for small businesses and self-employed households.
Regional Imbalance: Concentration in southern India signals uneven access to financial products across regions.
Conclusion
Gold loans are increasingly emerging as an important pillar of India’s retail credit ecosystem. Ensuring wider regional penetration and balanced access to formal gold-backed finance will be essential for strengthening financial inclusion and reducing dependence on informal credit channels.
PYQ Relevance
[UPSC 2022] Is inclusive growth possible under market economy? State the significance of financial inclusion in achieving economic growth in India.
Linkage: The PYQ tests understanding of financial inclusion, regional disparities in access to institutional credit, and inclusive economic growth.The article highlights how gold loans improve access to formal credit. But it also exposes regional imbalances, with southern states far ahead of states like Uttar Pradesh in secured lending penetration.
PYQ Relevance[UPSC 2023] The adoption of electric vehicles is rapidly growing worldwide. How do electric vehicles contribute to reducing carbon emissions and what are the key benefits they offer compared to traditional combustion engine vehicles?Linkage: This PYQ tests the EV transition debate, while the article deepens it by examining whether India’s electricity grid can sustain mass EV adoption. UPSC can extend the question from EV benefits to grid readiness, energy security, charging infrastructure, and power-sector reforms.
Mentor’s Comment
India’s EV transition is gaining momentum due to rising crude oil prices and energy-security concerns. However, the bigger challenge is not just EV adoption but whether India’s electricity grid can handle future charging demand. Full electrification may require 900-1,100 TWh of extra electricity, almost like building a second power system.
Why Does India’s EV Transition Require a Fundamental Expansion of Electricity Infrastructure?
Fleet Electrification Burden: India has nearly 420 million registered vehicles. Full electrification across categories could require an additional 900-1,100 TWh of electricity annually, depending on usage intensity and vehicle type.
Partial Transition Impact: Even a 50% EV conversion by 2047 could increase electricity demand by nearly 500 TWh. This is equivalent to almost one-third of India’s present annual power generation.
Second Power System Effect: Electrifying transport effectively requires creating a parallel energy ecosystem comparable to building a new power system. This is unlike gradual infrastructure upgrades witnessed historically.
Freight Electrification Challenge: Heavy transport imposes disproportionate electricity demand due to high energy intensity. This makes freight, not scooters, the central grid concern.
Long-Term Infrastructure Lag: India’s existing electricity infrastructure took nearly seven decades to evolve, whereas EV-led demand growth may materialise within two decades.
Why Is the Political Visibility of Two-Wheeler Electrification Misleading?
Dominant EV Narrative: Public discourse largely associates EV transition with scooters and commuter vehicles due to their high visibility and government incentives.
Limited Grid Burden: India has around 309 million electric two-wheelers potential, yet complete conversion would add only 55-75 TWh annually, constituting less than 7% of projected EV electricity demand.
Consumption Characteristics: A two-wheeler typically travels 5,000-7,000 km annually, consuming approximately 0.035 kWh/km. This results in relatively low aggregate electricity demand.
Political Optics: Subsidies and adoption campaigns focus on visible commuter mobility while underemphasising grid-intensive sectors such as freight transport.
Structural Misdiagnosis: Overemphasis on scooters risks obscuring the actual infrastructure bottleneck, powering commercial logistics networks.
How Does Freight Electrification Create the Real Electricity Challenge?
Heavy Goods Vehicle (HGV) Demand: India has approximately 6.26 million HGVs, each consuming 1.2-1.5 kWh per kilometre over nearly 60,000 km annually.
Electricity Requirement: Electrifying HGVs alone could require nearly 450-565 TWh annually, exceeding several times the electricity consumed by the entire two-wheeler fleet.
Medium Goods Vehicles (MGVs): Nearly one million MGVs would also significantly increase electricity requirements despite lower intensity.
Passenger Car Comparison: A single heavy goods vehicle generates emissions equivalent to roughly 25 passenger vehicles, magnifying decarbonisation benefits but increasing grid stress.
Freight-Centric Transition: “Electrifying roads” effectively means electrifying India’s logistics ecosystem rather than only personal mobility.
Why Does EV Charging Create a Grid Stability Problem Beyond Annual Electricity Demand?
Peak Demand Challenge: Power systems respond not only to annual consumption but also to instantaneous electricity demand, especially during evening hours.
Simultaneous Charging Risk: If millions of EVs charge during evenings, electricity loads may rise by several hundred gigawatts, threatening supply stability.
Distribution Network Constraints: High-tension depot connections for commercial fleets already face delays, revealing infrastructural bottlenecks.
Financial Weakness of DISCOMs: Distribution companies remain burdened by accumulated losses, limiting their capacity to invest in required upgrades.
Price Volatility Risk: Unmanaged charging could trigger supply disruptions and tariff spikes, affecting all electricity consumers rather than only EV owners.
What Demand-Side Solutions Can Reduce EV-Induced Grid Stress?
Workplace Charging: Charging at offices shifts electricity demand away from residential peak periods.
Battery Storage Hubs: Dedicated storage systems enable smoother electricity balancing during demand surges.
Battery Swapping Networks: Fleet vehicles can replace depleted batteries instead of charging simultaneously.
EV Tariff Innovations: Several states have introduced EV-specific tariff frameworks, though no uniform national standard exists.
Smart Charging Capability: Chargers must respond dynamically to grid signals to optimise charging schedules.
Retrofitting Challenge: Conventional chargers installed today without smart capability may require expensive retrofitting later.
What Kind of Energy Mix Does India’s EV Grid Actually Need?
Solar and Wind Energy: Renewable power offers lowest marginal cost and rapid deployment, but intermittency limits reliability due to 25-30% capacity factors.
Storage Dependency: Renewable-heavy systems require battery storage or complementary generation to address non-solar hours.
Nuclear Energy: Provides high-capacity-factor, weather-independent baseload power, though constrained by high costs and long gestation.
Pumped Hydro: Ensures balancing capacity for variable renewable energy during demand fluctuations.
Natural Gas: Supports short-duration peak electricity demand during transition periods.
Diversified Energy Portfolio: Grid resilience requires a balanced mix rather than excessive reliance on a single source.
Coal Expansion Concern: EVs powered primarily through coal merely replace oil-import dependence with coal-import dependence, especially from Australia and Indonesia, while reducing climate gains.
Micro Modular Reactors (MMRs): May support highway corridors and urban logistics hubs by supplying localised baseload electricity.
Why Does Battery Waste Pose a Long-Term Sustainability Challenge?
End-of-Life Battery Surge: Hundreds of millions of EV batteries may eventually reach disposal stage.
Recycling Infrastructure Deficit: India lacks battery recycling systems at required commercial scale.
Waste Transition Risk: Failure to establish recycling systems could transform an energy transition into a waste-management crisis.
Circular Economy Need: Recovery of lithium, nickel, cobalt, and rare materials becomes essential for long-term supply security.
What Institutional and Policy Reforms Are Necessary for EV-Grid Readiness?
Demand Projection Planning: Draft National Electricity Policy must integrate EV demand scenarios of 30%, 50%, and 100% electrification by 2047.
Smart Charging Mandate: New charging infrastructure must include grid-responsive technology at equipment level.
Freight Corridor Mapping:Golden Quadrilateral and Dedicated Freight Corridors require electricity planning before electric trucks scale commercially.
Inter-Ministerial Coordination: Coordination between transport, power, finance, and distribution agencies ensures systemic preparedness.
DISCOM Strengthening: Reform of Revamped Distribution Sector Scheme (RDSS) should include EV-readiness benchmarks.
Last-Mile Delivery Electrification: Financial viability of EV logistics depends upon stronger distribution networks.
Conclusion
India’s EV transition cannot succeed through subsidies and vehicle sales alone. A sustainable shift to electric mobility requires grid readiness, smart charging systems, stronger DISCOMs, storage capacity, and freight-focused infrastructure planning. Without matching energy infrastructure, India risks replacing oil dependence with electricity stress rather than achieving true energy security and decarbonisation.
India’s rising energy import dependence and recurring global fuel disruptions have renewed policy focus on strengthening domestic energy security through indigenous energy sources. Simultaneously, the push for compressed biogas (CBG), waste-to-energy systems, and biomass utilisation under initiatives such as Sustainable Alternative Towards Affordable Transportation (SATAT) and the National Bioenergy Programme has brought decentralised bioenergy systems into the centre of India’s clean energy transition.
What are decentralised bioenergy systems?
They are localized energy-generation systems that convert biological waste (biomass and organic waste) into usable energy near the place where the waste is produced, instead of relying on large, centralized power plants. In simple terms, these systems turn local waste into local energy.
Key Features
Decentralised: Energy is produced at the village, town, farm, dairy cluster, factory, or municipal level rather than a distant central plant.
Bioenergy-based: Uses organic materials such as crop residue, cattle dung, sewage sludge, food waste, municipal organic waste, and agro-waste.
Waste-to-Energy Model: Converts waste into biogas, electricity, heat, compressed biogas (CBG), syngas, ethanol, methanol, or biochar.
Why are decentralised bioenergy systems emerging as a strategic pillar of India’s energy security?
Import Dependence: India imports more than 85% of its crude oil requirement and nearly 50% of its natural gas, exposing the economy to geopolitical disruptions and volatile fuel prices.
Domestic Resource Utilisation: Converts locally available agricultural residue, food waste, sewage sludge, and municipal organic waste into productive energy assets.
Energy Resilience: Reduces vulnerability arising from centralized fuel supply chains and external energy shocks.
Distributed Energy Generation: Enables localized production and consumption of energy, reducing transmission losses and transportation costs.
Circular Economy Transition: Shifts waste management from disposal-centric systems toward resource recovery and economic reuse.
How does India’s biomass surplus create a major untapped energy opportunity?
Biomass refers to organic material derived from plants, animals, or biodegradable waste that can be used to produce energy.
Biomass Availability: India generates nearly 750 million tonnes of agricultural biomass annually.
Surplus Potential: Around 230 million metric tonnes remain surplus and underutilised, especially crop residue and agro-waste.
Import Substitution: Efficient utilisation of surplus biomass can potentially replace nearly one-third of India’s fossil fuel imports.
Municipal organic waste: Food waste, vegetable waste, biodegradable garbage;
Industrial organic waste: Waste from food-processing industries;
Sewage sludge: Organic matter from wastewater treatment plants.
How does thermal gasification convert dry biomass into usable energy?
Thermal gasification is a high-temperature process that converts dry biomass into an energy-rich gas (called syngas) by heating it with limited oxygen.
Feedstock Suitability: Processes dry biomass such as crop residue, husk, woody waste, and solid organic materials.
Thermochemical Conversion: Uses drying, pyrolysis, oxidation, and reduction at nearly 800°C-1000°C to convert biomass into energy-rich gas.
Fuel Diversification: Enables production of renewable methane, methanol, ethanol, and hydrogen.
Industrial Application: Supports decentralized electricity generation and industrial thermal applications.
Biochar Generation: Produces biochar, which improves soil quality and facilitates long-term carbon sequestration.
Example: Agricultural residue and woody biomass can be converted into syngas for localized industrial and power-generation use.
Why is anaerobic digestion critical for India’s wet waste management challenge?
Anaerobic digestion is a biological process in which microorganisms break down wet organic waste in the absence of oxygen to produce biogas and organic fertilizer
Financial Hesitation: Capital-intensive systems discourage private investment without policy certainty.
Why is bioenergy not a single-technology solution?
Technology Diversity: Requires different technological pathways based on waste type and energy objective.
Multi-product Capability: Enables production of biogas, compressed biogas (CBG), hydrogen, syngas, renewable methane, ethanol, and methanol.
Sectoral Flexibility: Supports transport, industry, agriculture, waste management, and local electricity generation.
Example: The SATAT scheme demonstrates conversion of biomass into compressed biogas (CBG) as a renewable alternative to natural gas.
What are the key Government initiatives?
SATAT (Sustainable Alternative Towards Affordable Transportation): Strengthens compressed biogas production from agricultural and organic waste.
National Bioenergy Programme: Supports biomass, biogas, and waste-to-energy deployment.
GOBAR-Dhan Scheme: Facilitates village-level waste-to-wealth models through organic waste management.
National Policy on Biofuels, 2018: Supports ethanol blending and advanced biofuel ecosystems.
Waste-to-Energy Programme: Encourages scientific municipal waste utilization.
Conclusion
India’s energy transition cannot rely solely on large-scale renewable expansion and imported fuels. Decentralised bioenergy systems offer a practical pathway to strengthen domestic energy security by converting agricultural residue, sewage sludge, food waste, and municipal organic waste into reliable energy. A well-integrated bioenergy ecosystem can simultaneously advance energy resilience, waste management, rural livelihoods, and climate goals. This will help in making waste a strategic national resource rather than an environmental burden.
PYQ Relevance
[UPSC 2018] Access to affordable, reliable, sustainable and modern energy is the sine qua non to achieve Sustainable Development Goals (SDGs). Comment on the progress made in India in this regard.
Linkage: This PYQ is directly relevant because the article focuses on sustainable, decentralized, and affordable energy systems as instruments of energy security. The present issue expands the renewable-energy debate beyond solar and wind toward waste-to-energy, biomass utilisation, circular economy, and domestic fuel resilience.