Why in the News
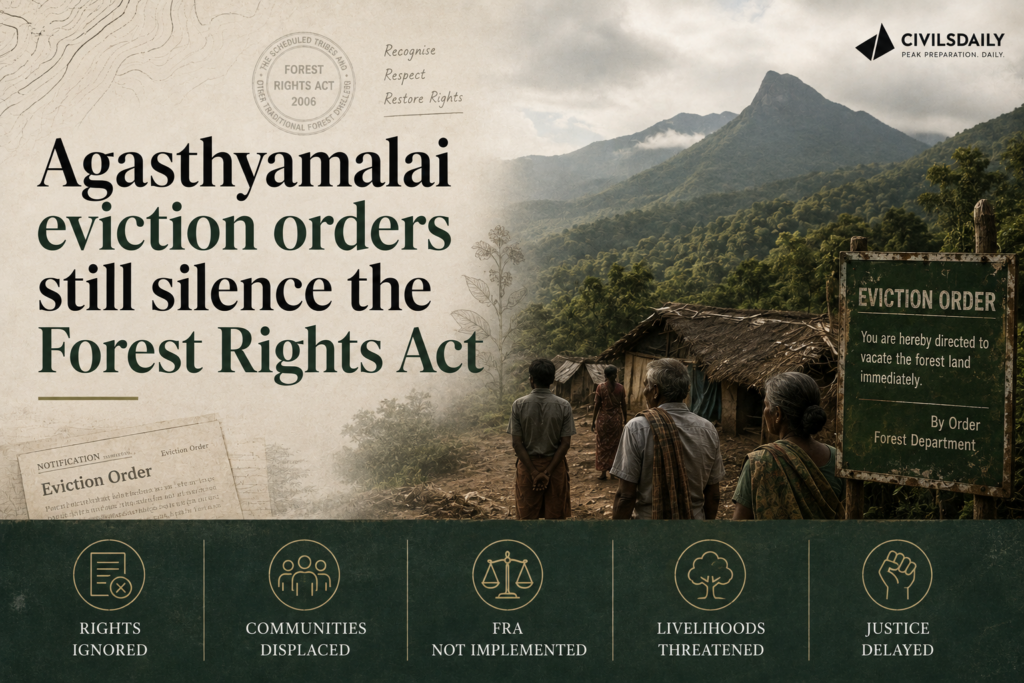
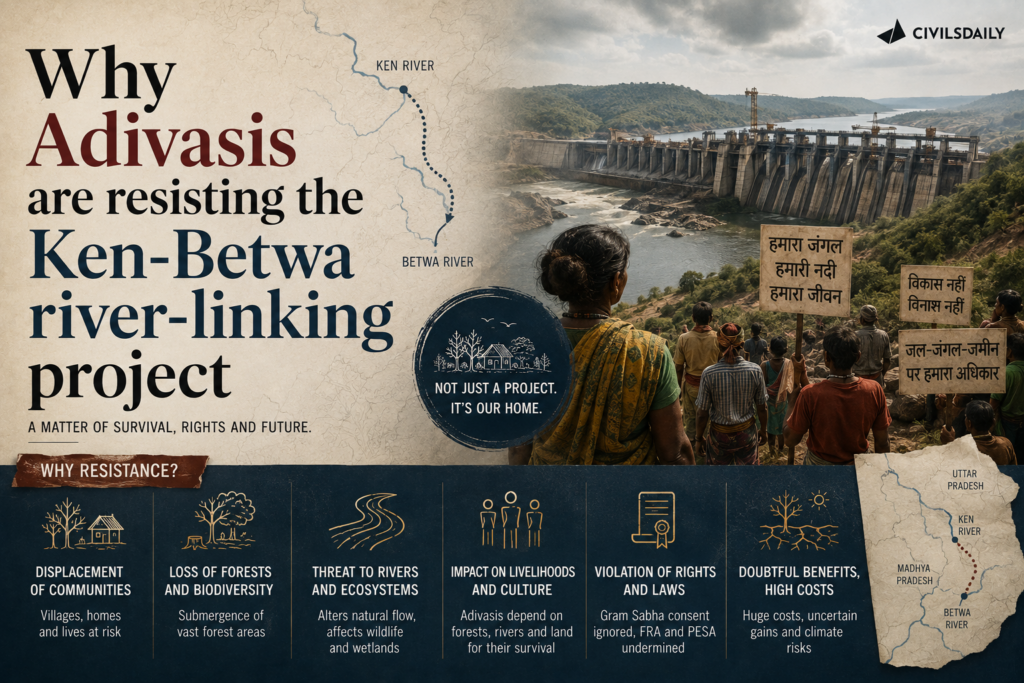
Construction on the Daudhan dam across the Ken river in Madhya Pradesh’s Bundelkhand region is advancing while 22 villages in Panna and Chhatarpur districts face displacement. The project is designed to move water to 13 water stressed districts, and the households paying for that transfer are largely Gond Adivasi families whose forest based livelihoods and absence of recorded land title place them outside the compensation package built for the transfer. A protest movement led by Adivasi women has been running since 2022 and drew national attention in April and July 2026.
What is the Ken Betwa river linking project?
- What it does: It transfers water described as surplus from the Ken river to the Betwa river through a canal, for irrigation and drinking water in Bundelkhand.
- Approval: The Union Cabinet approved the interlink in 2021.
- The canal: A 231 km long canal carries the transferred water between the two rivers.
- The dam: The Daudhan dam, built across the Ken inside the Panna landscape, is the main structure of the project.
- The beneficiary area: Water stressed districts of Bundelkhand, a region spanning 13 districts across Madhya Pradesh and Uttar Pradesh.
- Its status in policy: It is the first link to be taken up for implementation under the national river interlinking programme.
What is a patta?
- What it is: A document of recorded title or of a recognised right over land, issued by the revenue or forest administration.
- Why it decides everything here: Compensation for acquired land is paid per acre of titled land, so a family cultivating or using land without a patta has no claim to that component.
What is the Forest Advisory Committee?
- What it is: The statutory committee under the Forest (Conservation) Act, 1980 that advises the Union government on proposals to divert forest land for non forest use.
- Its role here: Its 2017 record carries the detailed project report’s estimate of the tree felling the project requires.
What is the Chita Aandolan?
- What it is: A symbolic pyre protest in which affected villagers lie on funeral pyres to signal that displacement amounts to the end of their life in the place.
- Who leads it: It has been led by Adivasi women of the affected villages and has run since 2022.
What is minor forest produce?
- What it is: Non timber produce of plant origin gathered from forests, including mahua flowers, tendu leaves, fruits, resins and seeds.
- Why it is the livelihood question: Households in the affected villages meet their cash and food needs by collecting charwa, mahua, tendu leaves and guli golanda, none of which is valued in a land based compensation formula.
What are the numbers behind the displacement?
- Villages submerged: 10 villages, including Daudhan, will be submerged by the reservoir.
- Villages displaced for compensatory forest: Because the project falls within the Panna Tiger Reserve, the people of another 12 villages will be displaced to offset the loss of forest area.
- Total affected: 22 villages across Panna and Chhatarpur districts in all.
- Population at the dam site: Around 700 people live in Daudhan village, next to which construction is under way.
- A village outside the submergence zone: Narauli, home to around 300 people and inhabited mostly by the Gond community, sits on a hill outside the submergence zone and faces the same loss of forest access.
- Cash compensation: Villagers who were 18 years or older in February 2024 are eligible for Rs 12.5 lakh each.
- Land compensation: Rs 5 lakh per acre of acquired land, payable only against titled land.
- Tree felling: A 2017 Forest Advisory Committee record carries the detailed project report estimate that 23 lakh trees will be felled. Some experts hold this to be an underestimate.
- Forest area submerged: The Daudhan dam submerges about 4,141 hectares of Panna Tiger Reserve land, within a wider rehabilitation process affecting about 1,913 families.
How has the resistance developed?
- Start of the movement: The Chita Aandolan, or symbolic pyre protest, has been running since 2022.
- Preventive detention: The leader of the movement was placed under preventive detention in February 2026.
- Gathering at the magistrate’s office: About 200 villagers assembled at the sub divisional magistrate’s office demanding his immediate release.
- Police account of the escalation: The Superintendent of Police, Chhatarpur, stated that villagers later locked the office and threw stones at revenue officials and at a marriage procession, after which the police used minimum limited force.
- April protest: Affected Adivasi families staged a pyre protest in Chhatarpur on 10 April 2026, which brought the movement national attention.
- July protest: Villagers again lay on symbolic pyres and began a hunger strike at the Barnar river, with a protest on the banks on 18 July.
- Clearance of the site: After 15 days, the police cleared the protest site.
- Dialogue that did not occur: The movement’s leader stated that the administration had promised a dialogue with representatives of the Centre, and that no such conversation took place.
Why was the project approved?
- The surplus framing: The Ken is treated as carrying water beyond its basin’s need, and the Betwa basin as deficient, which is the premise the transfer rests on.
- The regional case: Bundelkhand is among India’s driest and most impoverished regions and has a long record of drought and distress migration.
- The stated purpose: Irrigation and drinking water for the water stressed districts of the region.
- The two rivers: The Ken rises in the Vindhyan plateau, flows mainly through Madhya Pradesh and joins the Yamuna at Banda in Uttar Pradesh. The Betwa also rises in the Vindhyas, flows mainly through Uttar Pradesh and meets the Yamuna at Hamirpur.
- Why both matter locally: Both rivers run through the same region, so the transfer moves water within Bundelkhand rather than out of it.
- The contested premise: The surplus classification is an assessment of basin yield, and it is the step that decides how much displacement is treated as justified.
Why does monetary compensation fail to reach the affected?
- The title requirement: Most Adivasi families in the affected villages do not hold patta land, so the per acre component does not apply to them.
- The cut off date: Eligibility for the cash component is fixed by age as on February 2024, which excludes those who reached adulthood after that date.
- Forest income is unvalued: Livelihoods built on mahua, charwa, tendu leaves and other forest produce are not converted into any head of compensation.
- Non submergence villages: Narauli is not in the submergence zone yet loses the forest that sustains it, a loss the acquisition framework does not recognise.
- Standing assets: Trees planted over a lifetime, including mango, ber, kaitha and teak, are counted as forest loss for the project and not as household assets.
- Process complaints: Houses in some villages were demolished without adequate notice or compensation, according to the movement’s leader.
What is being lost beyond land and houses?
- Community: Households state that relocation breaks the kinship network in which they live, so the social relations of the village do not travel with the compensation.
- Language: Villagers raise the loss of their own dialect in a new settlement as a distinct concern.
- Sacred geography: Village deities and sites of worship are tied to the specific location and cannot be relocated with the households.
- Birthplace claim: Residents describe the land along the Ken as their janam bhoomi, or place of birth, and treat that as an independent ground of refusal.
- Forest as an economy: The forest edge supplies food, cash income and fuel, so its loss is an income shock and not only a cultural one.
- The collective demand: The stated position is a forest for their forest, land for their land, water for their water and a village for their village.
Where does the water security case collide with the displacement cost?
- Two legitimate claims: Drinking water and irrigation for 13 water stressed districts is a genuine public purpose. So is the security of tenure of the households inside the submergence zone.
- Same region, different people: The transfer moves water within Bundelkhand, so the beneficiaries and the displaced belong to the same drought affected region.
- The forest multiplier: Because the reservoir sits inside a tiger reserve, forest loss must be offset, which displaces a second set of 12 villages that the dam itself would not have touched.
- Compensation without capacity: A cash package can settle a title based claim. It cannot replace a forest based livelihood or a functioning village.
- The dialogue gap: Even where the project moves ahead, an immediate and structured negotiation on resettlement and rehabilitation with an organised community is missing, as the organiser of the Narmada Bachao Andolan has recorded.
- Deferred rather than resolved: Building the dam settles the water question and shifts the livelihood question to a resettlement site that has not been defined.
What has the administrative response been?
- Claim of redressal: The District Magistrate of Chhatarpur in April stated that most of the demands raised during the April protests had been addressed.
- Silence since: The current District Magistrate and the Chief Executive Officer of the Zila Panchayat did not respond to repeated requests for comment.
- Revenue department: An email to the Principal Secretary of the Madhya Pradesh Revenue Department, which oversees land acquisition, drew no reply.
- Policing of protest: Villagers who went to Chhatarpur and Bijawar to press their demands state that the police responded with lathis.
- Official account of force: The Superintendent of Police stated that minimum limited force was used after the office was locked and stones were thrown.
- Field level messaging: Households report being told by the village revenue official that their land is going to submerge and that no further claim arises.
What are the villagers demanding?
- April demands, first: A joint survey of land and houses by the administration and the affected families.
- April demands, second: Rs 25 lakh in compensation per individual.
- April demands, third: Four times the value of the land in compensation.
- April demands, fourth: A deadline of April 2026 for settlement of these claims.
- July demands, first: Three acres of land granted jointly in the names of the male and the female head of each family.
- July demands, second: A village for the displaced village, so that the community is resettled together rather than scattered.
- July demands, third: The same April 2026 deadline carried forward.
- The organising principle: The shift from cash amounts in April to land and village in July reflects a demand for restitution in kind rather than a higher price.
Challenges to the Ken Betwa river linking project
- Contested surplus assessment: The classification of a river as surplus rests on basin yield estimates that independent hydrologists dispute. e.g. objections filed before the Supreme Court’s Central Empowered Committee on the Ken’s assessed surplus.
- Loss inside a protected area: The reservoir submerges core tiger habitat, which no compensatory afforestation reproduces. e.g. about 4,141 hectares of Panna Tiger Reserve land under submergence.
- Cumulative pressure on the same landscape: Further projects are cleared in the same corridor while the dam is under construction. e.g. the 1,800 MW Panari pumped storage project cleared on about 411 hectares in the Panna Ranipur corridor in August 2026.
- Compensatory afforestation cannot replace old growth: Plantations take decades to deliver the produce and habitat value of a felled forest. e.g. an estimated 23 lakh trees to be felled under the detailed project report.
- Forest rights not settled before acquisition: Individual and community claims under forest rights law are often unsettled when land is taken. e.g. Gond families in the affected villages without patta land.
- Resettlement site quality: Displaced households are commonly resettled on land without water, forest access or common grazing. e.g. the long unresolved rehabilitation record of the Sardar Sarovar oustees.
- Cost and time escalation: Long gestation interlinking works overrun both budget and schedule, which pushes rehabilitation spending to the end. e.g. an approved cost of about Rs 44,605 crore in 2021 with an eight year completion schedule.
- Downstream and interstate obligations: Water sharing commitments between Madhya Pradesh and Uttar Pradesh determine actual delivery, not the design capacity. e.g. the interstate memorandum of agreement signed on 22 March 2021.
Conclusion
The Ken Betwa link moves water within Bundelkhand, and it moves the entire cost of that transfer onto Adivasi households whose form of landholding and forest based income the compensation framework does not recognise. The design question is not the amount of the package but its unit: the villages are asking for land, forest and a resettled village, and the State is offering a per head cash sum against titled acres most of them do not hold. Until forest rights are settled and a defined resettlement site is negotiated with the community as a unit, construction will continue to run ahead of rehabilitation.
Interlinking of Rivers in India
- The idea: Transferring water from basins assessed as surplus to basins assessed as deficient, through a network of storage dams and link canals.
- The plan: The National Perspective Plan of 1980 of the Ministry of Irrigation set out the framework for such transfers.
- The agency: The National Water Development Agency, set up in 1982, prepares feasibility and detailed project reports for the links.
- The scale: The plan identifies 30 links, comprising 16 under the peninsular component and 14 under the Himalayan component.
- The judicial push: The Supreme Court in 2012 directed the Union government to implement the interlinking programme in a time bound manner and to constitute a special committee.
- The first link: The Ken Betwa link is the first project taken up for implementation under the plan, with a dedicated authority created for it in 2021.
- The claimed benefit: Drought proofing, flood moderation, additional irrigated area and hydropower, drawn from moving water between basins with different rainfall regimes.
Constitutional Framework Governing Water, Land and Forest Rights
- Seventh Schedule, State List Entry 17: Places water supply, irrigation, canals, drainage, embankments and water storage with the States, subject to Entry 56.
- Seventh Schedule, Union List Entry 56: Allows Parliament to regulate and develop interstate rivers and river valleys in the public interest.
- Seventh Schedule, Concurrent List Entry 17A and 17B: Place forests, and the protection of wild animals and birds, on the Concurrent List after the 42nd Amendment.
- Article 262: Empowers Parliament to provide for adjudication of interstate river water disputes and to bar the jurisdiction of courts in them.
- Article 21: Protects life and personal liberty, read to include the right to livelihood and to a healthy environment.
- Article 48A and Article 51A(g): Direct the State to protect the environment and forests, and place a corresponding fundamental duty on every citizen.
- Article 244 and the Fifth Schedule: Provide for the administration of Scheduled Areas and the protection of tribal interests, including through the Tribes Advisory Council.
- Article 243ZD read with Part IX: Places village level planning with the Panchayats, which is the base for consultation requirements in Scheduled Areas.
Laws and Rules Governing Displacement, Forests and River Projects
- Right to Fair Compensation and Transparency in Land Acquisition, Rehabilitation and Resettlement Act, 2013: Governs acquisition, compensation and the rehabilitation entitlements of affected families.
- Forest (Conservation) Act, 1980: Requires prior central approval for diversion of forest land to non forest use, with compensatory afforestation and net present value payments.
- Scheduled Tribes and Other Traditional Forest Dwellers (Recognition of Forest Rights) Act, 2006: Recognises individual and community rights over forest land and produce for forest dwelling communities.
- Wildlife (Protection) Act, 1972: Governs protected areas, and provides for tiger reserves, critical tiger habitats and the National Tiger Conservation Authority.
- Environment (Protection) Act, 1986 and the Environment Impact Assessment Notification, 2006: Provide the environmental clearance process, including public hearing and appraisal for river valley projects.
- Panchayats (Extension to the Scheduled Areas) Act, 1996: Requires consultation with the Gram Sabha before land acquisition and resettlement in Scheduled Areas.
- Inter State River Water Disputes Act, 1956: Provides the tribunal mechanism for adjudicating disputes over interstate river waters.
Back2Basics: Panna Tiger Reserve
- Designation: A tiger reserve, listed in the Places in News record as the protected area within which the Daudhan dam is being built.
- Location: Panna and Chhatarpur districts of Madhya Pradesh, on the Vindhyan range in the Bundelkhand region.
- Constitution: Panna National Park was notified in 1981 and the area was declared a tiger reserve in 1994 under Project Tiger.
- River: The Ken river flows through the reserve and supports its gorges, waterfalls and riverine habitat.
- International recognition: It was designated a biosphere reserve and was added to the UNESCO World Network of Biosphere Reserves in 2020.
- Conservation record: Tigers became locally extinct in the reserve by 2009, and a reintroduction programme rebuilt the population, treated as a landmark recovery.
- Vegetation: Tropical dry deciduous forest with teak and kardhai woodland, interspersed with grassland and plateau.
- Fauna: Tiger, leopard, sloth bear, chital, chinkara, sambar and nilgai on land, with gharial, mugger and the Indian vulture along the Ken.
- Landscape connectivity: It links to the Nauradehi Wildlife Sanctuary and the Satpura landscape, and the Panna Ranipur corridor extends toward Uttar Pradesh.
Government Initiatives
- Ken Betwa Link Project Authority: The special purpose body created in 2021 to execute the link, with an interstate memorandum of agreement signed on 22 March 2021.
- National Perspective Plan and the National Water Development Agency: The 1980 plan and the 1982 agency that prepare and appraise interlinking proposals.
- Pradhan Mantri Krishi Sinchayee Yojana: Consolidates irrigation schemes to expand assured irrigation and improve water use efficiency at the farm level.
- Atal Bhujal Yojana: Supports community led groundwater management in water stressed blocks, including in Bundelkhand districts.
- Jal Jeevan Mission: Aims at functional household tap connections in rural areas, the drinking water objective the link project is meant to support.
- Project Tiger and the National Tiger Conservation Authority: Provide the statutory and funding framework for tiger reserves such as Panna, including village relocation packages.
- Compensatory Afforestation Fund Management and Planning Authority: Manages funds collected from forest diversion for compensatory afforestation and habitat improvement.
Key Facts about the Ken Betwa Link Project
- Approval and cost: Approved by the Union Cabinet in December 2021 at a cost of about Rs 44,605 crore, with an eight year completion schedule.
- The agreement: A memorandum of agreement between the Union government, Madhya Pradesh and Uttar Pradesh was signed on 22 March 2021, observed as World Water Day.
- Annual irrigation: Designed to provide annual irrigation to about 10.62 lakh hectares across the two States.
- Drinking water: Designed to supply drinking water to about 62 lakh people.
- Power: Includes 103 MW of hydropower and 27 MW of solar capacity.
- The dam: The Daudhan dam is about 77 metres high and about 2,031 metres long, with a tunnel system feeding the link canal.
- The rivers: The Ken and the Betwa are both tributaries of the Yamuna, joining it at Banda and Hamirpur respectively in Uttar Pradesh.
- The region: Bundelkhand covers 13 districts across Madhya Pradesh and Uttar Pradesh and is among India’s driest and most impoverished regions.
Challenges in River Interlinking
- Basin surplus is contested science: Surplus and deficit classifications rest on yield estimates that vary with the data series used. e.g. disputes over the assessed surplus of the Ken before appraisal bodies.
- Ecological alteration of river regimes: Reduced downstream flow changes sediment transport, fish migration and floodplain recharge. e.g. gharial habitat along the Ken downstream of the Daudhan site.
- Forest and protected area loss: Links routinely pass through forests and sanctuaries where diversion cannot be reversed. e.g. submergence of about 4,141 hectares inside the Panna Tiger Reserve.
- Displacement and rehabilitation deficits: Resettlement lags construction, so families lose land before they receive an alternative. e.g. the long running rehabilitation disputes of the Sardar Sarovar project on the Narmada.
- Interstate political friction: Donor States resist parting with water once a project is under way. e.g. the long deadlock over the Mahanadi and the Godavari Cauvery link proposals.
- Cost and time overruns: Multi decade civil works escalate in cost, which squeezes the rehabilitation component first. e.g. the 2021 approved cost of about Rs 44,605 crore for a single link.
- Climate uncertainty: Interlinking assumes stable rainfall distribution between basins, which a changing monsoon does not guarantee. e.g. simultaneous drought across both donor and recipient basins in a deficient monsoon year.
- Groundwater alternatives neglected: Large transfers draw attention and funds away from cheaper local recharge and watershed options. e.g. traditional Bundelkhand tanks and chandela ponds that remain unrestored.
Way Forward
- Settle forest rights first: Complete recognition of individual and community forest rights under the 2006 Act before any acquisition notification is issued.
- Resettle the village as a unit: Provide a single relocation site with forest access, water and common land so that community structure survives the move, as the affected families have demanded.
- Compensate the livelihood, not only the acre: Value minor forest produce income and standing trees in the entitlement package for households without titled land.
- Institutionalise dialogue: Create a standing negotiation forum between the project authority, the district administration and elected village representatives, with recorded minutes.
- Independent hydrological review: Publish and peer review the basin yield assessment on which the surplus classification rests, before further links are appraised.
- Fund rehabilitation ahead of construction: Ring fence the rehabilitation and resettlement outlay and release it before submergence rather than after.
- Restore local water systems in parallel: Revive tanks, ponds and watershed structures across Bundelkhand so that drought relief does not rest on a single project.
- Compensatory afforestation in contiguous blocks: Locate the compensatory forest within the same landscape and monitor survival rates, rather than counting saplings planted.
“[2017, GS3, 10 marks] Not many years ago, river linking was a concept but it is becoming reality in the country. Discuss the advantages of river linking and its possible impact on the environment.”