💥Mains Ready By December. Smash Mains & Smash PYQ Admissions Open

Subject: Environment

  • ‘No material price hit on CBG on revised offtake framework’

    Why in the News

    The Union Petroleum Ministry has said that the revised compressed biogas (CBG) offtake price will not translate into a material price increase for gas consumers. The assurance answers concerns raised after the Union Cabinet cleared a revised Galvanizing Organic Bio Agro Resources Dhan (GOBARdhan) scheme on 6 August, which introduced a CBG offtake price of Rs 2,110 per metric million British thermal unit (MMBtu). The Ministry states that the full offtake price will not be recovered from consumers, since a government funded affordability cushion and a much larger gas pool absorb the difference. The contested point is whether a producer facing price is being set well above the consumer facing price, and who carries the gap between the two.

    What does the revised offtake framework fix?

    1. A single administered offtake price: The revised scheme sets the price at which compressed biogas is picked up from producers at Rs 2,110 per MMBtu, replacing case by case commercial negotiation.
    2. The stated purpose is producer viability: The Ministry describes the framework as giving CBG producers a “stable and viable” price so that plants can operate “sustainably”.
    3. Two prices, not one: The offtake price and the price billed at the burner tip are set by separate mechanisms, so a movement in one does not carry through to the other.

    How is the consumer insulated from the offtake price?

    1. A direct affordability cushion: The government provides a cushion of Rs 10 per kilogram of CBG, funded from the exchequer rather than recovered in tariffs.
    2. Stacking against a wider gas pool: The biogas volume is blended into a substantially larger pool of natural gas, so its higher unit cost is diluted across the whole pool before reaching the burner tip.
    3. The two work together, not separately: The Ministry’s position rests on the cushion and the pooling operating at the same time, not on either one alone.

    Challenges to the compressed biogas offtake framework

    1. The subsidy is an open ended fiscal commitment: An affordability cushion fixed per kilogram grows in direct proportion to volume, so success in scaling the sector raises the annual outgo rather than reducing it. Eg. The blending obligation for compressed biogas in city gas networks is designed to rise year on year. Fix. Publish a declining glide path for the cushion alongside the offtake price, so producers plan against a known taper.
    2. Pooling only dilutes cost while the biogas share stays small: The wider gas pool absorbs the price difference precisely because compressed biogas is a small fraction of it, and that cushion thins as the mandated share rises. Eg. Domestic gas allocation to city gas distribution is already rationed against demand. Fix. Tie each upward revision of the blending obligation to a reassessed pooled price so the dilution assumption is tested rather than assumed.
    3. Feedstock aggregation remains the binding constraint: Plant economics turn on assured daily supply of cattle dung, press mud and agricultural residue, which no offtake price by itself organises. Eg. Several commissioned compressed biogas plants run below rated capacity for want of steady feedstock. Fix. Contract feedstock aggregation through dairy cooperatives and sugar mills at the plant approval stage, so supply is committed before capital is sunk.
    4. Fermented organic manure has no assured market: A biogas plant produces a large byproduct stream that is only viable when the manure sells, and its offtake is not covered by this price framework. Eg. Fermented organic manure competes against heavily subsidised urea on farm gate price. Fix. Extend the market development assistance already notified for organic manure to the full output of registered compressed biogas plants.

    Conclusion

    The framework sets a producer facing price and leaves the consumer facing price to be settled elsewhere, which is what the Ministry’s assurance rests on. That assurance holds only while compressed biogas remains a small share of the gas pool. The next test is the scheme’s operating guidelines, which will show whether the support is open ended or tapered and how feedstock supply is to be secured.

    Back2Basics: GOBARdhan

    1. What it is: An initiative to convert cattle dung, agricultural residue and other organic waste into biogas, compressed biogas and organic manure.
    2. Where it sits: It runs as a unified registration and monitoring framework across ministries, with the Department of Drinking Water and Sanitation operating its central registration portal.
    3. What it targets: Village level cleanliness, a rural income stream from waste, and a domestic substitute for imported natural gas.
    4. How it links to fuel policy: Compressed biogas produced under it feeds the Sustainable Alternative Towards Affordable Transportation (SATAT) offtake route into city gas distribution networks.

    Matching Previous Year Question

    “[2020] According to India’s National Policy on Biofuels, which of the following can be used as raw materials for the production of biofuels? 1. Cassava 2. Damaged wheat grains 3. Groundnut seeds 4. Horse gram 5. Rotten potatoes 6. Sugar beet Select the correct answer using the code given below: (a) 1, 2, 5 and 6 only (b) 1, 3, 4 and 6 only (c) 2, 3, 4 and 5 only (d) 1, 2, 3, 4, 5 and 6 ANSWER: (a)”
  • A quiet move that has kept Dehradun’s vultures safe

    Why in the News

    Relocating a livestock carcass dump 2.4 km away from high-tension power infrastructure near Dehradun in Uttarakhand appears to have ended vulture deaths at the site. The finding comes from a decade-old study published in the latest issue of the Journal of Threatened Taxa, which documented electrocution mortality at Sudhauwala before the move. Electrocution from power infrastructure is the most under-reported of the threats to vultures, a group already among the most threatened birds globally after severe population declines across Asia and Africa. The case sets a low cost siting decision against a threat that conservation policy has so far organised itself around drugs and poisoning to address.

    What did the Sudhauwala surveys record?

    1. The survey base: The study rests on 34 surveys conducted between May 2011 and February 2014 in the Sudhauwala region of Dehradun.
    2. The population observed: It recorded 743 individual vultures belonging to five species.
    3. The mortality count: 46 vulture carcasses attributable to electrocution were documented in proximity to high-tension power transmission structures.
    4. Which species paid most: The highest proportion of mortality relative to observations was recorded for the Himalayan griffon (Gyps himalayensis), followed by the Eurasian griffon (Gyps fulvus) and the cinereous vulture (Aegypius monachus).

    Why has electrocution stayed off the vulture conservation agenda?

    1. The recognised threat list excludes it: Poisoning, veterinary non-steroidal anti-inflammatory drugs (NSAIDs), food scarcity and habitat loss are the survival challenges vulture policy in India is built around.
    2. The under-reporting is the point: Electrocution from power infrastructure has been the most under-reported threat, so it does not enter the mitigation measures those policies fund.
    3. Siting concentrates the risk: A carcass dump placed near high-tension transmission structures draws large soaring scavengers directly into a hazard they do not otherwise encounter.

    What changed after the dump was moved?

    1. The intervention: Local authorities relocated the carcass dumping site about 2.4 km away from the high-risk electricity infrastructure in April 2015.
    2. The birds still came: Subsequent observations indicated continued use of the new site by vultures, so the food source was not lost in the process.
    3. The deaths stopped: No mortality events were recorded during the limited post-relocation monitoring.
    4. Other raptors followed: The black kite (Milvus migrans) and the crested serpent eagle (Spilornis cheela) were also recorded at the relocated site.

    How far does the evidence carry?

    1. The surveys were not systematic: The authors state the surveys were conducted on a non-systematic basis, which limits how far the counts can be generalised.
    2. The signal survives the caveat: The number of mortality events observed still suggests electrocution may represent a significant localised threat, particularly for long-lived scavengers such as vultures.
    3. The follow-up stopped: No studies have been conducted at the site after 2015, so the post-relocation result rests on limited monitoring rather than sustained observation.
    4. The measure is portable: Relocating carcass dumping sites away from hazardous power infrastructure is offered as a practical conservation measure that could be applied in other affected areas.

    Conclusion

    A single siting decision, moving a carcass dump away from transmission lines, removed a mortality source that no drug ban or breeding programme would have touched. The result stands on limited post-relocation monitoring and on surveys the authors themselves describe as non-systematic. No further study has been done at the site since 2015. The open question is whether carcass dump siting relative to transmission corridors is audited elsewhere in India, since the measure costs almost nothing and the threat it addresses is not currently counted.

    Back2Basics: Himalayan Griffon (Gyps himalayensis)

    1. What it is: One of the largest Old World vultures, a carrion feeding scavenger dependent on livestock and wild ungulate carcasses.
    2. Range and habitat: It breeds on cliffs across the Himalaya and the Tibetan Plateau at high elevations, and descends to lower hills and adjoining plains in winter.
    3. Conservation status: Listed as Near Threatened on the International Union for Conservation of Nature (IUCN) Red List, and in Appendix II of the Convention on International Trade in Endangered Species of Wild Fauna and Flora (CITES).
    4. Why status differs within the genus: Its high altitude range kept it away from the veterinary drug residues in plains livestock that pushed the resident Gyps vultures of the plains into the Critically Endangered category.

    Matching Previous Year Question

    “[2012] Vultures which used to be very common in Indian countryside some years ago are rarely seen nowadays. This is attributed to: (a) the destruction of their nesting sites by new invasive species disease among them (b) a drug used by cattle owners for treating their diseased cattle persistent and fatal (c) scarcity of food available to them (d) a widespread, persistent and fatal disease among them ANSWER: (b)”

  • Blaming climate change for extreme weather has limits

    Why in the News

    World Weather Attribution (WWA), an international research group that assesses the influence of climate change on extreme weather, has found that this year’s intense South Asian heatwave was made about three times likelier and up to 1 degree C warmer by climate change. The finding rests on extreme event attribution, a method that reruns climate models for a world without human emissions and reads the difference. Specialists have questioned how far that method can be pushed. The confidence it delivers for a multi-day heatwave collapses for a one hour cloudburst, and claims of legal liability for emissions rest on the stronger reading.

    How does extreme event attribution work?

    1. What it sets out to do: It traces the human fingerprint in a specific extreme weather event rather than in the climate record as a whole.
    2. Detection comes first: Detection establishes whether an event falls outside the range of its normal occurrence given natural variation in the climate system.
    3. The counterfactual run: Climate models are simulated first for a pre-industrial world with carbon dioxide at 280 parts per million (ppm), then for present day conditions above 420 ppm.
    4. Attribution reads the gap: The difference in the magnitude or the likelihood of the event between the two runs is assigned to human influence, and many simulations with rigorous statistical tests are required to rule out chance.

    Why is confidence higher for heatwaves than for local downpours?

    1. Long events sit inside model resolution: A day-long heatwave or several days of heavy rain unfolds slowly enough for a global climate model to represent it.
    2. Short bursts do not: Intense bursts of rain lasting an hour or so are harder to model and to link to climate change, because most global climate models cannot capture fast-changing processes.
    3. The resolution gap is documented: The Sixth Assessment Report of the Intergovernmental Panel on Climate Change (IPCC) notes that local phenomena such as land-sea breezes and mountain wind systems can only be realistically represented at a simulation resolution of around 10 km or less, which current models do not support.

    What data and computing limits hold the science back?

    1. The observational record is too short: Analysis of localised events is hampered by limited long-term weather records.
    2. Natural variability cannot be bounded without them: Without long-term hourly or sub-hourly rainfall observations for a particular place, the range of natural variability for a heavy rainfall event there cannot be marked out with confidence.
    3. Computing power is the second constraint: Insufficient computing power restricts how finely and how often localised events can be simulated.
    4. The consequence is overreach: Uncertainties arising from observations and from models lead to unscientific claims and sweeping generalisations.

    Why can scientists not agree on what counts as extreme?

    1. The baseline decides the verdict: An event that appears extreme against a 10 to 20 year timeline may not look exceptional when analysed against a dataset spanning 500 years.
    2. Long reconstructions change the picture: A reconstruction of droughts over roughly 1,200 years found that some kinds of drought seen in the past no longer occur at all.
    3. No agreed threshold exists: Scientists are not agreed on what amounts to extreme, so the same event can be classified differently by two competent groups.

    How strong is the scientific objection to single event attribution?

    1. The possibility itself is contested: At a 2025 committee hearing at the U.S. National Academies of Sciences, Engineering and Medicine (NASEM), a Stanford University climate scientist questioned whether single event attribution is even possible at all from a scientific point of view.
    2. The counterfactual cannot be validated: A former United Nations and United Kingdom government scientist has asked how it can be known that a climate model accurately represents a climate no one has ever observed.
    3. The difficulty is conceded by the panel: NASEM experts have previously noted that it is challenging to ascertain the influence of climate change on extreme weather.
    4. Extremes predate emissions: Extreme weather events can occur even without anthropogenic climate change, so the presence of an extreme is not itself evidence of a human cause.

    What rides on the answer, and what is the alternative?

    1. The liability is pursued at two levels: Claims are brought both against countries and against individual corporations, which are two different evidentiary burdens.
    2. The carbon majors claim: Studies claim that carbon majors, meaning businesses with particularly high emissions, can be defined and that specific climate changes can be attributed to specific organisations.
    3. The court is the real test: The open question is whether such findings hold up in court, and climate models will never be perfect enough for counterfactual worlds to be accepted without challenge.
    4. The competing priority: Developing more effective early warning systems and adaptation infrastructure saves more lives than establishing who is responsible.

    Conclusion

    Extreme event attribution is strongest exactly where it is least contested, on slow, large scale events such as heatwaves, and weakest on the short, localised events that cause most sudden loss of life. That asymmetry matters because liability claims are being built on the method as a whole rather than on the events it handles well. Sparse long-term records, limited computing power and an unsettled definition of extreme all remain unresolved. Until they are, preparedness through early warning and adaptation infrastructure delivers more than attribution can.

    Back2Basics: World Weather Attribution

    1. What it is: An international collaboration of climate scientists that assesses whether and how far climate change influenced a specific extreme weather event.
    2. When it began: It was set up in 2014, and is led from the Grantham Institute at Imperial College London.
    3. What makes it distinctive: It publishes rapid analyses within days or weeks of an event, against conventional studies that take months to years.

    Matching Previous Year Question

    “[2020] Which one of the following statements best describes the term ‘Social Cost of Carbon’? It is a measure, in monetary value, of the (a) long-term damage done by a tonne of CO2, emissions in a given year. (b) requirement of fossil fuels for a country to provide goods and services to its citizens, (c) efforts put in by a climate refugee to adapt to live in a new place. (d) contribution of an individual person to the carbon footprint on the planet Earth. ANSWER: (a)”

  • Let the Western Ghats breathe

    Why in the News

    The Rs 10,000 crore, 2,000 MW Sharavathi Pumped Storage Project in Karnataka is under an interim stay by the Karnataka High Court, with work frozen until further orders. The project sits entirely inside the Sharavathi Valley Lion-Tailed Macaque Wildlife Sanctuary. An expert panel constituted by the Standing Committee of the National Board for Wildlife (NBWL) had earlier recommended against approving it. The contest is between a state that needs storage to absorb intermittent renewable power and a protected rainforest where such construction is barred outright.

    How does the Sharavathi Pumped Storage Project work?

    1. What it connects: The project links the Talakalale and Gerusoppa reservoirs on the already heavily dammed Sharavathi river.
    2. What has to be built: The link runs through massive underground tunnels and powerhouses cut into the valley.
    3. The pumping cycle: Water is pumped uphill during off-peak hours, when demand and power prices are low.
    4. The generating cycle: The stored water is released downhill to generate power during peak demand.

    Why do the Western Ghats matter beyond their species counts?

    1. Scale of the chain: The Western Ghats run 1,600 kilometres along the edge of the peninsula.
    2. Global standing: They are one of the world’s eight hottest biodiversity hotspots.
    3. What they hold: They harbour nearly half of India’s flowering plant species, a third of its vertebrate fauna, and over 300 globally threatened species.
    4. Narrow endemics: Species such as the Katlekan Marsh Nut and the Gund Day Gecko are found only in these forests and nowhere else.
    5. What primary forest looks like: In the Katlekan dark forest of North Kanara the canopy cuts out light so completely that a torch is needed at midday, a structure the fragmented woodlots counted as forest elsewhere do not reproduce.

    What do the Ghats do for the peninsula’s water and climate?

    1. First contact with the monsoon: The chain takes the first impact of the southwest monsoon and releases it downstream.
    2. Source of the Deccan’s rivers: The Godavari, Krishna, Kaveri and Tungabhadra all originate here, sustaining hundreds of millions of people across six states.
    3. Regional climate function: The dense forests temper regional climate, draw down carbon, hold soil in place, and soften the runoff and flooding that would otherwise reach the downstream plains.
    4. A moisture recycling system: Like the Amazon basin, these rainforests cycle moisture back into the atmosphere, which sustains the monsoon that feeds them.

    Why did the wildlife expert panel advise against approval?

    1. The siting is barred by law: The project lies wholly within a wildlife sanctuary that carries one of the highest levels of protection under the Wildlife (Protection) Act, 1972, where such infrastructure is strictly prohibited.
    2. The panel’s finding: The expert panel constituted by the NBWL Standing Committee recommended against approval, citing irreversible ecological harm.
    3. The technical objection: The panel questioned the project’s technical justification and found it would yield no new net energy to the grid.
    4. A net energy loss: Pumping requirements would produce a net loss of approximately 500 MW.

    What are the physical costs of building inside the sanctuary?

    1. Primary forest cleared: The project requires clearing over 50 hectares of dense primary evergreen forest.
    2. Corridors broken: The clearance fragments wildlife corridors between the Anshi-Dandeli and Bhadra-Kudremukh landscapes, cutting the routes large mammals use to move between the two.
    3. Landslide risk: The zone is geologically fragile, and blasting for underground tunnels and powerhouses with heavy industrial explosives raises the risk of slope failure.

    Does rejecting the project leave Karnataka’s storage need unanswered?

    1. The need is real and conceded: Karnataka has an installed renewable energy capacity of 20.23 GW, and critics of the project accept that this output has to be firmed up.
    2. Why storage is the constraint: Solar and wind generation is intermittent, so the grid needs a way to shift surplus power to hours of peak demand.
    3. The options are plural, not singular: Battery Energy Storage Systems, compressed air energy storage and gravity energy storage sit alongside pumped storage as ways to manage that intermittency.
    4. The siting question is separable from the technology question: Accepting the need for storage does not settle where a storage project may be built.

    Conclusion

    The argument is not that pumped storage is wrong, it is that this catchment is the wrong place to put it. A project that yields no new net energy and consumes more power than it returns cannot justify clearing primary evergreen forest. The Karnataka High Court’s interim stay holds the position for now. What remains unresolved is whether the clearance system will treat the highest protection category as an absolute siting bar or as a threshold that can be crossed on a case by case finding.

    What is Environmental Impact Assessment?

    1. About: Environmental Impact Assessment (EIA) is a planning tool that predicts and seeks to mitigate the environmental consequences of a project before it is approved.
    2. Statutory history: India introduced EIA in 1978 for river valley projects, made it statutory through the 1994 notification under the Environment (Protection) Act, 1986, and consolidated it in the EIA Notification, 2006.
    3. Who appraises what: Category A projects are appraised centrally by the Ministry of Environment, Forest and Climate Change, and Category B projects by the State Environment Impact Assessment Authority, with Category B1 alone requiring a full study and a public hearing.

    Challenges in Environmental Impact Assessment

    1. Conflict of interest in who pays: The assessment is funded by the project proponent, which creates an incentive to understate impacts. Eg. Independent data on the Mundra Port and Special Economic Zone exposed deficiencies the proponent’s own assessment had missed. Fix. Have EIA reports audited by an autonomous body not funded by the proponent.
    2. Cumulative impact goes unmeasured: Appraisal runs project by project, so the combined load on one river is never assessed. Eg. National Green Tribunal orders in 2024 and 2025 cancelled clearances on this ground. Fix. Move to landscape level cumulative assessment for a whole catchment.

    Back2Basics: Sharavathi Valley Lion-Tailed Macaque Wildlife Sanctuary

    1. Location: In the Sharavathi river valley, Shivamogga district, Karnataka.
    2. Landmarks within it: Jog Falls and the Linganamakki reservoir lie inside it.
    3. Flagship species: The lion-tailed macaque, an endemic arboreal primate, is a keystone seed disperser and an indicator of forest health.

    Matching Previous Year Question

    “[2024, GS3, 10 marks] What role do environmental NGOs and activists play in influencing Environmental Impact Assessment (EIA) outcomes for major projects in India? Cite four examples with all important details.”

  • Govt. to replace 2 lakh old trucks/buses in Delhi-NCR in one year (PARIVARTAN scheme)

    Govt. to replace 2 lakh old trucks/buses in Delhi-NCR in one year (PARIVARTAN scheme)

    Why in the News

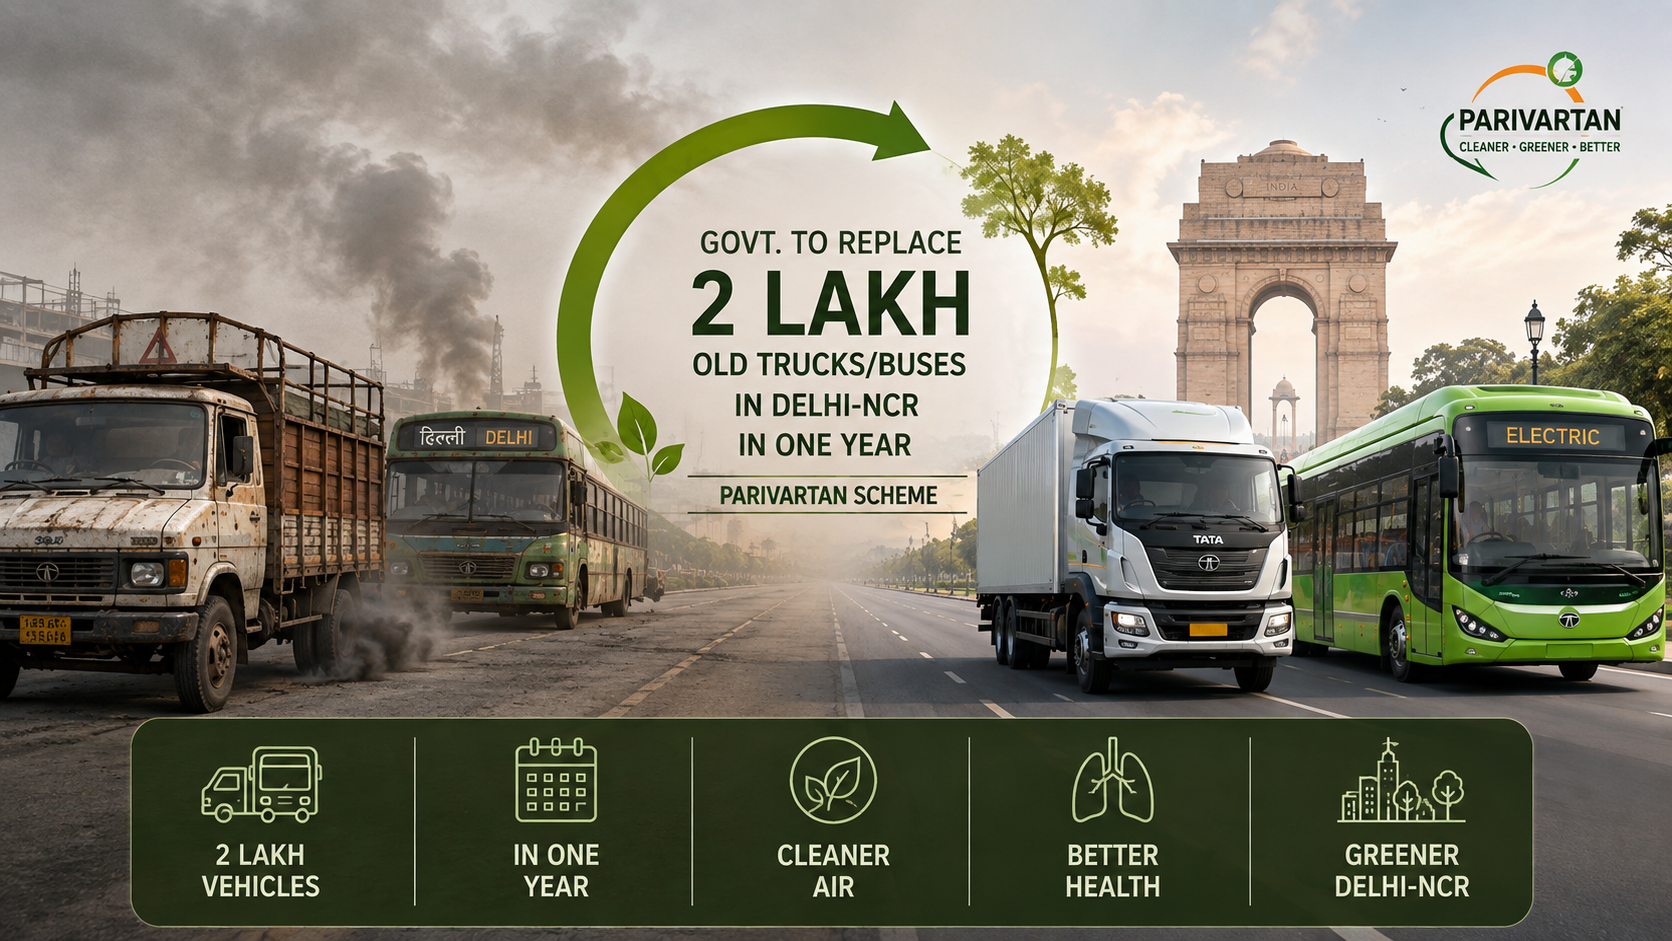
    The Union government aims to replace more than two lakh trucks and buses in Delhi and the National Capital Region with BS VI or electric vehicles within a year under the PARIVARTAN scheme, the Road Secretary has said. This brings forward a two year implementation timeline the Union Cabinet had earlier approved for the scheme. Trucks and buses make up only 3.1% of the region’s total vehicle fleet but contribute 36% of vehicular PM2.5 emissions, so the scheme concentrates replacement incentives on a small segment of the fleet rather than vehicles as a whole.

    What is the PARIVARTAN scheme?

    1. A vehicle renewal and incentive scheme: PARIVARTAN (the Programme for Accelerated Renewal and Incentivization of Vehicle Assets for Reducing Transport Air Pollution and Network Emissions) is a Union scheme to replace old trucks and buses in Delhi NCR with cleaner vehicles.
    2. Targets older commercial vehicles across four jurisdictions: It covers trucks and buses registered in Delhi and the NCR districts of Haryana, Rajasthan and Uttar Pradesh that conform to BS IV or older emission norms.
    3. Jointly funded and implemented: The scheme is funded through the National Capital Region Planning Board under the Ministry of Housing and Urban Affairs and implemented by the Ministry of Road Transport and Highways.

    What incentives does PARIVARTAN offer to push buyers toward cleaner vehicles?

    1. A large but shared financial outlay: The scheme carries a total financial outlay of Rs. 9,585 crore, of which Rs. 5,041 crore is central budgetary support.
    2. Lower cost of borrowing: Eligible buyers get a 5% interest subvention on vehicle loans for five years.
    3. Waived recurring and one time levies: Eligible buyers of new BS VI vehicles get a 100% road tax waiver for 10 years and exemption from registration fees.
    4. A manufacturer side discount: Eligible buyers also get at least an 8% discount on the ex showroom price from participating vehicle manufacturers.

    Challenges to the PARIVARTAN scheme

    1. Fleet turnover in one year is an aggressive compression: Compressing the replacement of over two lakh vehicles into one year against an originally planned two year timeline strains scrapping, registration and financing capacity built for a slower pace. Eg. India’s separate vehicle scrappage policy has itself faced slow uptake since 2021 because of limited authorised scrapping facility capacity in most States. Fix. Expand authorised vehicle scrapping facility capacity in Delhi NCR ahead of the compressed timeline, rather than relying on facilities sized for the original two year plan.
    2. Small operators may lack access to the incentives: Interest subvention and manufacturer discounts assume buyers can access formal vehicle financing, which many small truck and bus operators in the informal freight sector cannot. Eg. A large share of India’s freight trucking fleet is owned by operators with one to five vehicles, who typically borrow from informal lenders rather than banks. Fix. Route a dedicated financing window for small fleet owners through public sector banks or the National Capital Region Planning Board itself, with relaxed collateral norms.
    3. Cross state enforcement is harder than a single city ban: The scheme spans Delhi and NCR districts across three States, and inconsistent enforcement of the BS IV cutoff across State transport departments can let older vehicles keep operating in weaker enforcement pockets. Eg. Delhi’s earlier ban on end of life diesel vehicles pushed many such vehicles into neighbouring NCR districts rather than off the road entirely. Fix. Link registration renewal and permit issuance across all four jurisdictions to a shared, real time vehicle emission compliance database.

    Conclusion

    The PARIVARTAN scheme now targets replacing over two lakh Delhi NCR trucks and buses within one year instead of two, backed by a Rs. 9,585 crore incentive package. The scheme’s next milestone is the pace of actual vehicle replacement against this compressed one year timeline, particularly among small and informal fleet operators who face the greatest financing and enforcement gaps.

  • Problem with ethanol blending isn’t sugar — it’s reliance on grains; the way forward (Op-ed by Harish Damodaran)

    Why in the News

    India’s ethanol blended petrol (EBP) programme, an arrangement under which oil marketing companies blend ethanol into petrol to progressively raise the blending ratio, was designed primarily to help sugar mills earn an additional revenue stream so they could pay cane farmers on time. For the current supply year ending October 2026, grain based feedstock accounts for 759.8 crore litres, or 72.5 percent, of the 1,048.3 crore litres of ethanol allocated among distilleries, against 288.5 crore litres, or 27.5 percent, from sugarcane based feedstock. What began as a sugar-support programme has become a grain-dependent one, and the article argues this reversal, not sugar diversion, is the programme’s real problem.

    What is the Ethanol Blended Petrol (EBP) programme?

    1. About: The EBP programme requires oil marketing companies to blend ethanol into petrol at a rising target ratio, currently 20 percent under the E20 standard, to cut crude oil imports and support farm incomes.
    2. Feedstock: Ethanol can be produced from sugarcane derived molasses and juice, or from cereal grains such as maize and rice, through milling, starch extraction, fermentation, distillation and dehydration to 99.9 percent pure alcohol.
    3. Original design: The programme was conceived to give sugar mills a secondary revenue stream so they could clear cane payment dues to farmers, and was later extended to maize farmers as an additional demand source.

    How did the feedstock mix shift from sugarcane to grain?

    1. The molasses-only phase, till 2017-18: All ethanol supplied to oil marketing companies came from C-heavy molasses, the final byproduct of cane juice processing left after mills had recovered all economically extractable sugar.
    2. The B-heavy and direct-juice phase, from 2018-19: Mills began producing ethanol from intermediate B-heavy molasses and directly from cane juice or syrup, incentivised by higher government-set prices for ethanol from these routes, which let mills divert sucrose before it was even crystallised into sugar. Ethanol supplies to oil marketing companies rose from 38 crore litres in 2013-14 to 190 crore litres in 2018-19, and blending rose from 1.6 percent to 4.9 percent over the same period.
    3. The grain takeover, 2018-19 onward: Standalone grain-based distilleries, running on maize or on surplus and damaged rice sourced from the Food Corporation of India (FCI) or the open market, expanded independently of the sugar season. By 2023-24, grain-based feedstock supplied 402 crore litres, or 59.7 percent, of the 673 crore litre total that helped achieve 14.6 percent average blending, a reversal the article calls the tail wagging the dog.
    4. Current supply year, 2025-26: Of the 1,048.3 crore litres allocated to hit the E20 target, 759.8 crore litres, or 72.5 percent, is from grains and only 288.5 crore litres, or 27.5 percent, is from sugarcane-based feedstock, against a backdrop of September-ending sugar stocks projected at a 17-year low.

    Why is rice, not maize, now the likely mainstay feedstock?

    1. Maize supply risk: El Nino conditions are expected to persist through the first half of next year, raising doubts about maize availability for ethanol in 2026-27 even as sugarcane diversion is curtailed.
    2. Rising reliance on FCI rice: The government allocated 5.2 million tonnes of surplus FCI rice to ethanol distilleries for 2025-26, raised to 7.2 million tonnes in July; at 450 to 460 litres of ethanol per tonne, that yields only 325 to 330 crore litres, well short of the roughly 1,050 crore litres needed to sustain E20.
    3. Rice is water-intensive and underpriced for this use: FCI rice is sold to ethanol distilleries at Rs 23.2 per kg, with a reserve price of Rs 21 per kg for fully broken grains, against a retail market price of Rs 40 per kg for normal rice and Rs 30 per kg for broken rice, and rice is a water-guzzling crop to be diverting toward fuel at scale.
    4. Distillery capacity outpaces demand: Distillers have built an aggregate ethanol production capacity of nearly 2,000 crore litres, against 421 crore litres in 2014 and current annual offtake of 1,050 crore litres, and it is this installed capacity, not farmer need, that is driving the push for even higher blending standards such as E22, E25, E27 and E30.

    What effect has the programme had on maize farmers, and what is at risk if grain reliance deepens further?

    1. Maize price gains: With ethanol demand added to poultry and livestock feed demand, wholesale maize prices in India rose from a Rs 13.8 to Rs 17.8 per kg range in 2021 to a Rs 22.1 to Rs 24.5 range in 2024, benefiting maize growers the way the programme once benefited cane farmers.
    2. A rice-driven repeat of the same trade-off: Sustaining current blending targets without sugar or adequate maize would require earmarking still more FCI rice, a shift the article argues is difficult to justify given rice’s water footprint and its underpriced diversion from the food security stock.

    Way Forward

    1. Discourage standalone grain distilleries reliant on FCI rice: The government should end this diversion route and push distillers toward less water-intensive grains such as bajra and jowar, which carry 58 to 62 percent recoverable starch and can yield 380 to 400 litres of ethanol per tonne, comparable to maize, letting millet farmers gain the same price benefit maize growers have seen.
    2. Stop chasing blending targets ahead of schedule: The EBP programme was already succeeding at 10 to 15 percent blending, and the article notes the government’s own chief economic adviser has suggested reverting to the E10 standard, an argument the piece endorses as pragmatic rather than a retreat.

    Back2Basics: What is the E10/E20 standard?

    1. E10 and E20 denote the percentage of ethanol blended into petrol, so E20 petrol contains 20 percent ethanol against 80 percent petrol by volume.
    2. India crossed the E10 blending average in 2021-22 and reached the E20 national average in the current 2025-26 supply year, years ahead of the original 2030 target set for E20.
    3. Government notified fuel standards now extend beyond E20 to E22, E25, E27 and E30, reflecting distillery capacity built well beyond current ethanol offtake.

    Matching Previous Year Question

    PrelimsPYQ.csv: “In the context of alternative sources of energy, ethanol as a viable bio-fuel can be obtained from:” (2009, Microtheme: Biofertilizers/Fuels, Subject: Environment)

  • Policy mistakes, not ethanol, behind sugar price rise (Editorial)

    Why in the News

    Retail sugar prices have risen from an average of Rs 45 to Rs 65 per kg within a month, and the increase is being widely blamed on the ethanol blended petrol programme. Only 27.5 percent of the ethanol supplied by distilleries to oil marketing companies in 2025-26 came from sugarcane juice and molasses, with the balance from cereal grains, and the roughly 3 million tonnes of sugar diverted for ethanol is close to a tenth of the year’s 30.9 million tonne gross production. Similar or larger diversions in the four preceding sugar years did not cause comparable price spikes, which places the blame elsewhere.

    Is ethanol actually responsible for the price spike?

    1. Small diversion share: The estimated 3 million tonnes of sugar diverted to ethanol production is close to a tenth of the 30.9 million tonne gross sugar output for the year ending September 2026.
    2. No precedent for a price link: The four preceding sugar years saw diversions of 3.5 million tonnes, 2.4 million tonnes, 4.3 million tonnes and 3.6 million tonnes respectively, all without triggering a comparable price spiral.
    3. Feedstock mix has shifted away from sugar already: Only 27.5 percent of ethanol supplied to oil marketing companies in 2025-26 came from sugarcane juice and molasses, with the rest from cereal grains, so the programme is no longer primarily a sugar diversion story.

    What actually explains the price spurt?

    1. A large output shortfall: Gross sugar production for the year came in well below the initial 34.4 million tonne projection made at the start of crushing in November, a shortfall of 3.5 million tonnes.
    2. A late government response: Mills in Uttar Pradesh and Maharashtra were struggling to get cane and shutting down crushing operations by February, but the shortfall was not addressed until exports were banned only in mid-May.
    3. Panic measures after prices soared: From July, as a deficient June monsoon raised concerns about cane yields for 2026-27, the government imposed a 400 tonne stock limit with a 30 day holding cap on all dealers and ordered mills to furnish details of bulk buyers who purchased 500 tonnes or more.

    What should the government have done instead?

    1. Keep the import window open: Rather than banning exports, the government could have cut the tariff on raw and white sugar imports from 100 percent to zero by April, when most mills had stopped crushing.
    2. Rely on market intelligence over controls: The sugar industry runs on government-set controls, from cane pricing to how much a mill may sell in a given month, a control structure this crisis exposed as failing to anticipate and balance supply and demand.

    Conclusion

    The editorial’s central claim is that the sugar price rise is a policy failure, rooted in a delayed response to an anticipated output shortfall and a subsequent set of panic controls, not a consequence of the ethanol blending programme. The remedy it points to, opening the import window through tariff cuts rather than export bans and stock limits, remains untested by the government to date.

    Matching Previous Year Question

    PrelimsPYQ.csv: “Statement I: Of the two major ethanol producers in the world, i.e., Brazil and the United States of America, the former produces more ethanol than the latter. Statement II: Unlike in the United States of America, where corn is the principal feedstock for ethanol production, sugarcane is the principal feedstock for ethanol production in Brazil.” (2025, Microtheme: Biofertilizers/Fuels, Subject: Environment)

  • SC committee pulls up Assam government for inaction over mining activity near Kaziranga

    SC committee pulls up Assam government for inaction over mining activity near Kaziranga

    Why in the News

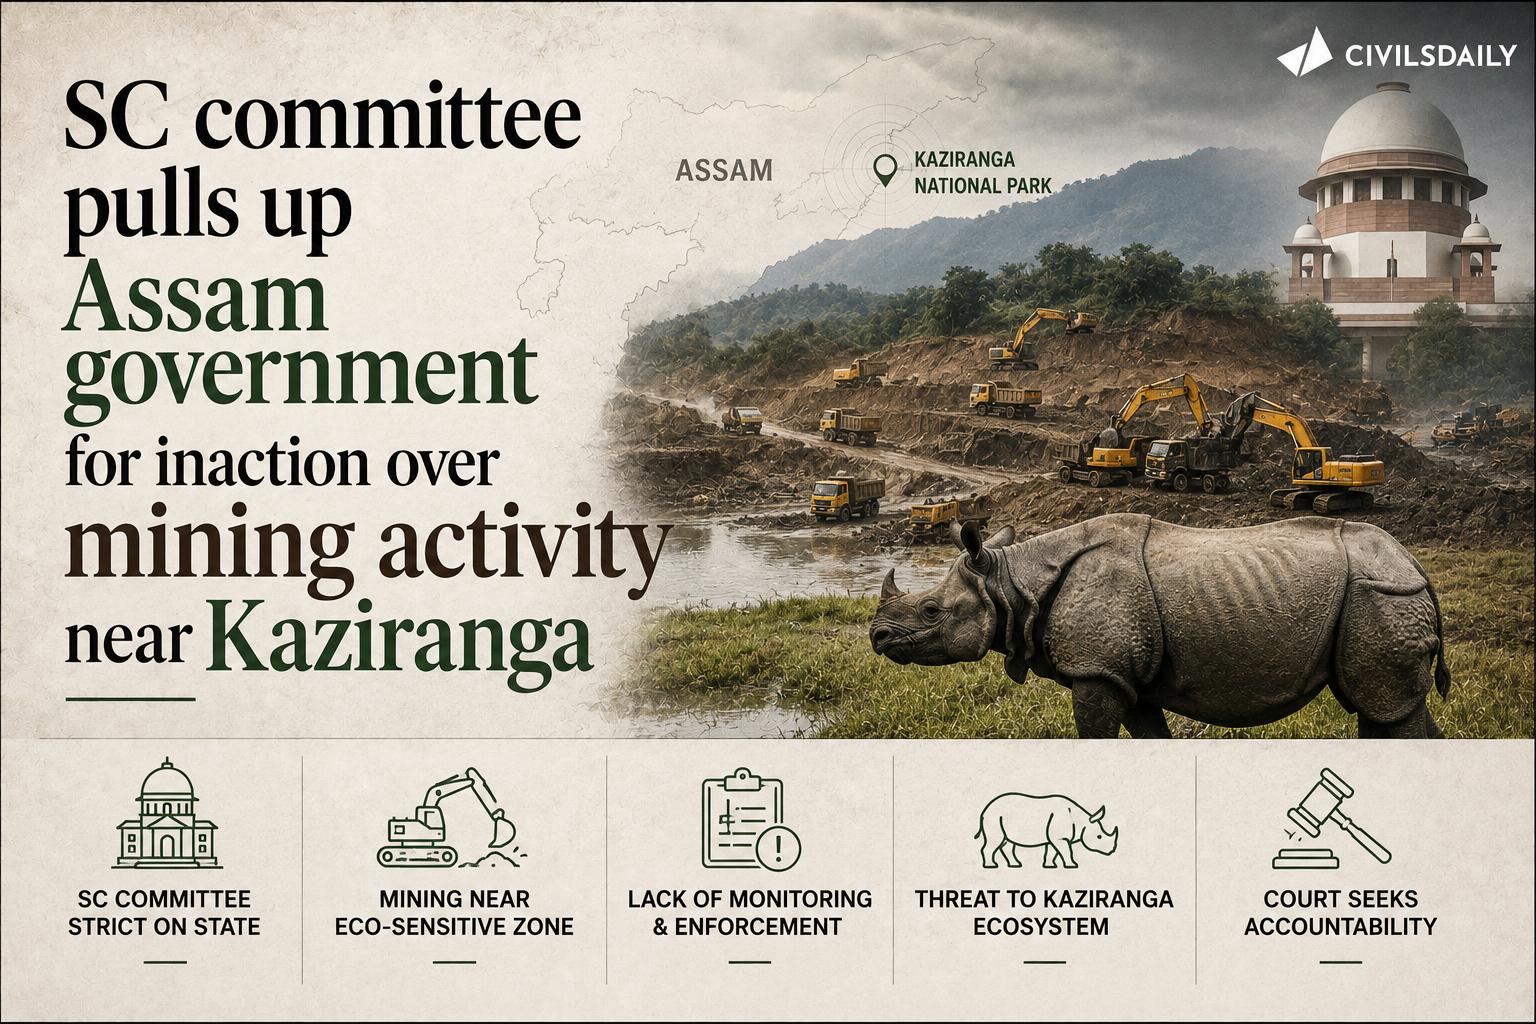
    The Central Empowered Committee (CEC), a body constituted by the Supreme Court to monitor compliance with its forest and wildlife orders, has held that the Assam government did not address mining in and around the Parkup Pahar Range with the seriousness it deserved. The Range is a declared wildlife sanctuary and a vital ecological corridor on the southern boundary of Kaziranga National Park. The finding follows the CEC’s own directions of 30 May 2025 to the Assam Chief Secretary, which required a comprehensive Watershed Drainage Analysis Report and quarterly status reports on action against reported violations. The Supreme Court had already restrained all mining along Kaziranga’s southern boundary by an order of 12 April 2019. The committee’s finding lands amid a separate controversy over a plan to reduce the Eco-Sensitive Zone of Kaziranga National Park, so the State is seeking a narrower buffer while existing court-ordered protections remain unimplemented.

    What is the Central Empowered Committee?

    1. A court appointed compliance body: The CEC was constituted by the Supreme Court to monitor and report on compliance with its orders in forest and wildlife matters, and to examine applications referred to it.
    2. What it produces: It examines complaints and applications, calls for records from State governments, and files reports and recommendations to the Supreme Court on which the Court then acts.
    3. How its directions reach a State: It writes directly to the State Chief Secretary with timelines and required submissions, and treats the absence of a submission as a compliance failure to be reported.

    What did the Right to Information trail reveal?

    1. The application: A Right to Information (RTI) application was filed on 15 June by an environmental activist, seeking details of compliance with those directions.
    2. What was sought: It asked for copies of both submissions the directions had required of the State.
    3. The core document is missing: The CEC’s response of 17 July stated that it did not receive the comprehensive Watershed Drainage Analysis Report.
    4. Partial compliance only: The response said the quarterly status reports had been attached, and it does not show that the watershed exercise the CEC ordered was completed.
    5. The deadline had already passed: The CEC had fixed October 2025 as the deadline for submitting the watershed report.

    What does the earlier record show?

    1. The originating proceeding: The CEC recorded allegations of renewed mining in Parkup Pahar in the same report that carried those directions, filed on “Application No.1592 of 2024”.
    2. The standing court order: The Supreme Court’s order of 12 April 2019 restrained all mining and related activities along the southern boundary of Kaziranga, and throughout the catchments of rivers and streams originating in the Karbi Anglong hills and flowing into the park.
    3. The construction bar: The same order prohibited new construction on private lands forming part of nine identified animal corridors.
    4. Mining continued regardless: On 3 March the CEC wrote to the Assam Chief Secretary noting that mining and related activities had been going on “in some way on one pretext or the other”.
    5. The local authority’s conduct: The same letter recorded that the Karbi Anglong Autonomous Council (KAAC) was not presenting a holistic picture to the courts. The KAAC administers Karbi Anglong, the district that forms Kaziranga’s southern boundary.
    6. A six year old request remains unanswered: The CEC’s letter of 6 May 2021 specifically asked the State government to communicate the action taken to notify the animal corridors connecting the park, and no response was received. The catchment areas of the streams and rivers originating in the Karbi Anglong hills remain unidentified after more than six years.

    Why does the elephant reserve finding matter?

    1. The area is doubly protected: The Parkup Pahar Range is both a declared wildlife sanctuary and a vital ecological corridor linking the park to the Karbi Anglong hills.
    2. The reserve covers both landscapes: The Karbi Anglong Elephant Reserve covers Karbi Anglong and Kaziranga National Park, so the mining sits inside a notified elephant reserve rather than beside one.
    3. Documented damage: The panel pointed to areas of the reserve ravaged by large-scale mining, and to the death of several elephants due to conflicts with humans.
    4. The leases themselves are questioned: The CEC asked how mining leases around Borjuri could have been sanctioned at all, given that the area forms part of the elephant reserve.
    5. The administering council is faulted directly: The CEC recorded that the KAAC “seems oblivious of all these notifications and is not conscious of the measures that need to be taken to protect the ecology and wildlife of the area”.
    6. The corridor system is the stake: Animal corridors are what allow a population to move between the park and the hills, so an unnotified corridor is legally open to the construction the 2019 order sought to bar.

    Challenges to enforcing the Central Empowered Committee’s directions

    1. The committee has no independent enforcement power: The CEC reports and recommends, and only the Supreme Court can compel a State, so a State that misses a deadline faces no immediate consequence. Eg. The October 2025 watershed report deadline passed without the report and without penalty. Fix. Attach a default consequence to a missed CEC deadline, such as automatic suspension of fresh mineral concessions in the area concerned until the submission is filed.
    2. Autonomous councils sit outside the reporting chain: Sixth Schedule councils administer land and minor minerals in their areas, and directions addressed to the State Chief Secretary do not bind them directly. Eg. The National Green Tribunal’s 2014 ban on rat-hole coal mining in Meghalaya was directed at the State government, while the land it covered is administered by Sixth Schedule district councils. Fix. Make the autonomous council a named respondent in compliance proceedings covering its area, with its own filing obligation.
    3. Corridor notification is discretionary in practice: Corridors are identified in reports and remain unnotified, so no legal restriction attaches to the land inside them. Eg. Nine animal corridors around Kaziranga identified in 2019 remain unnotified. Fix. Set a statutory deadline after identification, on the expiry of which the corridor stands provisionally notified pending State action.
    4. Baseline studies are the first casualty of delay: Watershed and catchment mapping is expensive and slow, and its absence makes every subsequent violation hard to establish. Eg. The catchment areas of streams flowing into the park remain unidentified after more than six years. Fix. Fund catchment mapping from the Compensatory Afforestation Fund and commission it through a central technical agency rather than the defaulting State.
    5. Compliance is monitored through citizen requests: The gap in this case surfaced through a private RTI application rather than through a compliance dashboard. Eg. The missing watershed report was revealed by an activist’s application of 15 June. Fix. Publish CEC directions and their compliance status on a public portal, so a lapsed deadline is visible without an application.

    Conclusion

    The Central Empowered Committee has reiterated that its earlier recommendations remain unimplemented and has asked the Assam government to ensure speedy implementation of all of them, and to immediately notify the nine identified animal corridors. The current status is that the watershed report is outstanding, the corridors are unnotified, and mining leases inside the Karbi Anglong Elephant Reserve remain unexplained. The next milestone is the State’s response on the corridor notification and the watershed exercise, alongside the separate decision on the proposed reduction of Kaziranga’s Eco-Sensitive Zone. The case turns on compliance rather than on the adequacy of the law, since the restraining order and the protected area notifications already exist.

    “[2026] With reference to Madhav National Park, which of the following statements is/are correct?

    1. It was declared a Tiger Reserve in India in 2025.

    2. Sakhya Sagar, which is designated as a Ramsar Site, is situated within this National Park.

    3. Its area is shared between Madhya Pradesh and Rajasthan.

    (a) 1 only

    (b) 1 and 2

    (c) 2 and 3

    (d) 3 only

  • Barren-land fallacy

    Barren-land fallacy

    Why in the News

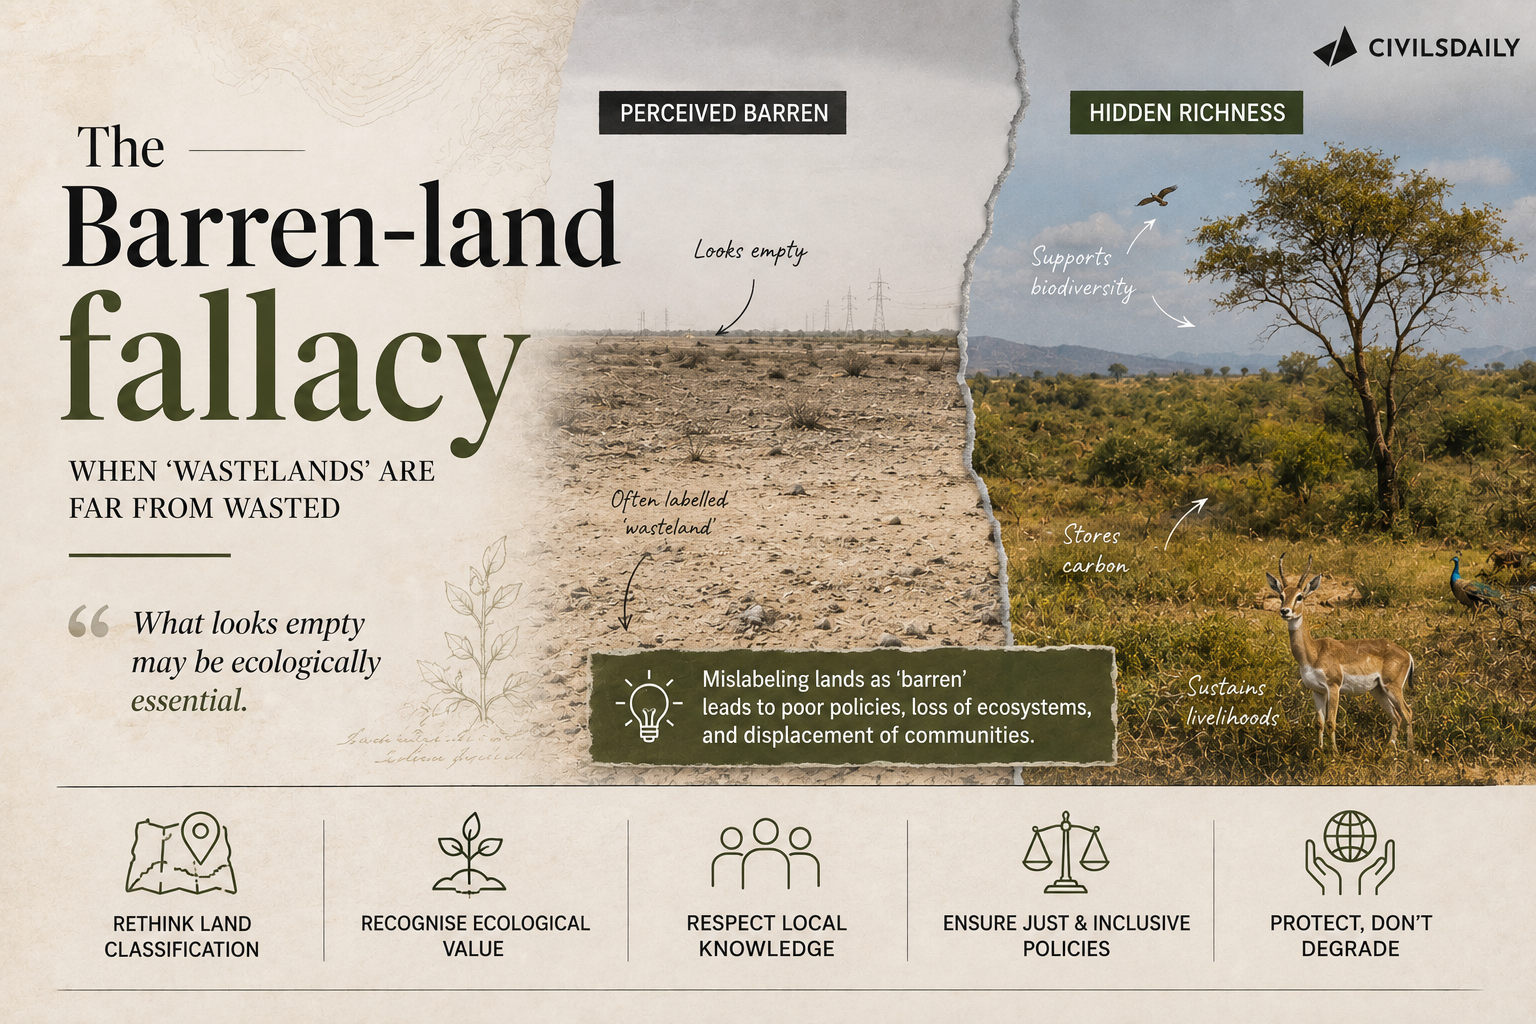
    The barren-land fallacy is the assumption that land without tree cover is barren land, therefore ecologically deficient, and that it will evolve or should be helped to evolve into a forest. Tree-planting drives in India often perpetuate this fallacy by planting trees in the wrong ecosystems, and by planting species unsuited to local conditions. Trees deliver cooling, soil retention, carbon storage and habitat only where they belong ecologically, and outside that setting they cause harm. Ecological restoration therefore does not always mean planting more trees, and the assumption that it does drives programmes that damage the ecosystems they claim to repair.

    What is the barren-land fallacy?

    1. The assumption in full: Land that does not carry tree cover is treated as barren, and barren land is in turn treated as ecologically deficient.
    2. The second step in the chain: Such land is then assumed to evolve, or to require help to evolve, into a forest, so absence of trees is read as an incomplete stage rather than a stable state.
    3. Where it becomes policy: The fallacy enters practice through tree-planting drives that select land for planting on the basis of missing tree cover rather than on the basis of what ecosystem the site naturally supports.

    What do trees actually do, and when do those benefits hold?

    1. Local cooling: Trees lower air and surface temperature in the neighbourhood in which they stand, through shade and through the water they release into the air.
    2. Soil retention: Root systems hold soil in place and slow the runoff that strips it, which is why tree cover reduces erosion on slopes and along stream banks.
    3. Carbon drawdown and storage: Trees take carbon dioxide from the air and lock the carbon into wood and soil, which is the basis of the climate value claimed for planting.
    4. Habitat provision: A stand of trees supports birds, small animals and insects that depend on canopy, bark and leaf litter for nesting and for food.
    5. The benefits are conditional, not automatic: Each of these effects holds only where a forest is the ecosystem the site naturally supports. Planted outside it, the same trees do damage.

    How do India’s tree-planting drives reproduce the fallacy?

    1. Planting in the wrong ecosystem: Drives place trees on land where a forest is not the native ecosystem, so the planting displaces the system that belongs there rather than restoring one.
    2. Species unsuited to local conditions: Drives often plant trees unsuitable for the site, such as eucalyptus, which draws a great deal of water, in a water-stressed area.
    3. Offsets substitute for restoration: Compensatory afforestation is treated as an equivalent to the forest cleared, and plantations cannot replace natural forests in biodiversity terms.
    4. Counting favours planting over ecosystem type: Programme performance is measured in area planted and saplings established, which gives no credit for protecting a grassland or a scrubland in place.
    5. Invasive species compound the damage: Species introduced to green open land spread beyond the planting site and suppress native ground cover. Prosopis juliflora has spread across Rajasthan, degrading grasslands.

    What counts as ecological restoration instead?

    1. The correct objective: To ecologically restore a place does not always mean planting more trees. It is to do whatever will protect or restore the ecosystem that would naturally occur there.
    2. When planting is the right answer: Planting trees or regenerating forests is valuable where forests have been degraded or cleared, and where a forest is the native ecosystem.
    3. Forests are one ecosystem among several: Others include grasslands, savannah, scrubland, wetlands and deserts, along with many naturally open ecosystems.
    4. The dryland assumption has a documented cost: A University of California professor of history and geography has written that the assumption that the world’s drylands are worthless, deforested and overgrazed landscapes has led to programmes and policies that have often systematically damaged dryland environments.
    5. The semi-desert is not a failed forest: The Sahel region in Mali is a semi-desert landscape, and treating such a landscape as degraded forest misidentifies both its baseline and its restoration target.

    Challenges to restoring India’s open natural ecosystems

    1. Open ecosystems have no protective legal category: Grasslands, savannahs and scrublands are classified as wasteland or revenue land in official records, so they can be allotted for planting or development without a diversion clearance. Eg. India’s grassland area has declined 31 per cent, from 18 million hectares to 12.3 million hectares. Fix. Create a distinct notified category for open natural ecosystems in land records, with diversion requiring the same clearance a forest diversion needs.
    2. Restoration targets are stated in tree cover: National and international commitments are measured in hectares brought under tree and forest cover, which makes planting the only countable action. Eg. India’s Bonn Challenge pledge is stated as restoring 26 million hectares by 2030. Fix. Report restoration by ecosystem type against a mapped reference state, so a restored grassland counts as much as a planted hectare.
    3. Species selection ignores water budgets: Fast growing exotics are chosen for survival rates rather than for their draw on local groundwater. Eg. Eucalyptus plantations in water-stressed districts lower the water table they depend on. Fix. Make a site water balance assessment a precondition to species approval in any planting programme.
    4. Open ecosystem species lose habitat to greening: Ground nesting and open country species need the absence of tall vegetation, so planting removes their habitat directly. Eg. Grassland conversion has driven the decline of the Great Indian Bustard and the Lesser Florican. Fix. Map and exclude critical open country species habitat from all afforestation and green cover programmes.
    5. Baseline ecosystem maps do not exist at working scale: Without a map of what ecosystem a site naturally supports, the planting decision defaults to the presence or absence of trees. Eg. Desertification assessment records 105.48 million hectares as degraded without separating naturally open land from degraded forest. Fix. Publish a national reference ecosystem map at the level of the revenue village, and tie every restoration sanction to it.

    Conclusion

    The barren-land fallacy treats absence of tree cover as a deficiency to be corrected, and the correction damages ecosystems that were never forests. Restoration means returning a site to the ecosystem that would naturally occur there, which in a grassland, a scrubland or a desert means protecting openness rather than closing it with canopy. The immediate consequence is that a planting drive on the wrong site is a conversion, not a restoration. Whether India’s restoration accounting can measure ecosystem type rather than tree cover is what determines if the fallacy continues to be funded.

    “[2015] Which one of the following is the best description of the term ‘ecosystem’?

    (a) A community of organisms interacting with one another

    (b) That part of the Earth which is inhabited by living organisms

    (c) A community of organisms together with the environment in which they live

    (d) The flora and fauna of a geographical area

  • Importance of elephant corridors in reducing conflict

    Importance of elephant corridors in reducing conflict

    Why in the News

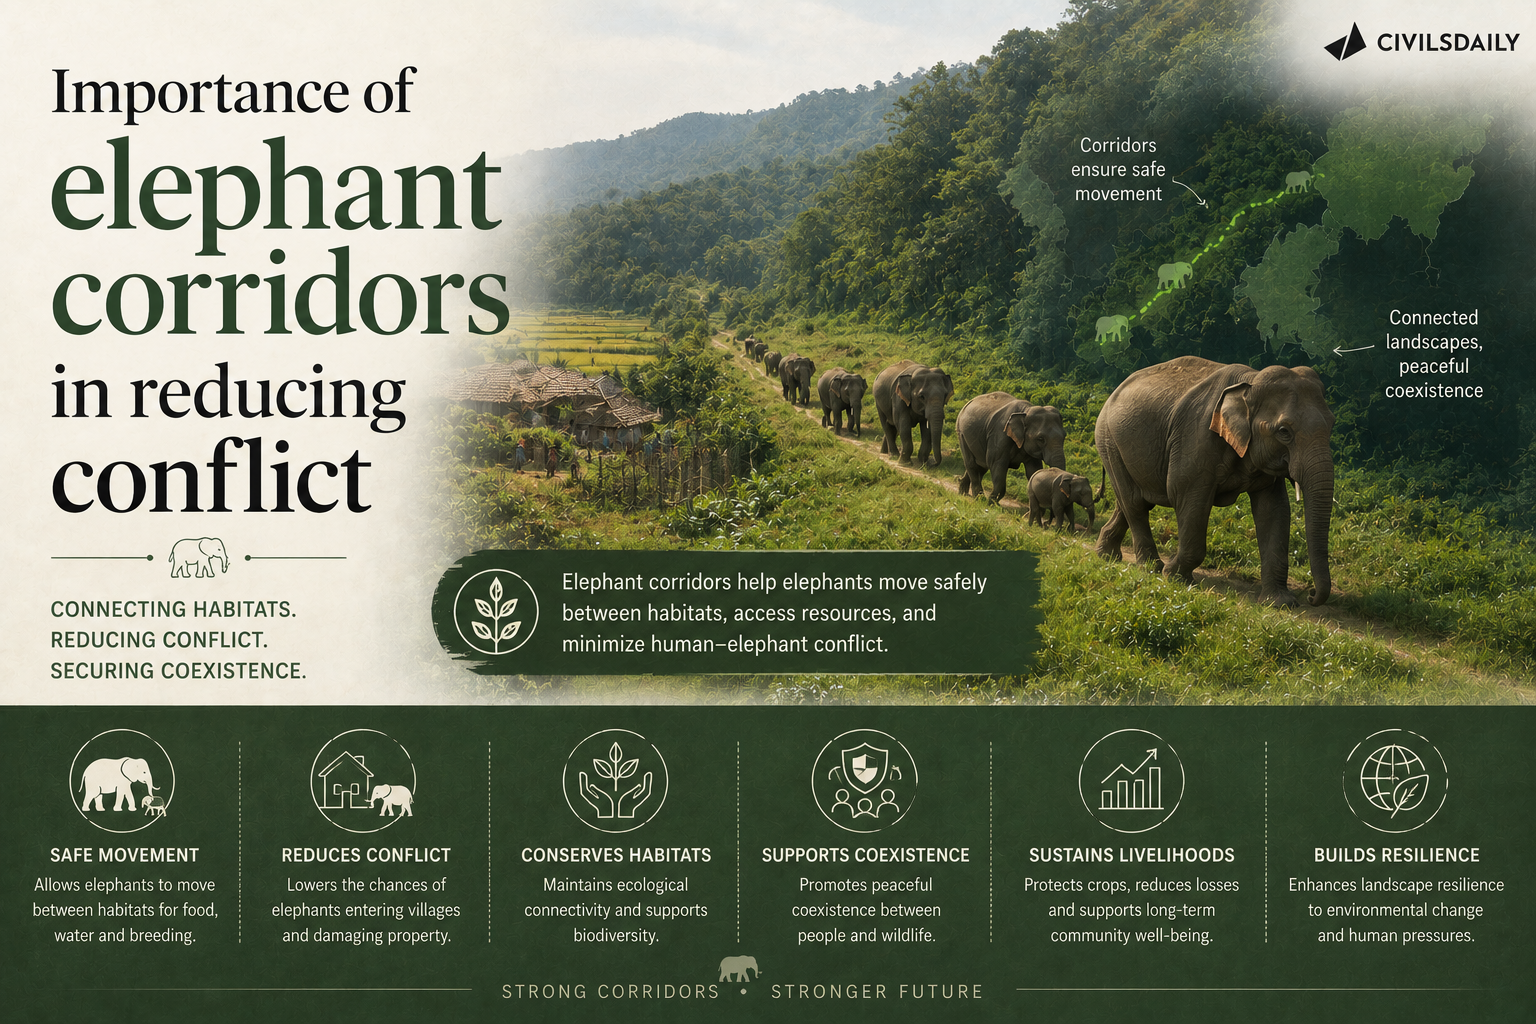
    A Supreme Court Bench led by the Chief Justice of India directed the Centre to conduct a fresh survey of elephant corridors. The Bench held that these corridors cannot be blocked out of a fear of crop damage, because elephant herds by nature travel long distances. The Bench was hearing a writ petition on managing human-elephant conflict, which had earlier sought to prevent the use of fireballs, spikes and similar materials to drive elephants away. In its order the Bench asked the Centre to indicate the steps taken to prohibit those methods and any other “coercive measure” used to divert the natural movement of elephants. The direction sets a conservation requirement against the immediate economic loss of farmers whose fields lie along those routes.

    What is an elephant corridor?

    1. Definition: An elephant corridor is a movement pathway connecting two natural habitats, allowing herds to pass between them without entering settled land.
    2. The mapped stock: The government’s last major mapping exercise, in 2023, documented 150 elephant corridors across 15 states.
    3. Why they carry legal weight: Disrupting a corridor both sparks human-elephant conflict and poses a direct threat to the animals, which is why blockage is treated as a conservation failure rather than a land use choice.

    Why do elephants need to move over long distances?

    1. They are highly mobile mammals: Asian elephants are highly mobile and social animals, and a male elephant’s average home range, the area it typically uses for food, water and shelter, extends between 50 and 300 sq km.
    2. Movement takes more than one form: Elephants move through their range in herds or individually, so a corridor must accommodate both group and solitary passage.
    3. Home ranges are not fixed: Ranges extend or contract depending on habitat type, food availability, water sources, population density and human disturbance.
    4. Movement is seasonal: Elephant movement is strongly influenced by the seasonal and spatial distribution of food, water and habitat.
    5. A documented seasonal pattern: Seasonal migrations into Kerala are common during the dry months, as elephants seek water and food in the relatively moist forests of the Western Ghats, according to a recent Environment Ministry report.
    6. Climate has driven movement historically: Climate change and drought have both played a role in forcing elephant migration.

    What does an intact corridor actually deliver?

    1. Genetic exchange: Corridors allow elephants genetic exchange or dispersal, which maintains diversity in their population pool and prevents isolated herds from inbreeding.
    2. Seasonal resource access: Well conserved corridors give elephants access to food and water in natural habitats during seasonal changes.
    3. Fewer crop encounters: That access is what prevents elephants entering crop lands, so the corridor is the mechanism that reduces the crop damage farmers fear.
    4. Reduced mortality: A functioning pathway removes the need for herds to cross highways, railway lines and settlements, which is where non natural elephant deaths occur.

    What is fragmenting the corridors?

    1. Infrastructure construction: The major issues in recent disruptions are infrastructure construction and industrial and mining activity along or across corridor routes.
    2. Linear infrastructure specifically: Highways, existing and new railway lines, canals and power lines push elephants towards farmlands and human settlements, triggering conflict.
    3. Land use change on the fringes: Changing land use, plantations and farmland fencing fragment habitat at its edges, which closes off the approaches to a corridor even where the corridor itself survives.
    4. Mining pressure drives displacement: Habitat loss and mining pressure have pushed elephants out of established ranges and into new ones over the past two decades.

    Where is the fragmentation worst?

    1. India has four principal elephant landscapes: These are the Western Ghats; the North-Eastern Hills and Brahmaputra floodplains; the Shivalik Hills and Gangetic plains; and Central India and the Eastern Ghats.
    2. Western Ghats: The habitat of the Western Ghats population is rapidly fragmenting owing to changing land use, plantations and farmland fencing, as noted in the last all-India elephant population estimation report released in 2025.
    3. Shivalik and Brahmaputra: The same report recorded similar disruptions in the Shivalik and Brahmaputra plains.
    4. Central India and Eastern Ghats: This landscape carries the biggest challenge, with Chhattisgarh receiving elephants arriving from Jharkhand and Odisha over two decades owing to habitat loss and mining pressures.
    5. The range is still expanding: Elephants have also expanded their range into parts of Madhya Pradesh and Maharashtra, creating conflict in states with no history of managing elephant populations.

    What has the Court asked the Centre to do?

    1. A fresh survey: The Centre must conduct a fresh survey of elephant corridors, which resets the 2023 mapping exercise as the operative baseline.
    2. Crop damage is not a ground for blockage: Corridors cannot be blocked out of a fear of crop damage, since elephant herds by nature travel long distances.
    3. An account of prohibition steps: The Centre must indicate the steps taken to prohibit the use of fireballs, spikes and similar materials to drive elephants away.
    4. A wider category of prohibited action: The order extends to any other “coercive measure” used to divert the natural movement of elephants, which covers methods the petition did not name.

    Challenges to protecting elephant corridors

    1. Corridors have no independent legal status: A mapped corridor is not a notified protected area, so land inside it can be diverted for a project without triggering the safeguards that apply to a sanctuary. Eg. The 150 corridors mapped in 2023 span forest, revenue and private land with differing tenure rules. Fix. Notify identified corridors as conservation reserves or ecologically sensitive areas so diversion requires the same clearance as protected area land.
    2. The mapping baseline is dated and voluntary: The last major mapping was completed in 2023 and carries no requirement that project appraisals check against it. Eg. The Court had to direct a fresh survey rather than rely on a periodic statutory exercise. Fix. Fix a statutory five year corridor survey cycle and make the corridor layer a mandatory input to environmental clearance appraisals.
    3. Linear projects are cleared one at a time: Each highway, railway line, canal and power line is assessed on its own merits, so the cumulative severance of a corridor never appears in any single appraisal. Eg. Elephant movement in Central India was reshaped by two decades of accumulated mining and infrastructure pressure rather than any one project. Fix. Mandate landscape level cumulative impact assessment for all linear infrastructure crossing a mapped corridor.
    4. Mitigation structures are built to the wrong specification: Underpasses and overpasses are often sized for smaller species and sited for engineering convenience rather than on observed elephant crossing points. Eg. Corridors carry herds as well as solitary bulls, whose passage needs differ. Fix. Tie animal passage design to radio collar and camera trap movement data for that specific corridor before construction is approved.
    5. Corridors cross state boundaries with no joint manager: Elephants moving between Jharkhand, Odisha and Chhattisgarh pass through three forest administrations with separate budgets and separate priorities. Eg. Chhattisgarh has absorbed elephants displaced from two neighbouring states over two decades. Fix. Constitute statutory inter-state elephant landscape authorities with a pooled budget and a single management plan for each of the four landscapes.
    6. Farmers carry the cost of a conservation decision: A ruling that a corridor cannot be blocked leaves the crop losses on the cultivator who farms beside it. Eg. Seasonal migration into Kerala during the dry months moves herds through cultivated valleys. Fix. Link corridor notification to guaranteed, time bound crop compensation through direct benefit transfer, so protection and compensation are notified together.

    Conclusion

    The Court has established that an elephant corridor is not negotiable against crop protection. The binding constraint is that the network was last mapped in 2023, while infrastructure, mining and land use change have continued to cut across it in all four elephant landscapes. The next step is the Centre’s response to the two directions recorded above, on the fresh survey and on prohibition.

    Back2Basics: The Asian Elephant

    1. Status: The Asian elephant is listed as Endangered on the IUCN Red List and is placed in Appendix I of the Convention on International Trade in Endangered Species of Wild Fauna and Flora (CITES).
    2. Domestic protection: It is listed in Schedule I of the Wildlife (Protection) Act, 1972, the highest level of protection available under Indian law.
    3. Range: India holds the largest wild population of the species, distributed across the four elephant landscapes covering the Western Ghats, the North East, the Shivaliks and Central India with the Eastern Ghats.

    “[2022] With reference to Indian laws about wildlife protection, consider the following statements :

    1. Wild animals are the sole property of the government.

    2. When a wild animal is declared protected, such animal is entitled for equal protection whether it is found in protected areas or outside.

    3. Apprehension of a protected wild animal becoming a danger to human life is sufficient ground for its capture or killing.

    Which of the statements given above is/are correct ?

    (a) 1 and 2

    (b) 2 only

    (c) 1 and 3

    (d) 3 only