💥Join UPSC 2027,2028 Mentorship (July Batch) + XFactor Notes & Microthemes PDF

Subject: Social Justice

  • Pathogens without payback: when sharing isn’t caring

    Why in the News?

    Negotiations on the Pathogen Access and Benefit Sharing (PABS) framework under the recent WHO Pandemic Agreement (May 2025) are set to begin again. This highlights a long-standing global inequity: countries that share pathogen data, mainly low- and middle-income countries (LMICs), continue to receive minimal benefits from vaccines and treatments developed using that data.

    What is PABS Framework?

    1. The Pathogen Access and Benefit-Sharing (PABS) System, established under Article 12 of the WHO Pandemic Agreement adopted in May 2025, is a global framework designed to ensure that the sharing of dangerous pathogens is matched by the equitable sharing of the vaccines and treatments derived from them. 
    2. While the core Agreement was adopted in 2025, the PABS Annex containing the specific operational rules is currently being finalized by an Intergovernmental Working Group (IGWG). The IGWG aims to conclude negotiations by May 2026 for presentation at the 79th World Health Assembly.

    Core Pillars of the PABS Framework

    The system operates on a “grand bargain” principle intended to rectify inequities seen during the COVID-19 pandemic: 

    1. Rapid Access: Member States commit to quickly sharing biological materials (pathogens) and their Digital Sequence Information (DSI) with the World Health Organization (WHO) and designated laboratory networks.
    2. Mandatory Benefit-Sharing: In exchange for this data, manufacturers using PABS materials must provide 20% of their real-time production of pandemic-related products (vaccines, diagnostics, etc.) to the WHO for global distribution.
      1. 10% as free donations.
      2. 10% at affordable, not-for-profit prices.

    Why do pathogen-sharing countries fail to receive proportional benefits?

    1. Structural Inequity: Low- and Middle-Income Countries (LMICs) share pathogen samples via WHO but lack binding guarantees for access to vaccines or diagnostics.
    2. Innovation Asymmetry: Developed countries control pharmaceutical R&D, enabling them to monopolize end products.
    3. Voluntary Framework Failure: Existing systems rely on goodwill rather than enforceable obligations.
    4. Example: During COVID-19, LMICs contributed samples but faced vaccine hoarding by high-income countries.

    How did COVID-19 expose failures in global health equity?

    1. Vaccine Apartheid: High-income countries hoarded vaccines; LMICs experienced prolonged shortages.
    2. Data Evidence: Africa received only 3-14% of global vaccine supply.
    3. COVAX Limitations: Delivered ~1/5th of WHO’s 2 billion dose target by mid-2021.
    4. Economic Impact: Delayed vaccination caused 1.3 million preventable deaths and $28 trillion global economic loss (IMF).
    5. Drug Inequality: Ebola drug Inmazeb cost ~$6,000 per treatment, unaffordable for poorer nations.

    What does the PABS framework aim to change structurally?

    1. Legal Linkage: Connects sample-sharing with mandatory benefit-sharing obligations.
    2. Access Mandate: Requires pharmaceutical companies to provide 20% of real-time production during pandemics.
    3. Pricing Mechanism: Ensures at least half of allocated doses are free and the rest at reasonable prices.
    4. Capacity Building: Includes provisions for technology transfer and licensing to expand production in LMICs.

    Why is there resistance from developed countries and industry?

    1. Innovation Concerns: Binding mandates may reduce incentives for private pharmaceutical investment.
    2. IP Protection: Firms resist compulsory sharing of intellectual property and technology.
    3. Bureaucratic Burden: Concerns that compliance mechanisms may delay research and innovation.
    4. Example: EU favors voluntary systems like Global Initiative on Sharing All Influenza Data (GISAID) over binding legal frameworks.

    What are the limitations of existing global mechanisms?

    1. Non-binding Agreements: Current frameworks lack enforcement provisions.
      1. Enforcement Void: Current WHO systems (like the PIP Framework) are limited in scope (mostly influenza) and lack the “teeth” to penalise a company that refuses to share its patents during a crisis.
    2. Fragmented Governance: Multiple overlapping systems reduce accountability.
    3. Technological Gaps: LMICs lack manufacturing capacity despite access to data.
    4. Example: WHO’s existing system ensures access to data but not equitable outcomes.
    5. The GISAID Paradox: While GISAID is excellent for surveillance, it provides zero guarantees for equity. A country can upload thousands of sequences to help track a variant but still be the last to receive the vaccine developed from that very data.

    Is there a viable middle path between equity and innovation?

    1. Tiered Obligations: Lower commitments during normal times, stronger during pandemics.
    2. Global Fund Mechanism: Supports LMIC manufacturing without overburdening companies.
    3. Incentive-based Sharing: Rewards companies that share IP rather than coercing compliance.
    4. Balanced Governance: Combines legal enforceability with flexibility in implementation timelines.

    What are the broader implications for global health security?

    1. Future Pandemic Preparedness: Ensures faster and equitable response mechanisms.
    2. Trust Deficit Reduction: Addresses Global South concerns about exploitation.
    3. Geopolitical Stability: Prevents vaccine nationalism and supply chain disruptions.
    4. Emerging Risks: Addresses threats like mpox, engineered pathogens, and AI-driven bio-risks.

    Conclusion

    The PABS debate reflects a deeper structural imbalance in global health governance where risks are shared but rewards are concentrated. Without enforceable equity mechanisms, future pandemics risk repeating COVID-19’s failures. A balanced framework combining legal mandates, incentives, and capacity-building is essential to ensure that global cooperation translates into equitable outcomes.

    PYQ Relevance

    [UPSC 2020] Critically examine the role of WHO in providing global health security during the Covid-19 pandemic.

    Linkage: The PYQ covers GS-II (International Institutions, Global Health Governance) by evaluating the effectiveness and limitations of WHO in managing pandemic response. It links to current issues like WHO Pandemic Agreement and PABS, highlighting the need for stronger enforcement, equity, and coordination in global health security.

  • Real equity gap in higher education

    Why in the News?

    The UGC (Promotion of Equity in Higher Education Institutions) Regulations, 2026 mark a significant policy intervention aimed at addressing discrimination in higher education. However, the debate has intensified because the regulations focus more on grievance redressal than structural inequality, particularly in employment and representation. In January 2026, the Supreme Court of India issued an interim stay on the UGC (Promotion of Equity in Higher Education Institutions) Regulations, 2026. The Court found the regulations, which aimed to address caste-based discrimination, too sweeping, vague, and potentially divisive.

    Why is equity in higher education more about employment than admissions?

    1. Reservation Fulfilment Gap: SC (15%), ST (7.5%), OBC (27%) quotas are closely met in admissions but underrepresented in faculty and non-teaching jobs.
      1. Employment Shortfall: In contrast, faculty positions in central universities show a massive backlog. As of 2023, nearly 30% of reserved teaching posts remained unfilled, with the crisis more acute at senior levels.
    2. Vertical Mobility Constraint: Representation declines at higher levels (PhD, faculty ranks), indicating structural barriers.
      1. “Not Found Suitable” (NFS) Classification: Selection committees frequently use the NFS tag to reject qualified SC/ST/OBC candidates. A 2022 study noted that approximately 60% of vacancies in reserved posts resulted from these discretionary rejections.
      2. The 13-Point Roster Overturned (2019): Following legal challenges in 2017/2018 that upheld the 13-point roster (treating individual departments as the unit), the government passed The Central Educational Institutions (Reservation in Teachers’ Cadre) Act, 2019. This act officially brought back the 200-point roster.
    3. Data Insight: Admissions ratios reach ~90% compliance, but employment remains significantly lower.
    4. Example: A 2023 report highlighted that while undergraduate and PG seats show higher inclusion, only a small fraction of professor positions are held by SC/ST/OBC candidates.

    What do available data reveal about discrimination and crime in HEIs?

    Data submitted by the University Grants Commission (UGC) to a parliamentary panel in 2026 shows a 118.4% surge in caste-based discrimination complaints over the last five years.

    1. Complaint Volume: 378 complaints (2023-24) reported across 704 universities and 1,553 colleges via Equal Opportunity Cells.
    2. Total Reach: Between 2019 and 2024, a total of 1,160 complaints were filed through Equal Opportunity Cells (EOCs) and SC/ST Cells across 704 universities and 1,553 colleges.
    3. Underreporting Issue: Approx. 3.7 cases per lakh students, suggesting significant underreporting.
    4. Pending Backlog: While the disposal rate is cited as ~90.6%, the number of pending cases actually rose from 18 to 108 in the same five-year period. 
    5. Crime Data Gap: NCRB records only external crimes, excluding intra-community or institutional discrimination.
    6. Extreme Outcomes: Reports indicate that over the past five years, approximately 100 students (mostly from Dalit, Adivasi, and OBC backgrounds) have committed suicide in elite institutions like IITs and IIMs due to harassment. 

    How reliable is the current data on caste-based discrimination?

    Current data on caste-based discrimination in India is widely considered under-representative and methodologically limited by both government and independent observers.

    1. Data Limitation: NCRB captures only crimes against SC/ST by non-SC/ST, ignoring intra-group violence.
    2. Comparative Gap (Disconnect Between “Resolution” and Justice): Lack of disaggregated data across all social groups limits comparative analysis.
      1. Lack of Autonomy: SC/ST Cells are often managed by university administration-nominated members, which can compromise their impartiality and lead to “reconciliations” that favor the institution over the victim. 
    3. Misleading Proportions: The National Crime Records Bureau (NCRB) is the primary source for crime statistics, but its framework excludes significant categories of caste-based harm. In many reports, approximately 74.8% of crimes are categorized under “Others” or General categories. This broad classification lacks the disaggregation needed to identify specific caste-based motives or trends across different social groups.
    4. The Underreporting Threshold:
      1. Statistical Invisibility: With only 3.7 cases per lakh students reported, the numbers are negligible compared to the total student population of over 4.3 crore.
      2. Fear of Retaliation: Experts note that many students “learn to remain silent” because reporting can lead to further institutional exclusion or career sabotage.

    What structural patterns emerge from crime and social behavior analysis?

    Analysis of social behavior reveals that crime is a byproduct of daily interaction. Because Indian society remains deeply siloed geographically and socially:

    1. Proximity Effect:
      1. Intra-community Prevalence: A crime is 3.2 times more likely to occur within the SC community and 14.3 times more likely within the ST community than it is to involve an external perpetrator.
      2. The Segregation Indicator: These high internal crime ratios are a mathematical “proxy” for segregation. They suggest that marginalized groups are so isolated that their primary social, economic, and physical contact is limited to their own community.
    2. Legal vs. Social Reality: The structural pattern shows that while legal safeguards (like the SC/ST Act) focus on protecting marginalized groups from “others,” they do not address the social friction caused by isolation:
      1. External vs. Internal: Official “caste-based crime” data only captures the friction at the border of these silos (inter-caste violence).
      2. The “Invisible” Conflict: The vast majority of conflict happens inside the silos, which the current legal framework is not designed to treat as a matter of “caste equity.”
    3. Interpretation: Indicates social segregation rather than harmony.
    4. Policy Implications: From Safeguards to Integration: The emergence of these patterns suggests that Equity 2.0 must move beyond just policing “atrocities”:
      1. Beyond Legalism: Relying solely on the SC/ST Act is insufficient because it doesn’t trigger unless the perpetrator is from a “higher” caste.
      2. Forced Integration: Real equity requires breaking the “proximity effect” through integrated housing, mixed-community classrooms, and shared social spaces.
      3. Institutional Shift: In HEIs, this means moving from “SC/ST Cells” (which can inadvertently reinforce segregation) to inclusive campuses that facilitate inter-group cooperation and reduce social distance.

    What are the key shortcomings of the UGC Equity Regulations, 2026?

    The UGC (Promotion of Equity in Higher Education Institutions) Regulations, 2026 face criticism for being fundamentally reactive rather than proactive. While they aim to modernize the 2012 framework, critics argue they suffer from a “punitive bias” that fails to address the underlying structural causes of inequality.

    1. The Anti-Discrimination vs. Equity Trap: Focuses on penalising discrimination, not ensuring equitable outcomes.
      1. It ignores the redistributive aspect of equity, such as providing extra resources, bridge courses, or financial support, which is necessary to level the playing field for first-generation learners
    2. Conceptual Confusion: Treats equity as equivalent to anti-discrimination, ignoring redistribution.
    3. Symbolic Infrastructure (The “Helpline” Problem): Provisions like the 24/7 Equity Helpline, Equity Squads, and Equity Ambassadors are often viewed as “optical” fixes.
    4. Unrealistic Assumption: Assumes elimination of identity-based crimes without reducing overall crime rates.
      1. The Blind Spot: It ignores the fact that overall crime rates and social friction on campuses are rising. Expecting caste-based incidents to vanish while the broader campus environment remains high-stress and competitive is seen as a policy disconnect.
    5. Risk Factor: May inadvertently reinforce social divisions through rigid identity frameworks.

    What policy measures can bridge the equity gap?

    1. Employment Representation: Enhances SC/ST/OBC presence in faculty and leadership roles.
      1. Targeted Recruitment Drives: Implementing mandated special recruitment drives to fill chronic backlog vacancies in reserved faculty positions.
      2. Unit-Based Accountability: Enforcing the university, rather than individual departments, as the primary unit for reservation rosters to prevent the mathematical exclusion of SC/ST/OBC candidates in smaller departments.
      3. Leadership Diversity: Actively increasing representation in senior administrative roles (Vice-Chancellors, Registrars) to ensure that decision-making bodies reflect diverse lived experiences
    2. Promoting Social Integration and Cohesion: To counter the “Proximity Effect” and social segregation, institutions must move beyond isolated support cells:
      1. Inclusive Environment: Promotes interaction across social groups to reduce segregation.
      2. Inclusive Pedagogy: Training faculty in culturally responsive teaching methods and inclusive language to deconstruct “color-blind” or caste-blind ideologies that ignore systemic disadvantages.
    3. Holistic Approach: Links crime reduction with social cohesion, not isolated legal action.
      1. Mediated Conflict Resolution: Implementing restorative justice practices that focus on repairing social harm rather than just checking bureaucratic “disposal” boxes.
      2. Supportive Ecosystems: Providing robust mental health services and academic support systems that specifically address the unique stressors faced by first-generation learners. 
    4. Institutional Reform: Strengthens data collection, transparency, and accountability.
    5. Cultural Change: Encourages mutual respect and discourages factionalism.

    Conclusion

    The equity debate in higher education has moved beyond access to deep structural inequalities in employment, representation, and institutional culture. Addressing this requires a shift from symbolic compliance to outcome-oriented reforms, integrating social justice with governance effectiveness.

    PYQ Relevance

    [UPSC 2023] Development and welfare schemes for the vulnerable, by its nature, are discriminatory in approach.’ Do you agree? Give reasons for your answer.

    Linkage: The PYQ covers reservation as a form of affirmative action in education, questioning whether it ensures real equity or remains limited to access. It directly links to the article’s argument that policy-based inclusion (like reservations) has not translated into proportional representation in higher education outcomes (jobs, faculty).

  • Disabled-Friendly Prisons — Supreme Court Directions (2026) 

    Why in the News?

    • The Supreme Court of India directed a high-powered committee to prepare a comprehensive plan for disabled-friendly prisons across India.
    • Issue highlighted: Inhumane conditions faced by disabled prisoners

    Key Supreme Court Observations

    • Rights of disabled prisoners must be protected under:
      • Article 14 → Equality before law
      • Article 21 → Right to life and dignity
    • Incarceration should not dilute fundamental rights

    Key Directions of the Court

    1. Comprehensive Action Plan

    • Create uniform standards across India

    2. Accessibility Measures

    • Provide:
      • Assistive devices
      • Mobility aids
      • Special infrastructure

    3. Medical & Social Support

    • Ensure:
      • Specialized medical care
      • Enhanced visitation rights

    4. Procurement & Maintenance

    • Define:
      • Procurement mechanisms
      • Maintenance protocols
      • Security safeguards

    5. Monitoring

    • Committee to submit report in: 4 months
    [2023] Q. Consider the following statements: 
    Statement-1: In India, prisons are managed State Governments with their own rules and regulations for the day-to-day administration of prisons. 
    Statement-II: In India, prisons are governed by the Prisons Act, 1894 which expressly kept the subject of prisons in the control of Provincial Governments. 
    Which one of the following is correct in respect of the above statements? 
    [A] Both Statement-I and Statement-II are correct and Statement-II is the correct explanation for Statement-1 
    [B] Both Statement-1 and Statement-II are correct and Statement-II is not the correct explanation for Statement-1 
    [C] Statement-1 1s correct but Statement-11 is incorrect 
    [D] Statement-1 Is incorrect but Statement-II is correct
  • [21st April 2026] The Hindu OpED: The puzzle of missing urgency around learning

    PYQ Relevance[UPSC 2023] The crucial aspect of the development process has been the inadequate attention paid to Human Resource Development in India. Suggest measures that can address this adequacy.
    Linkage: The PYQ directly links to the learning crisis and poor foundational literacy (FLN) as core human resource deficits affecting productivity. It highlights policy-outcome gaps and weak learning outcomes, aligning with issues of accountability, governance, and quality of education discussed in the article.

    Why in the News?

    Recent ASER findings continue to show that a significant proportion of Grade 5 students cannot read Grade 2 texts, despite flagship initiatives like NEP 2020 and NIPUN Bharat. This highlights a persistent learning crisis with low urgency and weak outcomes, even after increased policy focus and funding, making it a critical governance concern.

    What does the Annual Status of Education Report (ASER) data reveal?

    The Annual Status of Education Report (ASER) 2024 confirms your observation, showing that 51.2% of Grade 5 students still cannot read a basic Grade 2 level text, meaning only 48.8% possess this foundational skill. While this represents a modest recovery from 42.8% in 2022, it remains below the 50.5% recorded in 2018, highlighting a “learning crisis” that persists despite the NIPUN Bharat Mission and NEP 2020.

    Key Learning Deficits (ASER 2024)

    1. Reading Gaps: 76.6% of Grade 3 students cannot read Grade 2 text, indicating that many children fall behind early and never catch up.
    2. Arithmetic Stagnation: Only 30.7% of Grade 5 students can perform basic division, a skill typically expected by Grade 3 or 4.
    3. Long-term Deficits: Even by Grade 8, approximately 32.5% of students still struggle to read Grade 2 level texts.

    Why does a severe learning crisis fail to generate urgency?

    1. Salience Deficit (Low Visibility): Unlike building toilets or classrooms, learning deficits are invisible and intangible, making it easier for administrators to overlook them.
    2. Policy-Implementation Gap: NEP 2020 and NIPUN Bharat emphasize Foundational Literacy and Numeracy (FLN) but fail to translate into field-level urgency.
    3. Outcome Invisibility: Learning deficits remain intangible compared to visible infrastructure gaps like buildings or toilets.

    How does international experience highlight the importance of salience?

    1. Vietnam Model: Achieves high learning outcomes despite limited resources.
    2. RISE Programme Findings: Demonstrates that intent (“wanting to improve learning”) drives outcomes more than funding.
      1. Research on Improving Systems of Education (RISE): This is a large-scale, multi-country research programme aimed at understanding how education systems in developing countries can overcome the “learning crisis.”
    3. Comparative Insight: India’s weak field-level salience contrasts with Vietnam’s strong societal focus on learning.

    What structural factors weaken accountability in learning outcomes?

    1. Power Asymmetry: Teachers and administrators dominate decision-making; children and parents lack voice.
      1. Dominance of Professionals: Teachers and administrators frequently use their “professional status” as a barrier against parental feedback or perceived interference.
      2. Disenfranchisement of Vulnerable Groups: Parents from low socioeconomic backgrounds or with low educational attainment may feel they lack the language or skills to challenge school personnel.
      3. Lack of Downward Accountability: When power is concentrated at the top, the system excels at financial reporting (upward accountability) but often ignores the interests and needs of students.
    2. Centralization: Limited role of local institutions reduces bottom-up accountability.
      1. Limited Local Role: Local institutions often have little authority to adapt curriculum or management to fit specific student needs.
      2. Slow Responsiveness: Decisions made by distant central authorities can be slow to reach the ground level, especially in emergencies or urgent local situations.
      3. Reduced Bottom-Up Pressure: Without effective decentralization, there is less incentive for local stakeholders to demand better outcomes, as they lack the power to implement changes.
    3. Middle-Class Exit: For a “self-serving middle class” that has secured its own children’s education in private institutions, the quality of government schools often becomes a low-priority, non-marketable issue.
    4. Institutional Weakness: Local governance bodies, such as School Management Committees (SMCs), are often designed to oversee schools but face significant operational hurdles.
      1. Lack of Awareness and Training: Members often lack the necessary training or awareness of their roles and powers to effectively hold school administrations accountable.

    Why is the scale of the crisis under-recognized?

    The scale of the learning crisis often remains hidden because it is a “silent” emergency. Unlike a crumbling bridge or a food shortage, a child sitting in a classroom who cannot read is not immediately visible to the naked eye.

    1. Perception Gap: Even officials underestimate the extent of poor learning.
    2. ASER Data: Shows significant proportion of children lacking basic reading ability.
    3. The “Illusion of Improvement“: Statistical gains can mask the remaining deficit. For example, if reading levels improve from 20% to 65%, the focus is usually on the 45% gain. However, this hides the alarming reality that 35% of children, more than one in three, are still being left behind with no basic literacy.
    4. Cognitive Bias: Learning deficits appear exaggerated due to lack of direct visibility.

    How do systemic and sociocultural factors distort responsibility for learning?

    1. State as a Provider of “Schooling“: Governments often view their responsibility as fulfilled once inputs, such as buildings, teachers, and textbooks, are provided.
    2. Learning as a “Child Property”: When students fail to learn, it is often framed as a deficit within the child (e.g., lack of “natural ability” or “weak students”) or their background, rather than a failure of the teaching process.
    3. Neglect of Systemic Factors: Pedagogy, curriculum design, teacher support overlooked.
      1. Pedagogical and Curricular Mismatch: Many systems utilize a “one-size-fits-all” curriculum that is too fast-paced for the average student, yet responsibility for this “over-ambitious” design is rarely addressed.
    4. Political Economy Constraints: Acknowledging crisis carries political risk.
      1. Resource Misallocation: Predatory elites may use education systems for patronage (e.g., job distribution) rather than for improving learning outcomes, as maintaining the status quo is often safer than disruptive reform. 
    5. Professional Resistance: Educators reluctant to accept systemic failure.
      1. “Survival Mode”: Teachers burdened by high pupil-teacher ratios or excessive administrative tasks often prioritize basic compliance over the complex, discretionary work required to improve actual learning.

    What role does visibility and measurement play in improving learning outcomes?

    1. Assessment Systems: Large-scale assessments bring learning outcomes into policy discourse.
    2. Local Evaluations: Village-level assessments make learning deficits visible.
    3. Behavioral Impact: Direct observation creates urgency among parents and officials.
    4. Evidence-Based Reform: Data-driven approaches strengthen accountability.

    What strategies can build salience and improve foundational learning?

    1. Teaching at the Right Level (TaRL): Aligns teaching with student ability.
    2. Structured Pedagogy: Standardizes teaching methods for measurable outcomes.
    3. Outcome Communication: Public dissemination of learning data.
    4. Administrative Incentives: Links performance to learning outcomes.
    5. Decentralization: Empowers local governance for accountability.

    Conclusion

    India’s learning crisis is not due to lack of policy or funding but due to lack of urgency and accountability. Making learning visible, measurable, and socially prioritized is essential for systemic reform.

  • [20th April 2026] The Hindu OpED: Differentiating welfare and development

    PYQ Relevance[UPSC 2023] “Development and welfare schemes for the vulnerable, by its nature, are discriminatory in approach.” Do you agree? Give reasons for your answer.
    Linkage: The PYQ targets GS-2 (Social Justice) and tests understanding of welfare vs development, equity vs equality, and policy design for vulnerable groups. It links directly to Capability Approach, justifies “discrimination” as equity-driven targeting to expand real freedoms and reduce capability deprivation.

    Mentor’s Comment

    There is rising competitive populism across Indian states, where free electricity, loan waivers, and cash transfers are increasingly shaping electoral outcomes. This marks a sharp shift from earlier development-led narratives focused on infrastructure and growth. The concern is significant because such policies risk straining public finances while failing to build long-term economic capacity. The debate is critical as India aims for sustained high growth while managing inequality and welfare demands.

    What is Welfare and Development with respect to political landscape in India?

    Welfare in the Political Landscape: Welfare involves state intervention to ensure the economic and social well-being of citizens, particularly the vulnerable. It is about redistribution and social security. 

    1. Scholarly Definition: A welfare state is a government that takes “key role in the protection and promotion of economic and social well-being of its citizens,” based on “equality of opportunity” and “equitable distribution of wealth“. According to T.H. Marshall (1950), it is a synthesis of democracy, welfare, and capitalism.

    Indian Context & Examples:

    1. Food Security: The Targeted Public Distribution System (TPDS) and the National Food Security Act, 2013, supply subsidized food grains to low-income families.
    2. Employment Guarantee: The MGNREGA provides a legal right to 100 days of wage employment in rural areas.
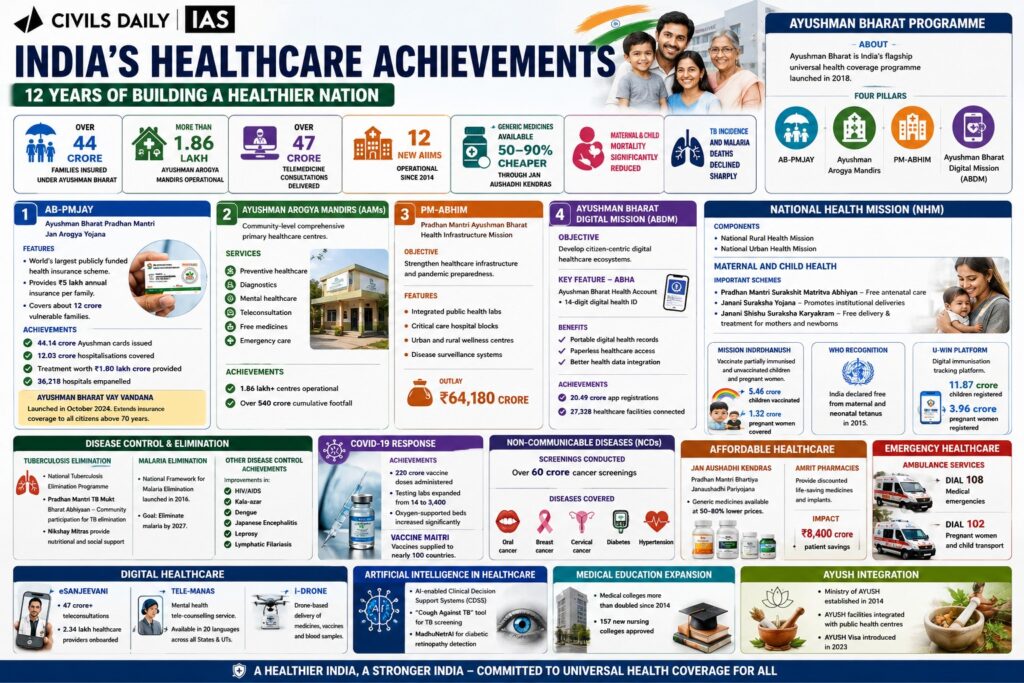
    3. Health Security: Free or subsidized health insurance programs (like the Ayushman Bharat scheme).
    4. Social Safety Net: Old age pensions and subsidies for cooking fuel (Ujjwala Yojana). 

    Development in the Political Landscape

    Development denotes a broader, long-term process of structural transformation involving sustained economic growth, improved productivity, and expanded human capabilities. 

    1. Scholarly Definition: Development is “the process of growth, or changing from one condition to another,” which aims to “improve the quality of life” through infrastructure, education, and modern technologies. It is a process that “expands human capabilities and freedoms,” shifting the focus from just GDP growth to human-centric improvements.

    Indian Context & Examples:

    1. Infrastructure: The construction of national highways, metro rail networks in cities, and rural road connectivity.
    2. Financial Inclusion & Technology: The implementation of Aadhaar and the JAN-DHAN accounts to facilitate direct benefit transfers.
    3. Digital Transformation: Schemes promoting internet connectivity in villages and digitalization of government services.
    4. Education: The National Education Policy (NEP) 2020 aiming for universal access and improved learning outcomes. 

    Why is there a conceptual confusion between welfare and development?

    Conceptual confusion between welfare and development persists because, while they differ fundamentally in purpose and time horizon, they are often conflated in political, academic, and practical settings, especially in democratic contexts. 

    1. Political Conflation (Populism vs. Growth): Political actors often blur the distinction to achieve immediate electoral gains.
      1. Narrative Shift: “Development” is frequently used as a slogan to signal structural growth, but it is often replaced in practice by welfare schemes that offer immediate, tangible benefits to voters.
      2. Patron-Client Politics: Welfare schemes (e.g., cash transfers, subsidies) are often designed as “freebies” that create a patron-client relationship, where voters view the government as a benefactor rather than an agent of structural transformation.
      3. Thin Line Between Freebies and Growth: Political campaigns, particularly in India (e.g., in Andhra Pradesh or West Bengal), often promise high-end infrastructure (development) alongside extensive subsidies (welfare), treating them as the same goal
    2. Overlap in Practice: In policy implementation, the boundaries between the two are frequently blurred.
      1. Simultaneous Implementation: Governments often run large-scale social protection programs alongside aggressive infrastructure development, making them difficult for the public to differentiate.
      2. Developmental Welfare: Certain welfare schemes can serve a development purpose. For instance, nutrition support (welfare) or job guarantees (MGNREGA) can build human capital or community assets (development), making it hard to classify them strictly as one or the other.
      3. The “Dependent” Trap: When welfare focuses purely on consumption (handouts) rather than capacity building, it can lead to “dependency,” where beneficiaries lack the motivation or skills to become independent, thus hindering long-term development. 
    3. Time Horizon Difference: Welfare operates in short-term consumption space, while development unfolds over decades through structural change.
      1. Short-Term vs. Long-Term: Welfare operates in the immediate consumption space (e.g., food security, basic income), aiming to alleviate immediate poverty. Development unfolds over decades through structural change, increased productivity, and enhanced human capabilities.
      2. Consumption vs. Production: Welfare is often about distributing existing resources (redistribution), while development focuses on expanding the total “economic pie” through investment and infrastructure. 

    In summary, the confusion arises when populist, short-term welfare promises are packaged and marketed as long-term development strategies. This creates a scenario where immediate social protection is mistaken for structural economic transformation.

    How do welfare and development differ in objectives and outcomes?

    1. Welfare Orientation: Ensures immediate relief through redistribution; includes food security, income support, and access to basic services.
    2. Development Orientation: Ensures sustained economic growth, productivity, and institutional strengthening over time.
    3. Outcome Nature: Welfare produces short-term consumption gains; development generates durable capacity expansion.
    4. Capability Enhancement: Welfare reduces vulnerability; development expands human capabilities (education, health, skills).

    Why can excessive welfare distort development outcomes?

    1. Fiscal Constraints: Expands subsidy burden, limiting capital expenditure on infrastructure and public goods.
      1. In India, several states have seen their fiscal space shrink, with committed expenditures (salaries, pensions, interest, and subsidies) consuming over 80% of revenue receipts, leaving very little for developmental capital spending. In 2021-22, Punjab spent over 25% of its revenue expenditure on explicit subsidies
    2. Crowding Out Effect: Reduces investment in productive sectors due to excessive redistribution.
      1. Example: If the government heavily funds food or energy subsidies (e.g., agricultural electricity subsidies), it crowds out private investment in more efficient, technology-driven sectors. 
    3. Incentive Distortion: Weakens work incentives and productivity if poorly designed.
      1. Example: The PM-Kisan scheme in India costs over ₹63,500 crore annually. Critics argue it acts as a “sop” that keeps people in low-productivity subsistence farming rather than encouraging the structural transformation of labor towards higher-productivity urban sectors
    4. Leakages and Exclusion: Poor targeting leads to inefficiencies and reduced impact.
      1. Example: Studies on Public Distribution Systems (PDS) in India have historically shown significant leakages (sometimes up to 30% or more), where subsidized grains intended for the poor are diverted to the open market. Similarly, free electricity often disproportionately benefits wealthier farmers who have land and pump sets, rather than landless laborers. 

    Why is development inherently a long-term structural process?

    1. Incremental Transformation: Involves gradual changes in economic structures, governance, and institutions.
    2. Institutional Capacity: Strengthens rules, norms, and administrative systems over time.
    3. Human Capital Formation: Requires sustained investments in education, health, and technology adoption.
    4. Capability Approach: Expands freedoms and opportunities, as emphasized in development theory.
    Capability ApproachDefinition: Defines development as expansion of human freedoms and choices, not just income growth.Focus: Prioritises capabilities (real opportunities) over mere resources.Key Concepts:Capabilities vs Functionings:Capabilities: Potential opportunities (e.g., ability to be educated)Functionings: Achieved outcomes (e.g., being educated)Beyond GDP: Measures development through quality of life and choices, not just economic output.Conversion Factors: Recognises variation in how individuals convert resources into outcomes due to social, personal, environmental factorsCore Pillars:Human Agency: Individuals as active agents, not passive beneficiariesEquity: Equal access to opportunitiesFreedom Expansion: Removal of constraints (poverty, ill-health, exclusion)

    What are the dangers of welfare populism?

    1. Short-Termism: Prioritises electoral gains over economic capacity building.
    2. Fiscal Stress: Leads to unsustainable public debt and deficits.
    3. Consumption Bias: Encourages immediate consumption instead of productive investment.
    4. Substitution Effect: Replaces development policies with populist transfers rather than complementing them.

    Can welfare and development be complementary?

    1. Well-Designed Welfare: Enhances human capital; e.g., nutrition, employment guarantees.
    2. Capability Enhancement: Supports productivity by reducing vulnerability.
    3. Inclusive Growth: Ensures that growth benefits are widely shared.
    4. Policy Integration: Aligns welfare schemes with long-term development goals.

    Conclusion

    The policy challenge lies not in choosing between welfare and development but in designing a coherent framework where welfare complements structural transformation. Sustainable development requires balancing immediate relief with long-term capacity creation.

  • NREGS Wage Hike Halted Amid Transition to G-RAM-G  

    Why in the News?

    • The Central Government has not revised wages under MGNREGS for FY 2026–27.
    • This is due to the upcoming rollout of a new scheme: Viksit Bharat–Guarantee for Rozgar and Ajeevika Mission (Gramin) (VB-GRAMG).

    Key Highlights

    • Over 11 crore active workers under MGNREGS
    • Around 7.2 crore individuals (5.34 crore families) benefited in 2025–26
    • For the first time in over a decade, wage revision not announced in Feb–March
    • Existing wages of 2025–26 will continue temporarily

    About MGNREGS

    • Full form: Mahatma Gandhi National Rural Employment Guarantee Scheme
    • Launched under:
      • MGNREGA Act, 2005
    • Objective:
      • Provide 100 days of guaranteed wage employment to rural households
    • Nature:
      • Demand-driven scheme
      • Legal right to work

    Wage Fixation under MGNREGS

    • Wages notified under: Section 6(1) of MGNREGA, 2005
    • Revised annually based on: CPI-AL (Consumer Price Index for Agricultural Labourers)
    • Usually effective from: April 1 of each financial year

    What is VB-GRAMG (New Scheme)

    • Full form: Viksit Bharat–Guarantee for Rozgar and Ajeevika Mission (Gramin)
    • Enacted through: VB-GRAMG Act, 2025
    • Aim:
      • Replace MGNREGA
      • Provide rural employment and livelihood support
    [2011] Among the following who are eligible to benefit from the “Mahatma Gandhi National Rural Employment Guarantee Act”? (a) Adult members of only the scheduled caste and scheduled tribe households (b) Adult members of below poverty line (BPL) households (c) Adult members of households of all backward communities (d) Adult members of any household
  • [11th April 2026] The Hindu OpED: An alternative to Viksit Bharat Shiksha Adhisthan Bill

    PYQ Relevance[UPSC 2020] National Education Policy 2020 is in conformity with the Sustainable Development Goal-4 (2030). It intends to restructure and reorient the education system in India. Critically examine.Linkage: This PYQ is directly relevant as VBSA operationalises the regulatory vision of NEP 2020, especially restructuring governance and institutional architecture. It helps analyse whether such reforms balance quality enhancement with autonomy, equity, and federal principles, as demanded in the PYQ.

    Mentor’s Comment

    The Viksit Bharat Shiksha Adhisthan (VBSA) Bill aims to streamline higher education through a standardised regulatory framework aligned with National Education Policy (NEP) 2020, improving quality and accountability. However, concerns remain about centralisation, institutional autonomy, and federal balance, requiring a calibrated approach that combines uniform standards with flexibility and stakeholder participation.

    What is the aim of the VBSA Bill?

    1. The Viksit Bharat Shiksha Adhishthan Bill, 2025 was introduced in Lok Sabha on December 15, 2025.  
    2. The Bill seeks to establish a regulatory body for higher education. It will replace UGC, AICTE and NCTE with a single ‘Vikas Bharat Shiksha Pratishthan’ (VBSA) for higher education.
    3. This body will replace the following existing bodies:
      1. University Grants Commission (UGC)
      2. All India Council for Technical Education (AICTE)
      3. National Council for Teacher Education (NCTE).  
    4. The Bill repeals the three Acts providing for constituting these bodies.  
    5. The Bill exempts legal and medical education from its purview.  These will continue to be regulated under separate Acts.

    What are the key features of the VBSA Bill?

    1. Apex Regulatory Body: Establishes Viksit Bharat Shiksha Adhishthan (VBSA) as the central authority for higher education governance, replacing fragmented regulatory structures and ensuring system-wide coordination.
    2. Three-Tier Council Structure: Creates
      1. Regulatory Council: The common regulator for higher education
      2. Accreditation Council: Oversees quality assurance and accreditation processes
      3. Standards Council: Determines academic benchmarks and learning outcomes
    3. Strategic Policy Role: Assigns Viksit Bharat Shiksha Adhishthan functions such as
      1. Strategic Direction: Providing strategic direction for higher education and research
      2. Institutional Transformation: Developing a roadmap for transforming higher educational institutions (HEIs) into large multi-disciplinary education and research institutions
      3. Quality Enhancement: Suggesting schemes for improving quality of education.
    4. Separation from Funding Role: Removes grant allocation powers (earlier with UGC), ensuring no direct financial authority over HEIs.
    5. Composition of Councils: Each Council headed by a President with up to 14 members, including experts, Union nominee, inter-council nominees, and limited State representation on rotation.
    6. Appointment Mechanism (Councils): President and full-time members appointed by the President of India based on recommendations of a search committee comprising experts and Higher Education Secretary.
    7. Composition of the Commission: Includes Chairperson (honorary), Presidents of Councils, Higher Education Secretary, five experts, and two academicians from State HEIs.
    8. Appointment Mechanism (Commission): Chairperson and members appointed by the President of India on recommendations of the central government.
    9. Tenure and Service Conditions: Fixed tenure of 3 years (extendable), reappointment allowed; age limit of 70 years (except Chairperson); service conditions prescribed by central government.
    10. Penalties on HEIs: Enables monetary penalties (₹10-70 lakh), along with actions like autonomy revision, grant withholding, degree restrictions, and closure; ₹2 crore penalty for illegal establishment; provides adjudicatory mechanism.
    11. Appeals Framework: Provides for appeals against decisions of Commission and Councils before the central government. 

    Does the VBSA Bill undermine federal principles in higher education governance?

    1. Centralisation of Powers: Transfers authority over standards, accreditation, and regulation to Union-controlled bodies, exceeding coordination role under Entry 66 of the Union List under the Seventh Schedule of the Indian Constitution.
      1. Entry 66, Union List (Seventh Schedule): Coordination and determination of standards in institutions for higher education or research.
    2. Erosion of State Role: Limits State governments’ role in decision-making despite education being in the Concurrent List.
    3. Top-down Governance: Imposes uniform standards without accounting for regional diversity and institutional contexts.
    4. Absence of Consultation: Bypasses State governments in NEP implementation during COVID period.

    How does the Bill affect institutional autonomy and academic governance?

    1. Reduced Autonomy: Curtails decision-making powers of universities, IITs, IIMs, and Inter-University Centres.
    2. Bureaucratic Overreach: Assigns excessive control to administrative bodies over academic processes.
    3. Dilution of UGC Role: Weakens consultative and inspection-based functions mandated under UGC Act.
      1. Functional Replacement: Transfers core functions like regulation, accreditation, and standard-setting from UGC to separate Councils, reducing UGC’s relevance.
      2. Loss of Inspection Powers: Replaces UGC’s direct inspection-based oversight with third-party accreditation mechanisms, limiting its ability to assess institutions firsthand.
      3. Erosion of Advisory Role: Reduces consultative processes traditionally undertaken by UGC with universities, shifting to a more top-down regulatory approach.
      4. Removal of Funding Leverage: Eliminates grant-giving powers (a key UGC tool for enforcing compliance), weakening its influence over institutional behaviour.
      5. Fragmentation of Authority: Splits responsibilities across multiple bodies, undermining UGC’s role as a unified regulator and coordinator of higher education. 
    4. Exclusion of Stakeholders: Omits participation of faculty, students, and academic councils in governance processes.

    What are the limitations of the proposed regulatory architecture?

    1. Prescriptive Regulation: Promotes rigid, output-based frameworks (patents, rankings) over academic depth.
    2. Fragmented Councils: Creates multiple councils (regulation, accreditation, standards) without coordination clarity.
    3. Outsourced Accreditation: Delegates accreditation to third-party agencies, risking standard dilution.
    4. Centralised Standard Setting: Ignores sectoral diversity across disciplines and institutions.

    Does the funding and research framework address systemic inequities?

    1. NRF Limitations: National Research Foundation lacks State representation and integrated research support.
    2. Funding Centralisation: Shifts allocation authority from institutions to Ministry-controlled bodies.
    3. Neglect of State Institutions: Risks widening gap between Central and State universities.
    4. Absence of Equity Focus: No targeted provisions for SC/STs, OBCs, or regional disparities.

    How does the Bill impact social justice and inclusivity in education?

    1. Weak Affirmative Action: Lacks enforceable mechanisms for reservation and inclusion.
    2. Market-oriented Approach: Promotes privatisation and loan-based access to education.
    3. Cultural Homogenisation: Undermines multi-cultural character through centralised narratives (e.g., “Bhartiya Knowledge”).
    4. Inter-regional Inequity: Fails to address disparities across regions and institutions.

    What alternative governance framework is suggested?

    1. Shared Responsibility Model: Advocates Centre-State collaboration in decision-making.
    2. HEGC Formation: Proposes Higher Education Grants Council for transparent fund disbursal.
    3. Deliberative Councils: Recommends inclusion of States, academics, and stakeholders in governance.
    4. Decentralised Funding: Ensures equitable resource allocation to lagging institutions.
    5. Outcome + Process Balance: Combines qualitative academic evaluation with measurable outputs. 

    Conclusion

    The VBSA Bill represents a structural shift toward a more integrated and standardised higher education framework aligned with national goals. However, its effectiveness will depend on balancing regulatory coherence with institutional autonomy, and central oversight with federal participation. A calibrated approach that incorporates stakeholder consultation, academic freedom, and equity considerations will be essential to ensure sustainable and inclusive higher education reform.

  • Jiyo Parsi Scheme: Government Push to Arrest Declining Parsi Population

    Why in the News?

    The Ministry of Minority Affairs organised a Universal Parsi Registration Drive, resulting in around 300 new registrations on the Jiyo Parsi portal.

    About Jiyo Parsi Scheme

    • Launched: 2013–14
    • Type: Central Sector Scheme
    • Nodal Ministry: Ministry of Minority Affairs
    • Objective: Arrest declining population of Parsi community

    Why the Scheme Was Launched

    Parsi population in India:

    • 1941: ~1,14,000
    • 2011 Census: ~57,000
    • Continuous decline due to:
      • Low fertility rates
      • Late marriages
      • Ageing population

    Who are Parsis

    • Followers of Zoroastrianism
    • Migrated from Persia (Iran) to India
    • Mainly settled in: Mumbai and Gujarat 
    [2011] In India, if a religious sect/community is given “the status of a national minority”, what special advantages is it entitled to? 1 It can establish and administer exclusive educational institutions. 2 The President of India automatically nominates a representative of the community to Lok Sabha. 3 It can derive benefits from the Prime Minister’s 15-Point Programme. Select the correct answer using the code given below: (a) 1 only (b) 2 and 3 only (c) 1 and 3 only (d) 1, 2 and 3
  • Early screen use stunts vital social growth of children, experts warn

    Why in the News?

    Early screen exposure among children is emerging as a structural transformation in childhood itself, rather than merely a behavioural concern. The issue reflects a shift in parenting practices, learning environments, and socialization processes, intensified by post-pandemic digital dependence. The article highlights how excessive screen exposure during the critical developmental window (0-5 years) disrupts neurocognitive growth, weakens social skills, and creates patterns resembling behavioural addiction.

    How does early screen exposure disrupt the critical developmental window of childhood?

    1. Critical Developmental Window: Early years (0-5) shape brain architecture through neuroplasticity; disruption leads to long-term deficits.
    2. Neuroplasticity Impact: Brain wiring depends on sensory and social inputs; screen-based interaction provides limited stimulation.
    3. Foundational Skill Loss: Weakens language acquisition, emotional bonding, and behavioural learning during formative years.

    How does the displacement effect explain developmental deficits caused by screens?

    1. Displacement Effect: Screen time replaces essential developmental activities rather than adding new value.
    2. Reduced Physical Exploration: Limits crawling, touching, and environmental interaction; example: children engaging with screens instead of tactile play.
    3. Decline in Social Learning: Reduces imitation, observation, and conversational engagement with caregivers.

    What evidence establishes a link between screen exposure and mental health outcomes?

    1. Dose-Response Relationship: Higher screen usage leads to proportionately worse mental health outcomes.
    2. Longitudinal Evidence: Study tracking over 3 lakh children shows increased socio-emotional problems with rising screen exposure.
    3. High Usage Data: Adolescents spend ~8.5 hours daily on screens, indicating excessive exposure levels.
    4. Behavioural Addiction Patterns: Case study: children in Ghaziabad showed extreme distress when screens were withdrawn.
    5. Psychological Symptoms: Includes hallucinations, diminished attention, and emotional instability.

    How does excessive screen use affect socialization and interpersonal competence?

    1. Non-verbal Communication Loss: Reduces ability to interpret tone, facial expressions, and body language.
    2. Empathy Deficit: Weakens emotional understanding due to lack of real-world interaction.
    3. Social Capital Erosion: Limits development of interpersonal skills essential for relationships and cooperation.
    4. Silent Social Spaces: Observation: cafeterias and public spaces shifting from active interaction to isolated screen use.

    How has the transformation in parenting practices contributed to rising screen dependency?

    1. Digital Pacification: Screens used as tools to calm or distract children instead of active engagement.
    2. Convenience Parenting: Reduces effort required for physical or emotional interaction.
    3. Pandemic Acceleration: Lockdowns increased reliance on screens as primary engagement medium.
    4. Early Exposure Shift: Infants exposed to YouTube and digital content instead of traditional toys and interaction.

    What risks emerge from prolonged and unsupervised screen exposure in children?

    1. Addiction Risk: Continuous usage leads to dependency and withdrawal symptoms.
    2. Emotional Dysregulation: Reduces capacity to manage stress and emotions.
    3. Algorithmic Exposure Risk: Platforms expose children to inappropriate or harmful content without parental awareness.
    4. Isolation Effect: Decreases peer interaction, increasing loneliness and detachment.

    What measures can address the adverse developmental and social impacts of screen exposure?

    1. Time Regulation: Limits screen exposure, especially below 5 years.
    2. Supervised Access: Ensures content filtering and guided engagement.
    3. Experiential Learning Promotion: Encourages play-based, peer-based, and sensory learning.
    4. Parental Awareness: Promotes active parenting and reduced reliance on digital devices. 

    Conclusion

    Early screen exposure is reshaping childhood by disrupting critical developmental processes and socialization patterns. Excessive use, especially in early years, leads to cognitive, emotional, and social deficits. A balanced approach that limits screen time and prioritizes real-world interaction is essential to ensure healthy child development.

    PYQ Relevance

    [UPSC 2023] Child cuddling is now being replaced by mobile phones. Discuss its impact on the socialization of children.

    Linkage: This highlights changing patterns of primary socialization in family and the impact of digital technology on child development. It directly connects to screen exposure replacing human interaction, leading to deficits in emotional bonding, empathy, and social skills.

  • India Faces Challenge in Meeting 2030 Maternal Mortality Target

    Why in the News?

    A recent study published in The Lancet Obstetrics, Gynaecology and Women’s Health highlights that India may struggle to meet the SDG target of reducing Maternal Mortality Ratio (MMR) below 70 per 1 lakh live births by 2030.

    Key Findings of the Study

    India’s Progress in Maternal Mortality

    • 1990: 1.19 lakh maternal deaths
    • 2015: 36,900 deaths
    • 2023: 24,700 deaths

    Maternal Mortality Ratio (MMR):

    • 1990: 508 deaths per lakh live births
    • 2023: 116 deaths per lakh live births

    India has made significant progress, but rate of improvement has slowed.

    Global Scenario

    • Global maternal deaths (2023): 2.4 lakh
    • India accounts for ~10% of global maternal deaths
    • Out of 204 countries:
      • 100 countries achieved SDG target (<70 MMR)
      • 104 countries yet to achieve
    • Countries struggling like India: Democratic Republic of Congo, Ethiopia, Nigeria, and Pakistan

    India’s Position

    • India falls in MMR range: 100–140
      (SDG target: Below 70)
    • However, India remains among countries with largest improvement since 1990, along with: Bangladesh, Ethiopia, Morocco, Nepal, and Rwanda

    State-wise Disparity 

    States pulling India’s MMR down: Assam and Uttar Pradesh

    SRS Data:

    • India: 122 (2015-17) → 88 (2021-23)
    • Assam: 215 → 110
    • Uttar Pradesh: 197 → 141
    • Southern states are closer to achieving SDG target.
    [2023] Consider the following statements in relation to Janani Suraksha Yojna: 1 It is a safe motherhood intervention of the State Health Departments. 2 Its objective is to reduce maternal and neonatal mortality among poor pregnant women. 3 It aims to promote institutional delivery among poor pregnant women. 4 Its objective includes providing public health facilities to sick infants up to one year of age. How many of the statements given above are correct? (a) Only one (b) Only two (c) Only three (d) All four