💥Mains Ready By December. Smash Mains & Smash PYQ Admissions Open

Subject: Trade

  • How US is building a case for ‘transhipment crackdown’ and why India may be at risk

    Why in the News

    A United States government report titled The Great Transhipment Scam: Global Evasion and Economic Costs names over 40 countries in a claimed shadow transhipment network and places India, Mexico, Canada and the European Union in Tier 1. The classification arrives while an India United States trade deal is under negotiation. The tension is between a tariff enforcement category built to catch origin fraud and a manufacturing model that legitimately imports Chinese components for domestic value addition.

    What is transhipment in trade enforcement?

    1. About: Transhipment in this context means routing goods of one origin through a third country so they enter the destination market under the third country’s tariff treatment.
    2. Why it matters: Origin determines the tariff rate, so mislabelling origin converts a high tariff good into a low tariff one.
    3. The legitimate case: Goods that undergo substantial transformation in the third country acquire that country’s origin lawfully under rules of origin.
    4. The disputed boundary: The report’s methodology does not separate origin fraud from genuine domestic value addition, which is where India’s exposure arises.

    What does the report actually claim?

    1. Tier 1 classification: India, Mexico, Canada and the European Union are placed in the highest risk tier.
    2. Volume estimate: About $67 billion of United States bound goods are estimated to be transhipped from China through top hubs, named as Mexico, India and Vietnam.
    3. Revenue estimate: The estimated tariff revenue loss is about $28 billion.
    4. Cluster naming: The report labels the Pune, Gujarat and Chennai industrial corridor as a cluster of concern.
    5. Institutional source: The estimates come from the Office of Trade and Economic Analysis within the United States Commerce Department.

    Why is India exposed despite genuine manufacturing?

    1. Component dependence: Indian electronics assembly imports a large share of components from China, so import content is high even where assembly is real.
    2. Measurement problem: A high Chinese import share can be read either as origin fraud or as an early stage manufacturing base, and the report does not distinguish the two.
    3. Scheme linkage: Production Linked Incentive driven assembly expanded exports faster than the domestic component base grew, which widens the gap the report treats as suspicious.
    4. Corridor concentration: Export clusters concentrate assembly activity geographically, which makes them visible in trade data as hubs.

    What enforcement instruments follow from such a report?

    1. Section 301 action: The United States Trade Representative can open an investigation and impose tariffs on a trading partner’s practices under Section 301 of the Trade Act, 1974.
    2. Trade deal clause: A transhipment clause can be written into the pending India United States trade agreement, binding India to origin verification obligations.
    3. Legal context: Reciprocal tariffs imposed earlier were struck down by the United States Supreme Court, which pushes enforcement toward statutory routes that survive judicial review.
    4. Secondary tariff route: Separate legislation permitting tariffs of up to 100 per cent on major buyers of Russian oil provides an additional pressure point.

    What is the counter argument to the report’s framing?

    1. Value addition versus routing: A country that imports components, assembles and exports is performing manufacturing, not evasion, when the transformation meets the origin threshold.
    2. Rules of origin already exist: Preferential and non preferential rules of origin provide a legal test for substantial transformation, so a new category adds pressure rather than clarity.
    3. Negotiating leverage: Naming a partner in a public report ahead of a trade negotiation functions as leverage over the terms of that negotiation.
    4. Bilateral drift: The instrument bypasses the multilateral dispute settlement route, which has been non functional since the Appellate Body lost quorum.

    Challenges to India’s export position

    1. Origin verification capacity: Certifying substantial transformation at scale requires customs documentation India’s exporters are not uniformly equipped for. e.g. disputes over certificates of origin under the India ASEAN agreement.
    2. Component import dependence: Domestic value addition in electronics remains low even as export volumes rise. e.g. mobile handset exports growing faster than domestic component sourcing.
    3. Dispute settlement vacuum: The World Trade Organization Appellate Body has been non functional since 2019, removing the appeal route against unilateral measures. e.g. appeals filed into the void by multiple members since then.
    4. Tariff exposure concentration: The United States is India’s largest single export market, so a unilateral measure has outsized effect. e.g. the disruption to Indian shrimp and steel exports during earlier tariff rounds.
    5. Rules of origin complexity: Each trade agreement carries a different origin threshold, raising compliance cost for the same exporter. e.g. differing value addition thresholds under India’s agreements with Japan and ASEAN.
    6. Retaliation limits: India’s counter tariff capacity is small relative to the market it would be retaliating against. e.g. the limited effect of India’s 2019 retaliatory tariffs on United States agricultural goods.

    Conclusion

    The report converts a measurement ambiguity, high Chinese import content in Indian assembly, into an enforcement category, and that conversion is what puts India at risk rather than any finding of fraud. The remedy runs through demonstrable domestic value addition, not through contesting the label. The next milestone is whether a transhipment clause appears in the text of the India United States trade agreement.

    Back2Basics: Rules of Origin

    1. Rules of origin are the criteria used to determine the country of origin of a product for the purpose of applying tariffs and trade measures.
    2. Non preferential rules of origin apply for most favoured nation tariffs, anti dumping duties and trade statistics.
    3. Preferential rules of origin apply under free trade agreements and decide whether a good qualifies for concessional duty.
    4. Substantial transformation is the core test, applied through a change in tariff classification, a regional value content threshold, or a specified processing operation.
    5. India tightened enforcement through the Customs (Administration of Rules of Origin under Trade Agreements) Rules, 2020, which placed the burden of proof on the importer.

    Way Forward

    1. Raise domestic value addition thresholds: Tie incentive disbursement to verified local content rather than to export value alone.
    2. Build an origin audit trail: Create a digital component provenance record for export clusters so transformation can be evidenced rather than asserted.
    3. Negotiate the clause narrowly: Confine any transhipment clause in the trade agreement to documented origin fraud, not to import content share.
    4. Deepen component manufacturing: Extend incentives to sub assemblies and passive components, since the exposure originates in the missing component layer.
    5. Diversify export destinations: Reduce single market concentration through the concluded agreements with the United Kingdom and the European Free Trade Association bloc.

    Matching Previous Year Question

    “[2025, GS3, 10 marks] What are the challenges before the Indian economy when the world is moving away from free trade and multilateralism to protectionism and bilateralism? How can these challenges be met?”
  • The problem with India’s free trade agreement strategy

    India has embraced trade diplomacy, signing Free Trade Agreements with the UAE, Australia, Oman, the United Kingdom, the European Union and New Zealand, with more under negotiation. The record with Asian partners undercuts the assumption that these agreements automatically boost exports and integrate India into regional production networks. Trade with partners such as ASEAN has become import-driven, with deficits widening even as export shares erode.

    What is a Free Trade Agreement and Global Value Chain integration?

    1. Free Trade Agreement (FTA): An FTA is a pact between two or more countries that reduces or removes tariffs and other barriers on goods and services traded between them. It is meant to expand market access on both sides.
    2. Global Value Chain (GVC) integration: A Global Value Chain is a production network where different stages of making a product occur in different countries. Integration means a country supplies or assembles components within these cross-border networks rather than trading only finished goods.

    How has India’s trade balance shifted under Asian FTAs?

    1. Widening deficit with ASEAN: India’s trade deficit with the Association of Southeast Asian Nations (ASEAN) rose sharply from USD 10.4 billion in 2012 to USD 51.2 billion in 2025, driven by rapidly rising imports.
    2. Faster imports with Japan and South Korea: Imports grew much faster than exports with Japan and South Korea over the same period, deepening the imbalance.
    3. Surplus turned to deficit with Singapore: India’s trade surplus with Singapore turned into a deficit after the trade agreement, signalling weakening export competitiveness.
    4. Import-driven pattern: Trade with key FTA partners has become increasingly import-driven rather than export-led.

    Why have export shares eroded despite tariff preferences?

    1. Declining share in partners’ import baskets: India’s share of ASEAN’s import basket dropped from 3.42% to 1.71% between 2012 and 2025, and its share of Singapore’s imports fell from 2.27% to 1.71%.
    2. Losses in Korea and mixed Japan trend: India’s share in South Korea’s import basket declined from 1.33% to 1.02%, while its share in Japan’s imports showed mixed trends.
    3. Tariff cuts cannot offset weak capability: The inability to use tariff preferences shows that market access based on tariff elimination alone cannot compensate for weak domestic industrial capabilities, logistical inefficiencies and infrastructure constraints.

    Why does the case that FTAs drive GVC integration break down?

    1. GVC trade share has fallen: India’s GVC-related trade as a share of gross trade declined from 37.13% to 34.38%, showing weakening integration rather than deepening.
    2. Decline across most partners: GVC trade as a share of gross trade fell with South Korea, Japan, Indonesia, Thailand, Vietnam and Cambodia, rising only with Malaysia, Singapore and the Philippines.
    3. Access is not participation: FTAs may raise market access in some product categories, but their ability to build productive capabilities remains contested.

    What must change beyond signing more FTAs?

    1. Fix domestic capacity first: India’s trade challenge is not negotiating more FTAs but strengthening domestic productive capabilities and removing associated impediments.
    2. Link trade to industrial policy: FTA strategy should connect to an industrial-policy framework emphasising technological upgrading, strategic investment, supply-chain realignment and domestic value addition.
    3. Avoid asymmetric outcomes: Without industrial transformation, FTAs increase import penetration faster than export competitiveness, widening asymmetrical trade outcomes and structural vulnerabilities.

    Conclusion

    The core problem is that India’s FTAs have become instruments of import penetration rather than drivers of export growth or GVC integration, because tariff access cannot substitute for weak industrial capacity. The strategy must move beyond market access toward domestic industrial transformation, technological upgrading and value addition. Until domestic productive capabilities strengthen, additional agreements will deepen deficits rather than reverse them.

    Back2Basics

    1. Free Trade Agreement: A treaty that reduces or eliminates tariffs and trade barriers between member countries.
    2. ASEAN: Association of Southeast Asian Nations, a regional grouping of ten Southeast Asian countries; India signed an FTA in goods with ASEAN in 2009.
    3. Global Value Chain: A cross-border network in which successive stages of production are spread across multiple countries.
    4. Types of trade pacts: Preferential Trade Agreement, Free Trade Agreement, Comprehensive Economic Partnership Agreement and Comprehensive Economic Cooperation Agreement, differing by depth of liberalisation.
    5. Trade deficit: The amount by which a country’s imports exceed its exports.

    PYQ Relevance

    [UPSC 2018] Consider the following countries: 1. Australia 2. Canada 3. China 4. India 5. Japan 6. USA

    Which of the above are among the ‘free-trade partners’ of ASEAN?

    (a) 1, 2, 4 and 5 (b) 3, 4, 5 and 6 (c) 1, 3, 4 and 5 (d) 2, 3, 4 and 6

    Answer: (c)

  • NITI Aayog Trade Watch Quarterly (Q4 FY 2025-26)

    Why in News?

    NITI Aayog released the 8th edition of “Trade Watch Quarterly” (Jan-Mar 2026), highlighting India’s trade performance and focusing on the pharmaceutical sector.

    India’s Trade Performance

    • Total merchandise and services trade: $1.84 trillion in FY 2025-26 (↑5.4% YoY).
    • Exports: Grew by 4.2%.
    • Imports: Grew by 6.5%.
    • Services exports: Increased by 9.0%, maintaining a strong services surplus.
    • India remained the 8th largest services exporter in 2025.
    • Services exports recorded a CAGR of 10.3% (2015-2025), higher than the global average.

    Pharmaceutical Sector

    • Global pharmaceutical and API market estimated at $1.3 trillion (2025).
    • India’s pharmaceutical and API exports reached $35.8 billion.
    • India is a leading supplier of Generic medicines, Vaccines, and Essential therapeutics

    Challenges

    • Export basket remains concentrated in generic formulations and retail medicaments.
    • Limited presence in biologics, biosimilars, immunologicals, and advanced therapeutics.
    • Continued dependence on imported Active Pharmaceutical Ingredients (APIs) and intermediates, especially from China.

    Leading Pharmaceutical States

    • Telangana, Gujarat, and Maharashtra
    • These states lead in production, exports, and integration into global pharmaceutical value chains.

    Way Forward

    • Expand into high-value pharmaceutical segments.
    • Strengthen domestic API manufacturing.
    • Increase investments in R&D, technology, and skill development.
    • Improve regulatory efficiency and market access.

    Active Pharmaceutical Ingredient (API)

    • The biologically active component of a medicine responsible for its therapeutic effect.
    • APIs are combined with excipients to produce the final dosage form.

    Biologics

    • Medicines produced from living organisms or biological processes.
    • Examples include monoclonal antibodies, vaccines, and recombinant proteins.

    [2021] With reference to international trade of India, which of the following statements are correct:
    1.The Top 3 export destinations of India are – USA, UAE, China.
    2.The Top 3 exports from India include – Petroleum Products, Drug Formulations, Agricultural Products.
    3.Agricultural exports have consistently risen from 2016-17 to 2021-22.
    4.India’s merchandise exports are less than its merchandise imports.
    Select the correct code from the options given below:

    [A] 1 and 4

    [B] 1 and 3

    [C] 2 and 4

    [D] 1, 2, 3 and 4

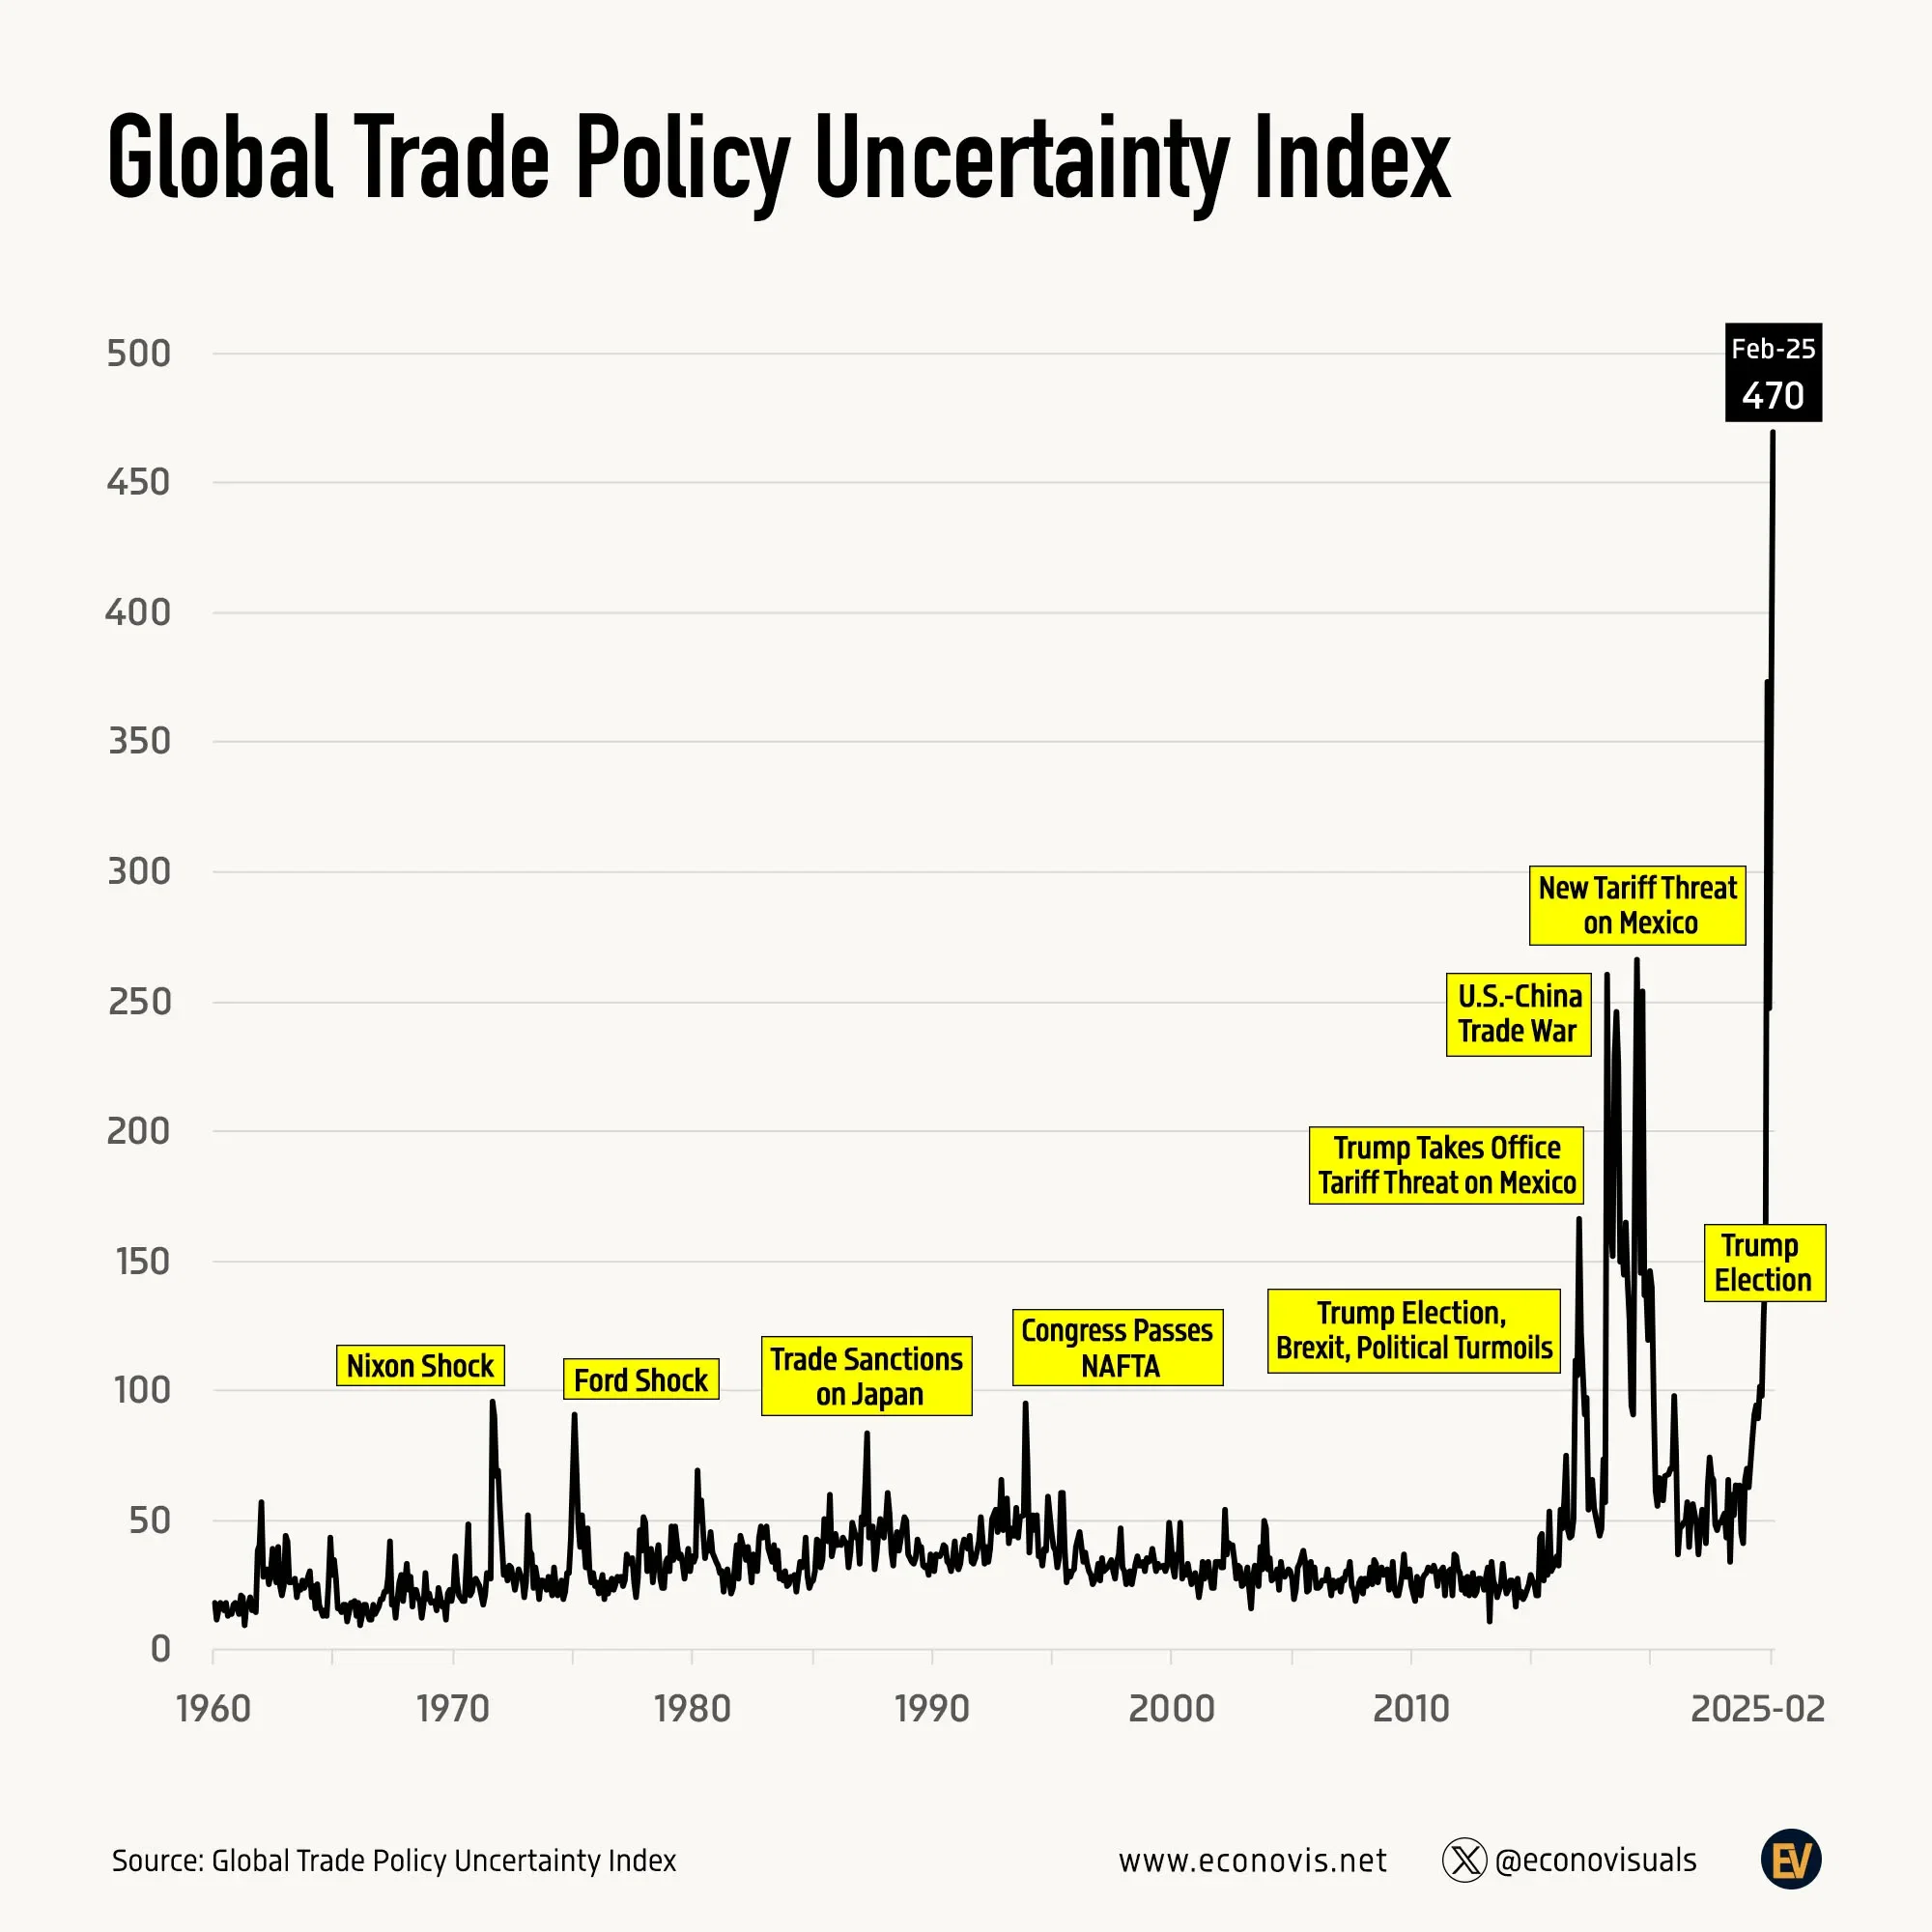
  • What are the challenges before the Indian economy when the world is moving away from free trade and multilateralism to protectionism and bilateralism? How can these challenges be met?

    According to the Economic Survey, the previous global paradigm of ‘stable geopolitics’ and ‘free trade and investment movement’, has been fading and the foundations on which many nations built themselves are now being shaken.

    World Moving from Free Trade & Multilateralism to Protectionism & Bilateralism

    Trade Wars – US-China tariff wars

    WTO Deadlock over Doha Development Agenda

    Rise of Bilateral/Regional Deals – Eg- RCEP

    Green Protectionism – EU’s Carbon Border Adjustment Mechanism (CBAM), US CHIPS Act

    Challenges before the Indian economy

    Fragmentation of Global Trade due to rise in tariffs, sanctions etc threaten export-oriented sectors. Eg- IT Industry

    Volatile Capital Flows

    Energy security challenges due to sanctions on Russia (40% share)

    Currency Depreciation

    Technology Barriers – New protectionist tools like data localisation rules of EU.

    Employment Impact – Labour-intensive sectors like textiles, gems, and automobiles face slowdown.

    Way Forward

    Internal Measures

    Ease of Doing Business – The Economic Survey (2024-25) key recommendation is ‘to get the domestic economic engine purring by pulling all the levers of deregulation’.

    Raising the investment rate to around 35% of GDP from the current level of ~ 31%.

    Boost domestic demand through high public capex

    Build resilience in semiconductors, defence, and critical minerals under Atmanirbhar Bharat.

    External Measures (Global Integration)

    Diversify Export Markets – Expand trade with Africa, Latin America, Central Asia, and ASEAN.

    Conclude Balanced FTAs – With EU, Canada, Australia.

    Strengthen IMEC, INSTC, and Chabahar Port for secure and cost-effective routes.

    Global South Leadership in WTO to revive dispute settlement and ensure fair rules.

    A self-sustained growth strategy is imperative for India’s long-term economic sovereignty.

  • Consider the following statements

    Consider the following statements:

    1.The quantity of imported edible oils is more than the domestic production of edible oils in the last five years.
    2.The Government does not impose any customs duty on all the imported edible oils as a special case.

    Which of the statements given above is/are correct?

  • Consider the following statements

    Consider the following statements:
    1. The value of Indo-Sri Lanka trade has consistently increased in the last decade.
    2. “Textile and textile articles” constitute an important item of trade between India and
    Bangladesh.
    3. In the last five years, Nepal has been the largest trading partner of India in South Asia.
    Which of the statements given above is/are correct?

  • Consider the following statements

    Consider the following statements:
    Statement-I: Switzerland is one of the leading exporters of gold in terms of value.
    Statement-II: Switzerland has the second largest gold reserves in the world.
    Which one of the following is correct in respect of the above statements?

  • Consider the following statements

    Consider the following statements:
    Statement-I:
    India accounts for 3.2% of global exports of goods.
    Statement-II:
    Many local companies and some foreign companies operating in India have taken advantage of India’s ‘Production-linked Incentive’ scheme.
    Which one of the following is correct in respect of the above statements?

  • Consider the following statements

    Consider the following statements:

    Statement-I: India does not import apples from the United States of America.

    Statement-II: In India, the law prohibits the import of Genetically Modified food without the approval of the competent authority.

    Which one of the following is correct in respect of the above statements?

  • Consider the following statements

    Consider the following statements:

    Statement-I: Recently, Venezuela has achieved a rapid recovery from its economic crisis and succeeded in preventing its people from fleeing/emigrating to other countries.

    Statement-II: Venezuela has the world’s largest oil reserves.

    Which one of the following is correct in respect of the above statements?