Why in the News
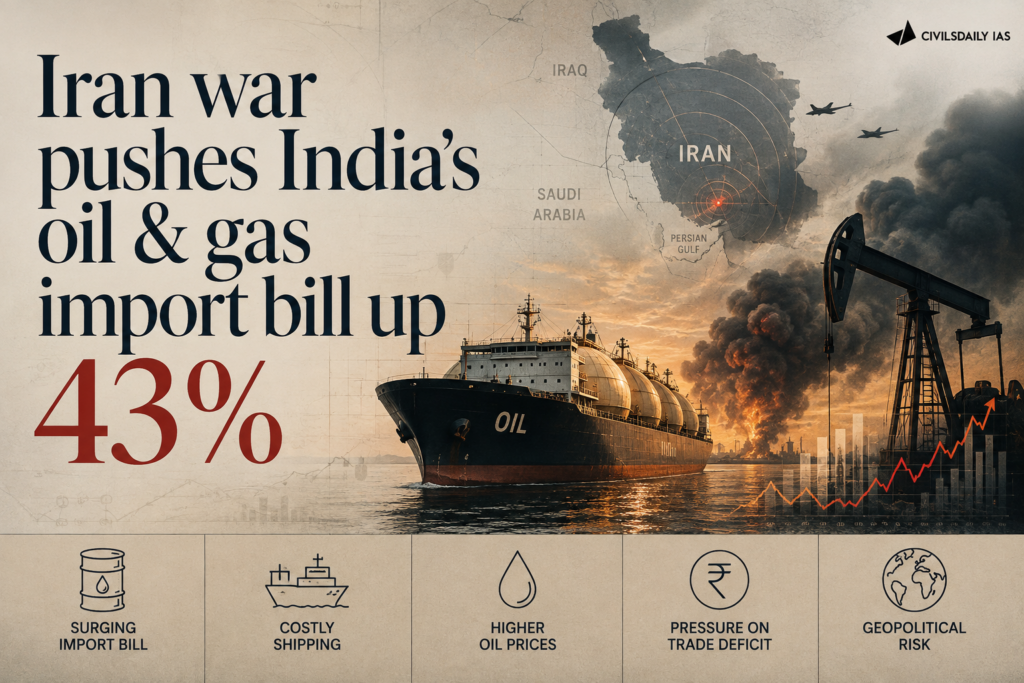
India’s net oil and gas imports rose 43.4 percent in value in April to July of the current financial year, to $57.8 billion from $40.3 billion a year earlier. Import volumes barely moved, so the increase is almost entirely a price effect created by supply tightness and stifled energy flows through the Strait of Hormuz. With 88.3 percent of crude requirement met by imports, India has prioritised supply security over price, and the cost of that choice lands on the trade balance.
What are net oil and gas imports?
- How the figure is built: Net oil and gas imports are arrived at by deducting petroleum product exports from oil, natural gas and petroleum product imports.
- Why the deduction matters: India is a net exporter of petroleum products because of its refining capacity, so gross import figures overstate the true external drain.
- What it still includes: India also imports some petroleum products, notably liquefied petroleum gas, so the netting does not remove product imports entirely.
- Why it is the tracked number: It measures the actual foreign exchange outgo on energy, which is what feeds into the trade balance and the current account.
What is the Petroleum Planning and Analysis Cell?
- What it is: The Petroleum Planning and Analysis Cell (PPAC) is the data and analysis body under the Ministry of Petroleum and Natural Gas. It compiles India’s official import, consumption, production and pricing statistics for petroleum and natural gas.
What is liquefied natural gas?
- What it is: Liquefied natural gas (LNG) is natural gas, primarily methane, cooled to minus 162 degrees C so that it becomes liquid and can be shipped in cryogenic carriers. It must be regasified at a terminal in the importing country before use.
- How it is priced: Spot LNG in Asia is priced against the Japan Korea Marker, with Henry Hub and the Title Transfer Facility serving the American and European markets.
What is liquefied petroleum gas?
- What it is: Liquefied petroleum gas (LPG) is propane and butane, produced as a byproduct of oil refining or natural gas processing, and used for domestic cooking, industrial heating and autogas.
- How it is priced: It is priced against the Saudi Aramco Contract Price, which is loosely linked to Brent crude.
Why did the import bill rise 43 percent when volumes barely moved?
- Volumes were nearly flat: Oil and LNG imports were only marginally higher in volume terms across April to July.
- Crude price did the work: The average landed price of imported crude was about $106 per barrel in April to July, sharply higher than about $68 per barrel in the corresponding period of last year.
- Value rose without volume: The crude oil import bill surged by over 56 percent year on year to $63.4 billion even as volumes rose only slightly, to 81.9 million tonnes or about 600 million barrels, from 81.5 million tonnes.
- The stated priority: India has been prioritising supply security over price considerations, so it imported at extremely high rates rather than curtail volumes.
- Product trade moved the same way: Petroleum product export volumes fell while export value rose, and product import volumes fell faster than product import value, both reflecting high international prices.
How did each component of the energy trade basket move?
- Crude oil imports, volume: 81.9 million tonnes against 81.5 million tonnes a year earlier, a rise of 0.5 percent.
- Crude oil imports, value: $63.4 billion against $40.5 billion, a rise of 56.5 percent.
- Petroleum product imports, volume: 9.0 million tonnes against 16.4 million tonnes, a fall of 45.1 percent.
- Petroleum product imports, value: $5.6 billion against $7.6 billion, a fall of 26.3 percent.
- LNG imports, volume: 11,867 million standard cubic metres against 11,269 million standard cubic metres, a rise of 5.3 percent.
- LNG imports, value: $5.6 billion against $4.5 billion, a rise of 24.4 percent.
- Petroleum product exports, volume: 16.5 million tonnes against 20.1 million tonnes, a fall of 17.9 percent.
- Petroleum product exports, value: $16.7 billion against $12.4 billion, a rise of 34.7 percent.
- Net oil and gas imports: $57.8 billion against $40.3 billion, a rise of 43.4 percent.
How exposed is India’s energy basket to the Strait of Hormuz?
- Crude dependence: India depends on imports to meet over 88 percent of its crude oil requirement, and its dependence on imported oil for the four months ended July was 88.3 percent, almost flat year on year.
- Gas dependence: About half of India’s natural gas consumption is met by imports, brought in as LNG.
- Share routed through the strait: Around 40 percent of India’s crude oil imports, 60 percent of its LNG imports and 90 percent of its LPG imports came from West Asia through the strait.
- Where the disruption showed: Petroleum product imports declined 45.1 percent in volume to 9.0 million tonnes because supply of major products India imports, such as LPG, was hit by the West Asia conflict.
- Why exports fell: India’s petroleum product export volumes fell almost 18 percent year on year to 16.5 million tonnes as domestic fuel supplies were prioritised amid the global supply crunch.
Why does an oil price shock transmit into the wider economy?
- The volume multiplier: India annually imports 1.8 to 2 billion barrels of oil, so every $1 per barrel increase raises the oil import bill by up to $2 billion on an annualised basis.
- Share of total imports: Energy imports are a major component of India’s overall imports, so any meaningful increase moves the aggregate import number.
- Trade balance and current account: A higher energy bill widens the merchandise trade deficit and feeds directly into the current account deficit.
- Inflation channel: Higher landed crude costs pass into transport and freight costs and into the prices of petroleum linked goods.
- Exchange rate channel: A larger dollar outgo on energy adds to demand for foreign exchange and weighs on the rupee’s exchange rate.
Challenges to managing India’s oil and gas import bill
- Demand is price inelastic in the short run: Refiners cannot cut crude intake without cutting fuel supply, so a price shock passes straight into the bill. Eg. Crude import volumes rose 0.5 percent even as the crude bill rose 56.5 percent in April to July.
- Concentration of LPG sourcing: A single region supplies almost the entire LPG import basket, leaving no substitute route in a disruption. Eg. The West Asian share of India’s LPG imports moves entirely through the Strait of Hormuz, with no second corridor available if the strait closes.
- Fixed rupee excise blocks pass through of relief: Central excise duty is levied as a fixed amount per litre rather than as a percentage, so falling crude prices accrue to revenue rather than to consumers. Eg. When Brent fell from $80 to $60 per barrel in early 2025, Delhi petrol fell by only about Rs 2 to 3 per litre.
- Strategic reserve cover below international norms: The buffer available to ride out a supply interruption is short of the accepted benchmark. Eg. India’s total crude cover of 74 days sits below the International Energy Agency norm of 90 days of net import cover.
- No strategic reserve for gas at all: The gas basket has an operational buffer but no strategic cushion. Eg. India’s LNG storage tanks at regasification terminals give roughly 10 days of operational buffer, with no strategic LNG reserve in existence.
- Spot LNG volatility deters utilisation: When spot prices spike, importers switch to coal or fuel oil, stranding regasification capacity. Eg. India’s roughly 42.5 million tonnes per annum of LNG regasification capacity runs at 60 to 65 percent utilisation because switching becomes rational above $15 per MMBtu.
- Refinery configuration ties India to sour crude sources: Indian refineries have invested in desulphurisation capacity built around Middle Eastern grades, which limits how fast the basket can be re-sourced. Eg. Most Middle Eastern crude India buys is priced against Dubai and Oman, and Saudi, Iraqi and UAE grades track that benchmark.
Conclusion
India’s net oil and gas import bill rose to $57.8 billion in April to July from $40.3 billion a year earlier, a 43.4 percent increase driven almost wholly by price rather than volume. At 88.3 percent crude import dependence and with the West Asian shares of crude, LNG and LPG all routed through the Strait of Hormuz, a chokepoint disruption converts directly into a macroeconomic shock. The figures are provisional data from the Petroleum Planning and Analysis Cell, and the next reading will show whether the price effect persists once Hormuz flows normalise.
About India’s Crude Oil Procurement and Pricing
- Who buys: State owned refiners account for 73 percent of India’s procurement through Indian Oil Corporation Limited, Bharat Petroleum Corporation Limited and Hindustan Petroleum Corporation Limited, with private refiners Reliance Industries and Nayara Energy accounting for 27 percent.
- How buying works: Each refiner independently forecasts demand two to three months ahead and negotiates bilaterally with suppliers such as Rosneft, Saudi Aramco and Iraq’s State Organisation for Marketing of Oil.
- How it is priced: All contracts are priced as Brent plus or minus a negotiated discount, and Middle Eastern grades track the Dubai and Oman benchmark.
- Where crude lands: Crude is received by tanker at Paradip, Mumbai, Kochi and Vadinar.
- Quality determines price: Sulphur content and American Petroleum Institute (API) gravity, the measure of a crude’s density, together determine refining cost and product yield, with sweet crude defined as sulphur content below 0.5 percent and sour crude requiring additional processing.
Regulatory Framework Governing India’s Petroleum and Natural Gas Sector
- Ministry of Petroleum and Natural Gas: The apex policy body, which sets the framework for exploration, refining, marketing, pricing and strategic reserves, awards production sharing contracts, and exercises ownership over the public sector oil companies.
- Petroleum and Natural Gas Regulatory Board: Regulates refining, processing, storage, transportation, distribution, marketing and sale of petroleum products and natural gas, authorises City Gas Distribution networks, and determines pipeline tariffs on a common carrier basis.
- Directorate General of Hydrocarbons: The technical regulator for upstream exploration and production, which manages block allocations, monitors production sharing contracts, verifies reserves, approves field development plans and maintains the National Data Repository.
- Oil Industry Development Board: Funded by a statutory cess on domestic crude production, it finances oil industry development and wholly owns Indian Strategic Petroleum Reserves Limited, which operates the underground reserve caverns.
- Deregulated retail pricing: Petrol was deregulated in 2010 and diesel in 2014, so the Ministry does not directly set retail pump prices.
Government Initiatives in the Petroleum and Gas Sector
- Strategic Petroleum Reserve: Phase I comprises 5.33 million tonnes of crude across three underground rock caverns at Visakhapatnam, Mangaluru and Padur, with a Phase II commercial cum strategic expansion under public private partnership models.
- Hydrocarbon Exploration and Licensing Policy, 2016: Replaced the earlier New Exploration Licensing Policy with a uniform licence covering all hydrocarbons, open acreage licensing and revenue sharing in place of production sharing.
- Administered Price Mechanism for domestic gas: The Ministry sets the administered price for domestic natural gas indexed monthly at 10 percent of the Indian Crude Basket price, following the Kirit Parikh Committee recommendations, subject to a floor and ceiling for legacy fields.
- Direct Benefit Transfer for LPG: LPG is subsidised through direct transfer, with Rs 300 per cylinder for Ujjwala beneficiaries.
- City Gas Distribution expansion: India’s city gas distribution network now covers 98 cities, supplying compressed natural gas for vehicles and piped natural gas for households from a mix of domestic gas and regasified LNG.
Key Facts about Global Oil Benchmarks and India’s Reserves
- Brent crude: North Sea origin, 38 API and 0.37 percent sulphur, traded on the Intercontinental Exchange in London, accounting for 75 to 80 percent of global oil trade and serving as the reference against which all other grades are a premium or discount.
- West Texas Intermediate: Cushing, Oklahoma origin, 39.6 API and 0.24 percent sulphur, traded on the New York Mercantile Exchange, accounting for 15 to 20 percent of global trade and typically Brent minus $0 to $5 per barrel.
- Dubai and Oman: Persian Gulf origin, 31 to 33 API and 1.0 to 2.0 percent sulphur, traded on the Dubai Mercantile Exchange, accounting for 5 to 10 percent of global trade and typically Brent minus $5 to $15 per barrel.
- Why OPEC does not set the price: OPEC controls 40 percent of production but Brent sets 75 to 80 percent of global prices, since markets price oil hundreds of thousands of times a day while OPEC announces targets once and has no enforcement mechanism against quota cheating.
- Reserve position: India’s total crude cover is 74 days, made up of 9.5 days from the Strategic Petroleum Reserve and 64.5 days of oil marketing company commercial stocks, against the International Energy Agency norm of 90 days.
- LPG and LNG cover: LPG cavern capacity of about 140,000 tonnes gives roughly 22 days of cover against consumption of about 3 million tonnes a month, while LNG has about 10 days of operational buffer and no strategic reserve.
- Volatility of spot gas: The Japan Korea Marker swung from $3 per MMBtu in mid 2020 to $70 per MMBtu in August 2022.
- Committee recommendation on storage: The Parliamentary Standing Committee on Petroleum in December 2023 recommended equipping refineries with two to three days of smaller strategic storage at five to six additional locations, which could add 15 to 20 days of capacity.
Back2Basics: Strait of Hormuz
- Location: A narrow sea passage connecting the Persian Gulf to the Gulf of Oman and onward to the Arabian Sea.
- Control: Iran controls the northern shore and seven of the eight islands in the strait, Oman controls the southern entrance, and the United States Fifth Fleet acts as the external guarantor of transit.
- Oil traffic: About 20 million barrels a day pass through it, amounting to 20 percent of global oil movement.
- Gas traffic: It carries 20 percent of global LNG trade, which makes closure hit gas hardest given Qatar’s dominance in LNG supply.
- Strategic character: It carries the highest concentration of energy flow of any maritime chokepoint in the world.
Challenges in India’s Energy Security
- Stagnant domestic crude production: Falling domestic output pushes import dependence upward regardless of demand. Eg. Cess collections of the Oil Industry Development Board have declined in real terms because domestic crude production has stagnated.
- Regulatory conflict of interest: The same ministry sets the pricing environment and owns the companies whose losses that environment creates. Eg. The Ministry of Petroleum and Natural Gas simultaneously regulates the sector and holds ownership rights over Indian Oil Corporation Limited, Bharat Petroleum Corporation Limited and Hindustan Petroleum Corporation Limited.
- Gaps in the regulatory perimeter: No single regulator covers the full chain from wellhead to pump. Eg. The Petroleum and Natural Gas Regulatory Board has no jurisdiction over upstream exploration, wellhead gas pricing or LPG retail pricing.
- Upstream reservoir disputes slow output: Technical disputes between operators delay field development and carry royalty implications. Eg. The gas migration dispute between ONGC and Reliance Industries in the Krishna Godavari basin required adjudication by the Directorate General of Hydrocarbons.
- Chokepoint concentration across all three fuels: Crude, LPG and LNG share the same maritime chokepoint, so diversification of supplier does not diversify route. Eg. LPG moves with crude tankers or on dedicated carriers through the same Strait of Hormuz.
- Tax structure blunts price signals: Taxes form roughly 60 percent of the retail pump price, weakening the link between global prices and consumer behaviour. Eg. Delhi petrol at Rs 96 to 97 per litre carried Rs 13 of central excise and Rs 15 to 18 of State value added tax before the crisis.
- Storage build out lags the exposure: Reserve expansion depends on capital and cavern geology, both of which take years. Eg. Phase II of the Strategic Petroleum Reserve is being pursued through public private partnership because budgetary funding alone has not delivered the capacity.
Way Forward
- Complete Phase II of the Strategic Petroleum Reserve: Bring the commercial cum strategic caverns on stream to move total cover towards the 90 day International Energy Agency norm.
- Adopt the refinery level storage recommendation: Implement the Parliamentary Standing Committee’s December 2023 proposal on refinery level storage, which remains a recommendation rather than sanctioned capacity.
- Create a strategic gas reserve: Extend the reserve architecture to LNG, which today has only an operational buffer at regasification terminals.
- Shift excise from a fixed levy to an ad valorem levy: This would let consumers receive part of the benefit when crude prices fall, restoring the price signal.
- Diversify sourcing away from a single chokepoint: Expand term contracts with Atlantic basin, West African and North American suppliers so that a Hormuz disruption does not strike crude, LNG and LPG supply simultaneously.
- Raise domestic production through open acreage: Accelerate block awards under the Hydrocarbon Exploration and Licensing Policy to arrest the decline in domestic output.
- Separate ownership from regulation: Move ownership of the public sector oil companies out of the administering ministry so that pricing policy is not set by their shareholder.
“[2025, GS2, 15] “Energy security constitutes the dominant kingpin of India’s foreign policy, and is linked with India’s overarching influence in Middle Eastern countries.” How would you integrate energy security with India’s foreign policy trajectories in the coming years?”