Captagon, the “poor man’s cocaine,” has become increasingly popular among young adults in the Middle East and North Africa.
What is the Drug Captagon?
Captagon is a synthetic drug that was originally developed in Germany in the 1960s and 1970s.
It was initially created as a pharmaceutical treatment for attention deficit disorders, narcolepsy, and sometimes depression.
The primary active ingredient in Captagon is fenethylline, a compound that, once ingested, is metabolized into two powerful stimulants: amphetamine and theophylline.
These substances stimulate the central nervous system, leading to increased alertness, reduced fatigue, and a sense of euphoria.
How Addictive is Captagon?
Captagon is highly addictive due to its powerful effects on the brain and body.
As a psychostimulant, Captagon significantly impacts the central nervous system, leading to a range of effects that can make it very difficult for users to stop taking the drug once they start.
It is also reportedly used byfighters in conflict zones to enhance their endurance and suppress fatigue.
The primary effects of Captagon include:
Euphoria: Users often experience an intense feeling of happiness or well-being.
Increased Wakefulness: The drug reduces the need for sleep, keeping users awake and alert for extended periods.
Enhanced Physical and Mental Performance: Users may feel stronger, more focused, and more capable of performing both physically and mentally demanding tasks.
However, the heavy use of Captagon comes with serious risks such as cognitive impairment, cardiovascular issues, and risk of addiction.
Where is Captagon Made?
In recent years, Syria the “narco state” of Middle East has emerged as the largest producer of Captagon.
Its production increased after 2011 Arab Spring protests, which led to civil unrest and conflict in the region.
PYQ:
[2019] Consider the following statements:
The United Nations Convention against Corruption (UNCAC) has a ‘Protocol against the Smuggling of Migrants by Land, Sea and Air’.
The UNCAC is the ever-first legally binding global anti-corruption instrument.
A highlight of the United Nations Convention against Transnational Organized Crime (UNTOC) is the inclusion of a specific chapter aimed at returning assets to their rightful owners from whom they had been taken illicitly.
The United Nations Office on Drugs and Crime (UNODC) is mandated by its member States to assist in the implementation of both UNCAC and UNTOC.
Which of the statements given above are correct?
(a) 1 and 3 only
(b) 2, 3 and 4 only
(c) 2 and 4 only
(d) 1, 2, 3 and 4
Researchers have isolated extremophile bacteria from harsh environments like volcanic vents, permafrost, acid mines, deep-sea hydrothermal vents, and lakes beneath polar ice caps.
What are Extremophiles?
Extremophiles are microorganisms that thrive in extreme environmental conditions where other life forms typically cannot survive.
For example: Volcanic vents, Permafrost, Acid mines, Deep-sea hydrothermal vents, dark lakes buried beneath polar ice caps, on the exteriors of spacecraft, around nuclear waste storage sites.
Adaptation and Evolution:
Extremophiles have developed unique biological and biochemical processes over millions of years to adapt to diverse habitats.
Unlike more complex life forms, which have one set of proteins, extremophiles have multiple sets of proteins, each adapted to specific environmental conditions.
These proteins are ‘activated’ based on the surrounding environment, enabling survival during extreme conditions like high temperatures, lack of water, or high acidity.
Significance: Some scientists believe that life on Earth may have begun as an extremophile in extreme environmental niches before spreading and adapting to more temperate ecosystems.
About the ‘Earth Microbiome Project’
It is a global initiative aimed at mapping, organising, and understanding the diversity of microbial life across different environmental niches on Earth.
The project was founded in 2010.
Objective:
To sequence 200,000 genetic samples from diverse environments.
To assemble 500,000 microbial genomes, creating a comprehensive map of microbial diversity on Earth.
Significance:
The project is part of broader efforts to understand the microbial world, which is still in its infancy.
It is related to other significant projects like the ‘Earth Biogenome Project,’ which aims to sequence the genomes of all eukaryotic organisms on the planet.
Understanding microbial diversity has numerous biological and industrial applications, such as developing new enzymes for molecular biology or finding new ways to adapt organisms to challenging environments.
PYQ:
[2017] With reference to agriculture in India, how can the technique of ‘genome sequencing’, often seen in the news, be used in the immediate future?
1. Genome sequencing can be used to identify genetic markers for disease resistance and drought tolerance in various crop plants.
2. This technique helps in reducing the time required to develop new varieties of crop plants.
3. It can be used to decipher the host-pathogen relationships in crops.
Select the correct answer using the code given below:
The World Health Organization (WHO) has declared mpox as a “public health emergency of international concern” (PHEIC).
What is a PHEIC?
A PHEIC is a formal declaration by the WHO under the International Health Regulations (IHR), 2005.
It refers to an “extraordinary event” posing a public health risk through the international spread of disease, potentially requiring a coordinated global response.
Criteria for PHEIC:
Serious and unusual event: Poses a significant public health risk.
Cross-border implications: Affects more than one country.
International response needed: Requires immediate global coordination.
Purpose: Mobilizes resources, raises awareness, and coordinates efforts to manage and contain the threat.
What is Mpox?
Mpox is a disease caused by the orthopoxvirus, related to the smallpox virus.
First detected in humans in 1970, it is endemic in central and West Africa.
Transmission: Spread from animals to humans (zoonotic) and between humans via close contact, respiratory droplets, or contaminated materials.
Symptoms: Fever, rash, swollen lymph nodes; can lead to severe complications or death.
Vaccination: WHO recommends vaccines, widely used in Nigeria and the Democratic Republic of the Congo (DRC) to control outbreaks.
Recent Developments:
In recent years, there has been an increase in mpox cases, including the emergence of new strains such as clade 1b, which has spread to countries outside of its typical endemic regions.
This led to the declaration of mpox as a Public Health Emergency of International Concern (PHEIC) due to its potential for widespread impact.
PYQ:
[2014] Consider the following diseases
1. Diphtheria
2. Chickenpox
3. Smallpox
Which of the above diseases has/have been eradicated in India?
The TN Water Resources Department (WRD) has informed the National Green Tribunal that it has requested ₹160 crore from Kamarajar Port in Ennore, Tamil Nadu, to address the removal of invasive mussels along the coast near the port.
The WRD has accused Kamarajar Port of being primarily responsible for the spread of this invasive species due to its failure to regulate ballast water from ships.
What is Ballast Water?
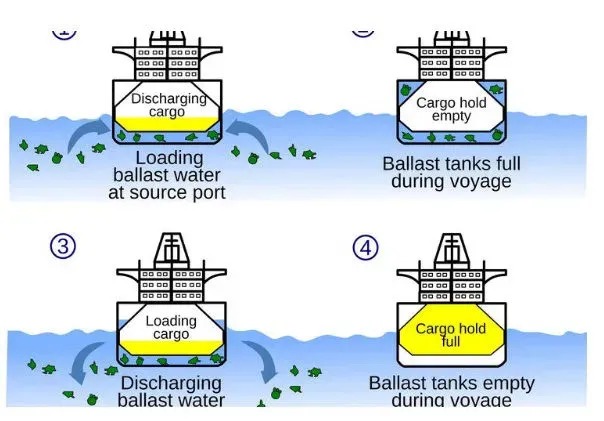
Ballast water is fresh or saltwater held in the ballast tanks of ships. It is used to provide stability and maneuverability during a voyage, especially when a ship is not carrying enough cargo or when additional stability is required due to rough seas.
Ballast water can carry a variety of biological materials, including bacteria, microbes, and small invertebrates. When discharged at a new location, this water can introduce non-native species into local ecosystems, potentially leading to ecological imbalances.
How Serious is the Problem?
Invasive Species in India: Scientists have recorded nearly 30 invasive species entering Indian waters through ship ballast water, with the charru mussel (Mytella strigata) being one of the most harmful. This species has replaced native species in critical habitats like Pulicat Lake in Tamil Nadu.
Ecological Impact: The introduction of invasive species can disrupt local ecosystems, outcompete native organisms, and significantly affect biodiversity. The charru mussel has a high survival rate and prolific reproduction, exacerbating its impact on marine environments.
Economic Consequences: The proliferation of invasive species can hinder fishing activities and affect the livelihoods of local communities dependent on marine resources.
What are Global Regulations?
Ballast Water Management (BWM) Convention: The International Maritime Organization (IMO) adopted the BWM Convention, which came into force in 2017. This convention aims to prevent the spread of harmful aquatic organisms and pathogens through ballast water.
Under the BWM Convention, ships must manage their ballast water to ensure that aquatic organisms and pathogens are removed or rendered harmless before discharge.
Compliance: Countries like Australia and New Zealand have stringent regulations to prevent ballast water from damaging their marine ecosystems, including rigorous checks of ballast water management systems.
What is India’s Position?
As of July 2023, India has not signed the BWM Convention, meaning there are no obligations for ships calling at Indian ports to comply with its regulations. This lack of participation raises concerns about the unchecked discharge of ballast water.
While other maritime regulations apply in Indian ports but the discharge of ballast water is not subject to checks or regulations, leading to potential ecological risks.
Way forward:
Adopt and Implement the BWM Convention: India should consider ratifying the Ballast Water Management (BWM) Convention to align with international standards.
Strengthen Domestic Regulations and Awareness: Even before ratifying the BWM Convention, India can introduce national legislation to regulate ballast water discharge in its ports.
Mains PYQ:
Q How does biodiversity vary in India? How is the Biological Diversity Act,2002 helpful in conservation of flora and fauna? (2018)
The establishment of the Anusandhan National Research Foundation and its funding structure clearly signals the government’s intended direction.
Research Policy in India
Shift Towards Corporatisation: The Indian government’s approach encourages research institutions to generate revenue through external sources, moving away from reliance on public funding.
This trend aligns with the 2015 Dehradun Declaration, which advocated for marketing patents to self-finance research initiatives.
Focus on Market-Driven Research: The ANRF aims to align research outcomes with market needs, promoting the idea that scientific advancements should have immediate applications.
This is evident in the emphasis on prototype development, which assesses the marketability of research products, which was highlighted in the 2024 Budget speech.
Integration of Industry and Academia: The ANRF is designed to forge collaborations between research institutions and the private sector by earmarking a substantial portion of its funding (approximately 72%) from private sources, bridging the gap between scientific research and commercial application.
Note: The Anusandhan National Research Foundation (ANRF) is a significant initiative in India’s research landscape, established under the Anusandhan National Research Foundation Act, 2023.
Funding Mechanism of ANRF
Budget Allocation: The ANRF will be allocated ₹50,000 crore over five years, with a significant portion expected to come from non-government sources, including industry and philanthropic contributions.
Governance Structure: The ANRF will be governed by a board that includes industry representatives and experts, ensuring that funding decisions align with market demands and technological advancements.
What are the signals despite the stated objective of ANRF?(challenges)
Potential Undermining of Curiosity-Driven Research: The private sector does not want to fund basic research because it has no immediate commercial applications which ultimately leads to a decline in foundational scientific exploration.
Public Funding Concerns: The government’s expectation for private sector funding raises questions about the sustainability of public investment in research.
The current ratio of public funding for science research in India (0.6% to 0.7% of GDP) is significantly lower than that of countries like South Korea (around 4.8% of GDP).
India’s Achievements Despite a Low GDP Investment in R&D:
High Production of PhDs: Annually, India generates approximately 40,813 PhDs, ranking third globally after the United States and China.
Robust Research Output: India’s research output remains substantial, with over 300,000 publications in 2022, making it the third-largest producer of scientific publications globally.
Growth in Patent Grants: India has shown remarkable progress in intellectual property creation, securing 30,490 patents in 2022, placing it sixth globally.
Improvement in Global Rankings: India has made significant strides in global innovation rankings and research quality. It improved its position on the Global Innovation Index (GII) from 81st place in 2015 to 40th in 2023.
India climbed to the 9th rank in the Nature Index 2023, surpassing countries like Australia and Switzerland.
Investment in Autonomous R&D Institutions: A considerable portion of India’s R&D funding is directed towards autonomous research laboratories. The total investment in R&D reached approximately $17.2 billion in 2020-21, with a significant allocation to key scientific agencies such as the Defence Research and Development Organisation (DRDO) and the Indian Council of Agricultural Research (ICAR).
Comparison with Other Countries
As of 2023, India’s gross expenditure on R&D stands at approximately 0.64% of its GDP.
United States: The U.S. invests about 3.46% of its GDP in R&D
South Korea: South Korea leads with an impressive 4.8% of GDP allocated to R&D.
Germany: Germany’s R&D spending is around 3.1% of GDP.
China: China’s investment in R&D is approximately 2.4% of GDP.
Taiwan: Taiwan also invests around 3.77% of its GDP in R&D.
Way Forward:
Strengthening Public Funding for Basic Research: To ensure a balanced research ecosystem, the government should increase public investment in foundational scientific research.
Enhancing Industry-Academia Collaboration: The government should facilitate stronger partnerships between research institutions and the private sector while maintaining a focus on both applied and basic research.
Mains PYQ:
Q What are the research and developmental achievements in applied biotechnology? How will these achievements help to uplift the poorer sections of the society? (2021)
The Union Ministry of Jal Shakti has launched Version 2.0 of the ‘FloodWatch India’ mobile application.
About FloodWatch India Version 2.0
FloodWatch India Version 2.0 is a mobile application developed by Central Water Commission (CWC) under the Union Ministry of Jal Shakti.
The app provides real-time information and forecasts related to flood situations across India.
It now covers 592 flood monitoring stations, up from 200 in the previous version, offering a more comprehensive overview of flood conditions.
The app includes information on the storage positions of 150 major reservoirs in India, aiding in flood management.
Key features include:
It provides real-time river flow data and flood forecasts up to 7 days in advance.
Users can view state-wise and basin-wise flood forecasts and advisories.
The app uses satellite data analysis, mathematical modelling, and real-time monitoring to ensure accurate and timely flood information.
The app is available in English and Hindi and offers both readable and audio broadcast formats.
PYQ:
[2016] The frequency of urban floods due to high intensity rainfall is increasing over the years. Discussing the reasons for urban floods, highlight the mechanisms for preparedness to reduce the risk during such events.
The recent edition of Exercise Udara Shakti was recently concluded in Malaysia.
About Exercise Udara Shakti
Udara Shakti is a bilateral air force exercise conducted between India and Malaysia.
The primary objective of this exercise is to enhance military cooperation, improve mutual understanding, and share operational expertise.
Features of the Exercise
Both India and Malaysia deploy their Sukhoi-30 fighter jets for the exercise, facilitating direct comparison and operational cooperation.
A distinctive feature of this initiative is the HOP (Hands-On Participation) Exercise, where pilots from both nations swap aircraft.
The Subject Matter Expert Exchange (SMEE) component focuses on sharing knowledge and skills in aviation and engineering specific to the Sukhoi-30 aircraft.
PYQ:
[2024] Which of the following statements about ‘Exercise Mitra Shakti-2023’ are correct?
This was a joint military exercise between India and Bangladesh.
It commenced in Aundh (Pune).
Joint response during counter-terrorism operation was a goal of this operation.
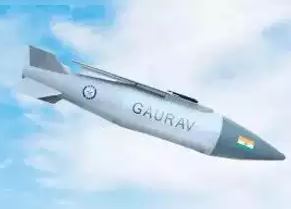
The Defence Research and Development Organisation (DRDO) has successfully conducted the maiden flight test of the long-range glide bomb (LRGB) ‘Gaurav’.
The test was carried out from a Su-30 MK-I fighter jet of IAF.
About LRGB GAURAV
LRGB Gaurav is a 1,000 kg class long-range glide bomb developed by the DRDO.
It is air-launched from a Su-30 MK-I fighter jet of the Indian Air Force.
The bomb is designed and developed indigenously by the Research Centre Imarat (RCI), Hyderabad.
Adani Defence and Bharat Forge participated as Development cum Production Partners in the Gaurav project.
Key Features:
It uses a hybrid navigation system that combines Inertial Navigation System (INS) with Global Positioning System (GPS) data for highly accurate targeting.
The glide bomb is capable of hitting targets at long distances, although the exact range is not publicly disclosed.
Gaurav enhances India’s precision strike capabilities, allowing for significant impact on various target types with reduced risk to aircraft.
PYQ:
[2014] Which reference to Agni-IV Missile, which of the following statements is/are correct?
1. It is a surface-to-surface missile.
2. It is fuelled by liquid propellant only.
3. It can deliver one-tonne nuclear warheads about 7500 km away.
Select the correct answer using the code given below.
Q. Discuss different types of cyber crimes and measures required to be taken to fight the menace. (UPSC IAS/2020) Q. “The emergence of the Fourth Industrial Revolution (Digital Revolution) has initiated e-Governance as an integral part of government”. Discuss. (UPSC IAS/2020)
Note4Students:
Mains: Challenges due to AI in 2024;
Mentor comment: Concerns in 2024 were fueled by fears of new threats from Artificial Intelligence (AI), including Generative AI and Artificial General Intelligence (AGI). The growing potential for disinformation and cyber threats made the outlook particularly grim. The 33rd Summer Olympic Games in France during July-August 2024 were seen as prime targets for digital criminals, prompting experts to prepare for unprecedented attacks. Fortunately, the Games concluded peacefully, without any major incidents. However, the absence of a significant attack shouldn’t lead to complacency, as new digital threats continue to emerge, requiring ongoing vigilance from security agencies.
Let’s learn!
__
Why in the News?
As 2024 began, there were warnings of new security threats on the horizon, and security experts around the world were preparing for a series of attacks across various areas.
Challenges due to AI in 2024:
Increased Disinformation: The year began with asurge in disinformation, particularly surrounding the Taiwanese elections in January 2024. The atmosphere was rife with fake posts and videos, largely attributed to external influences, notably China.
National Security Concerns: The combination of AI-generated disinformation and cyber attacks poses a serious threat to national security. This is particularly evident in the ongoing conflict in Ukraine, where both sides have employed disinformation tactics, leading to disruptions in critical infrastructure such as telecommunications and power grids.
Global Electoral Impact: As elections are scheduled in at least 64 countries in 2024, the potential for AI to disrupt electoral processes has raised alarms.
A recent software glitch in Microsoft Windows
Global Outage: The outage began on July 19, 2024, affecting Microsoft’s Azure cloud service and quickly spreading to various regions, including the United States and India.
It disrupted critical operations such as flight schedules, air traffic control, and stock exchanges, showcasing the vulnerability of interconnected systems.
Severity Rating: The Indian Computer Emergency Response Team (CERT-IN) issued a ‘critical’ severity rating for the incident, indicating the serious nature of the disruption, even though a cyberattack did not cause it.
Impact on Devices: Microsoft reported that over eight million Windows devices experienced failures due to the glitch, leading to widespread operational issues.
Many users encountered the Blue Screen of Death (BSOD), which trapped them in boot loops and rendered their devices inoperable.
Do you know?
This incident recalls previous significant cyberattacks, such as WannaCry in 2017, which infected over 230,000 computers globally, and Stuxnet in 2010, which specifically targeted Iran’s nuclear program.
Steps taken by the Indian government:
• Indian Cyber Crime Coordination Centre (I4C): Established to provide a comprehensive framework for law enforcement agencies (LEAs) to address cyber crimes effectively. It includes various components such as the National Cyber Crime Threat Analytics Unit and the National Cyber Crime Reporting Portal, facilitating state coordination. •Indian Computer Emergency Response Team (CERT-In): It acts as the central agency to help control cybersecurity incidents and disseminate alerts. •Cyber Surakshit Bharat Initiative: Launched to raise awareness about cyber crimes and improve safety measures for Chief Information Security Officers (CISOs) and IT staff across government departments. •Cyber Swachhta Kendra: This initiative focuses on detecting and removing malicious botnet programs from computers.
Way forward:
Strengthening Cybersecurity Infrastructure: The government should focus on enhancing the existing cybersecurity frameworks and expanding the capabilities of agencies like CERT-In and I4C.
Public Awareness and Education: The need to increase awareness about the risks associated with AI-generated disinformation and cyber threats is crucial. Initiatives like Cyber Surakshit Bharat should be expanded to include broader public education campaigns.
The Ministry of New and Renewable Energy has issued operational guidelines for the Implementation of ‘Model Solar Village’ under PM-Surya Ghar Muft Bijli Yojana.
The centre recently allocated ₹800 crore for the same.
About PM Surya Ghar Muft Bijli Yojana
Description
Purpose
To provide 300 units of free electricity per month to beneficiaries through an investment of ₹75,000 crores.
Deadline
Extended the deadline from 2022 to 2026.
Announcement
Initially announced in an Interim Budget 2024-25 speech by the Finance Minister.
Target
Aimed to light up 1 crore households.
Implementation
Urban Local Bodies and Panchayats are incentivised to promote rooftop solar systems.
Financial Support
Average Monthly Electricity Consumption (units)
Suitable Rooftop Solar Plant Capacity
Subsidy Support
0-150
1-2 kW
₹ 30,000 to ₹ 60,000
150-300
2-3 kW
₹ 60,000 to ₹ 78,000
> 300
Above 3 kW
₹ 78,000
Features of the ‘Model Solar Village’ Initiative:
Details
Comprehensive Solarization
Solarize all households and public areas with home lighting, water systems, pumps, and streetlights.
Seeks to create one Model Solar Village per district.
Implementing Agency
State Renewable Energy Development Agency (SREDA) or another entity nominated by the State/UT Government will implement the scheme.
24×7 Solar-Powered Village
Develop villages powered entirely by solar energy, promoting self-reliance in meeting energy needs.
Central Financial Assistance (CFA)
₹1 crore grant per village based on a Detailed Project Report (DPR) by the Implementing Agency.
The total financial allocation for this initiative is ₹800 crore.
Eligibility Criteria
Revenue village with a population over 5,000 (or 2,000 in special category states).
Based on installed renewable energy capacity, overseen by the District Level Committee (DLC) 6 months after the declaration.
Fund Disbursement
40% on the award of works, 40% after completion, 20% after 6 months of operation.
PYQ:
[2018] With reference to solar power production in India, consider the following statements:
1. India is the third largest in the world in the manufacture of silicon wafers used in photovoltaic units.
2. The solar power tariffs are determined by the Solar Energy Corporation of India.
Which of the statements given above is/are correct?
![[13th August 2024] The Hindu Op-ed: Disinformation, AI and ‘cyber chakravyuh’](https://www.civilsdaily.com/wp-content/uploads/2024/08/13-Aug-1568x882.jpg)