💥Mains Ready By December. Smash Mains & Smash PYQ Admissions Open

Subject: Environment

  • Pichavaram mangroves valued at ₹2,485 crore: study

    Pichavaram mangroves valued at ₹2,485 crore: study

    Why in the News

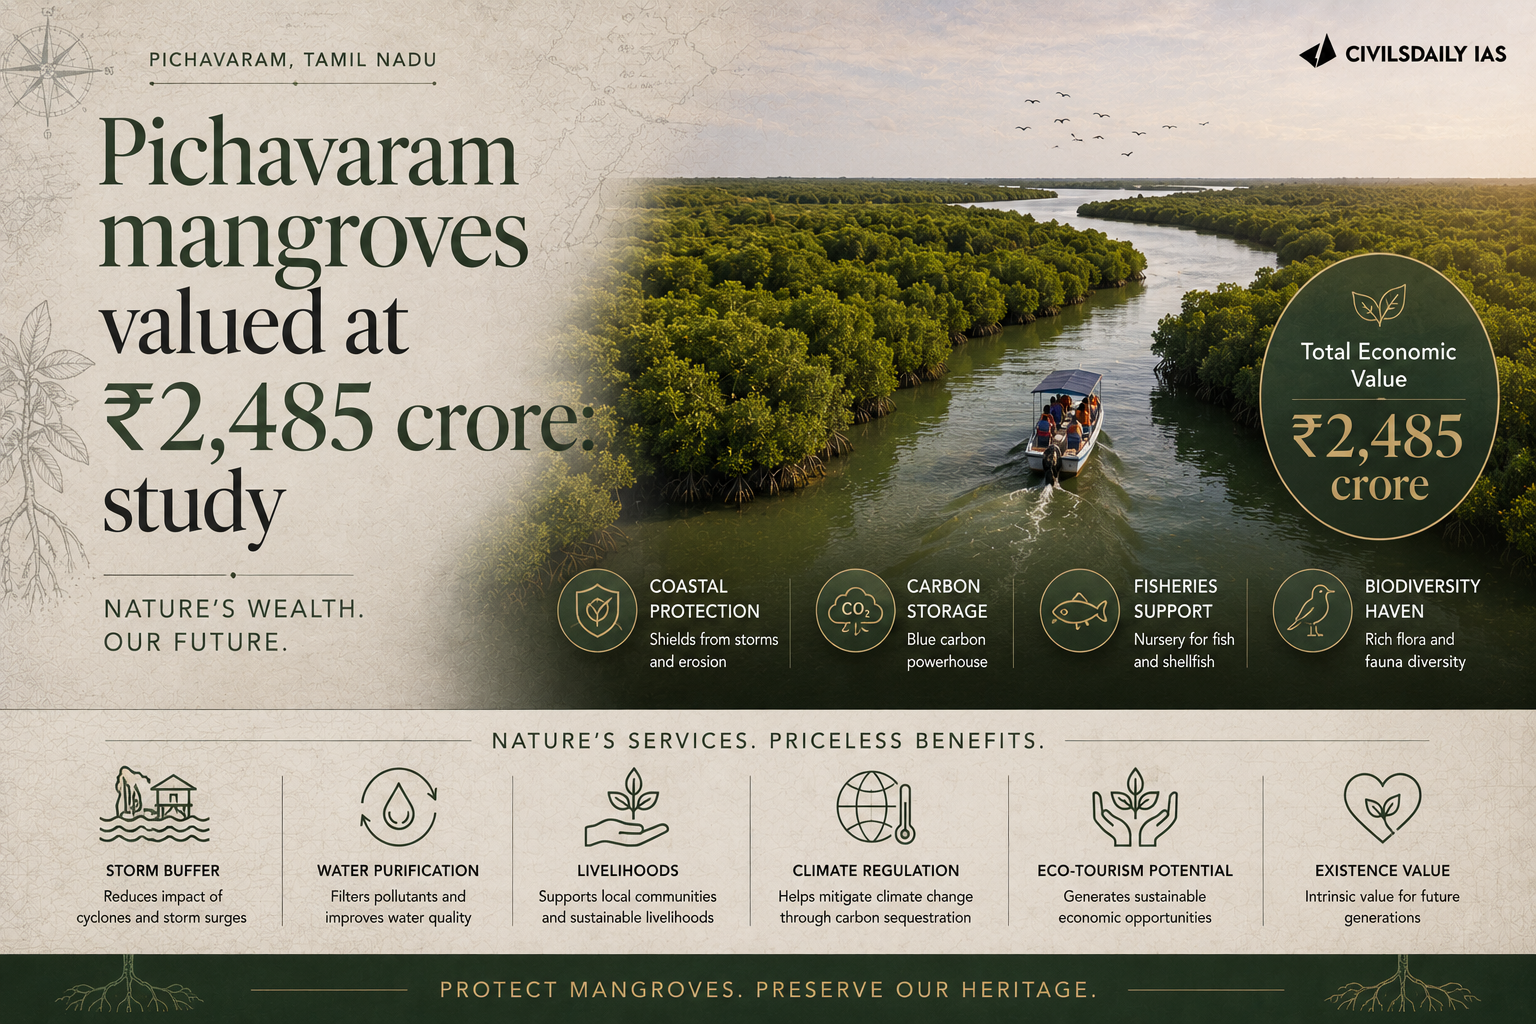
    A study of the Pichavaram mangrove ecosystem in Tamil Nadu has put its total economic value (TEV) at ₹2,485.38 crore, with a per hectare value of ₹1.83 crore. The valuation covers ecological, economic and social benefits together, and includes a separate blue carbon assessment of what the forest stores. The study was carried out at the Centre for Ecological Economics and Natural Resources, Institute for Social and Economic Change, Bengaluru, and was funded by the Forest Genetics Division, Coimbatore. The tension it identifies is that most of what a mangrove supplies is non market in nature, so it never enters the accounts that development planning actually uses.

    What is ecosystem service valuation?

    1. About: Ecosystem service valuation attaches a monetary figure to the benefits a natural system supplies, so that those benefits can be compared against the returns from converting the same land to another use.
    2. The four service categories: Mangrove systems supply provisioning, regulating, supporting and cultural ecosystem services. Provisioning covers physical output such as fish, regulating covers functions such as storm buffering and climate regulation, supporting covers processes such as nutrient cycling, and cultural covers non material benefits.
    3. Total economic value: TEV is the aggregate of all these service flows expressed in one figure, rather than only the marketed output the system yields.

    What did the valuation measure?

    1. The headline value: The total economic value of the Pichavaram mangrove ecosystem stands at ₹2,485.38 crore, and the per hectare value at ₹1.83 crore.
    2. Sediment holds more carbon than the trees: The analysis found that mangrove sediments constitute a more substantial carbon reservoir than the vegetation.
    3. Soil carbon density: Average soil organic carbon stock was estimated at 251.14 tonnes of carbon per hectare, generating an economic value of ₹90.24 lakh per hectare.
    4. Combined blue carbon asset: With vegetation and soil carbon pools taken together, the total blue carbon asset value of the ecosystem is ₹1,612.40 crore. Blue carbon is the carbon captured and stored by coastal and marine vegetation and the sediment beneath it.

    Why do these benefits stay out of development planning?

    1. The services are non market: Several ecological benefits are non market in nature and are not reflected in market transactions, so they generate no price a planner can read.
    2. Undervaluation is the consequence: Many ecosystem services remain undervalued in conventional development planning even where their contribution to ecological sustainability and human well being is established.
    3. Valuation is the bridge: A single expressed figure allows a non market service to be set against a marketed alternative use of the same coastal land.

    What makes Pichavaram ecologically significant?

    1. Status: It is deemed one of the most ecologically significant coastal wetland ecosystems in India.
    2. Biodiversity and fisheries: It supports biodiversity conservation and fisheries productivity.
    3. Coastal protection and climate regulation: It provides coastal protection, climate regulation and blue carbon sequestration.
    4. Livelihood security: It underpins livelihood security for the coastal communities that depend on it.

    How was the study built?

    1. Primary and secondary data: The assessment combined primary field data with secondary sources rather than relying on modelled estimates alone.
    2. Household survey base: Primary information was collected from 302 households across five mangrove dependent villages.
    3. The villages covered: The five are MGR Thittu, Kalaignar Nagar, Chinnavaikal, Patriadi and Mudasalodai.

    What does the study recommend?

    1. Valuation inside planning: Ecosystem service valuation should be integrated into coastal development planning and environmental decision making.
    2. Mangroves as nature based solutions: Mangroves should be recognised as key nature based solutions for climate adaptation and disaster risk reduction.
    3. Finance instruments: Blue carbon financing mechanisms, carbon credit programmes and Payment for Ecosystem Services schemes should be developed for these systems.

    Challenges to using ecosystem service valuation in coastal planning

    1. A non market service produces no cash flow: A protective service is realised only when the hazard it guards against actually occurs, so it never appears in a project’s financial statement. Eg. Mangrove storm buffering shows up as damage avoided during a cyclone landfall, which no project account records.
      The Fix: Require the ecosystem service value of the land to be entered as a stated line item in the cost benefit statement of every coastal infrastructure clearance.
    2. Valuation methods are contested: Survey based techniques such as willingness to pay measure what nearby residents can afford rather than what the service is worth to the wider economy. Eg. Household surveys in poor mangrove dependent villages return low willingness to pay figures for the same service that protects a city downstream.
      The Fix: Publish the method, the sample and the confidence range alongside every headline valuation figure so the number can be contested on its assumptions.
    3. Aquaculture and land conversion drive mangrove loss: The land use that competes with mangrove is profitable, immediate and privately captured, while the service lost is diffuse and public. Eg. Shrimp pond expansion along the Tamil Nadu and Andhra Pradesh coast has cleared mangrove and adjoining back swamp.
      The Fix: Tie Coastal Regulation Zone enforcement to satellite based mangrove cover monitoring with annual public reporting at the district level.
    4. Blue carbon credits lack a settled soil accounting standard: Sediment carbon is the largest pool and the least standardised, so the same forest yields different credit volumes under different protocols. Eg. Soil carbon is measured to one metre depth in some protocols and deeper in others.
      The Fix: Adopt a single national measurement protocol for mangrove soil organic carbon before any credit is issued against Indian mangrove land.
    5. Restoration often replaces hydrology with planting: Plantation drives on sites that were never mangrove habitat produce low survival and no service recovery. Eg. Monoculture planting on open mudflats has repeatedly failed where tidal flushing was never restored.
      The Fix: Restore tidal connectivity and creek hydrology first, and allow natural regeneration to determine species composition.

    Conclusion

    A valuation changes nothing by itself. It changes outcomes only when the figure enters the document that decides land use, and coastal zone plans in India are still written without one. Tamil Nadu’s coastal clearances are the place this will show. The marker to watch is whether an approval order for coastal land begins citing a per hectare service value against the project it is approving.

    Back2Basics

    1. Location: The Pichavaram mangrove forest lies in Cuddalore district on the Tamil Nadu coast.
    2. Setting: It sits in the estuarine complex formed between the Vellar and Coleroon rivers, adjoining the Killai backwater.
    3. Scale: It is among the largest mangrove forests in India and is made up of a network of islets separated by tidal creeks.
    4. Composition: Avicennia and Rhizophora are the dominant mangrove genera across the forest.

    [2023, GS3, 15 marks] Comment on the National Wetland Conservation Programme initiated by the Government of India and name a few India’s wetlands of international importance included in the Ramsar Sites.
  • UN sets pathway to tackle ‘inevitable breach’ of the 1.5°C global warming limit

    UN sets pathway to tackle ‘inevitable breach’ of the 1.5°C global warming limit

    Why in the News

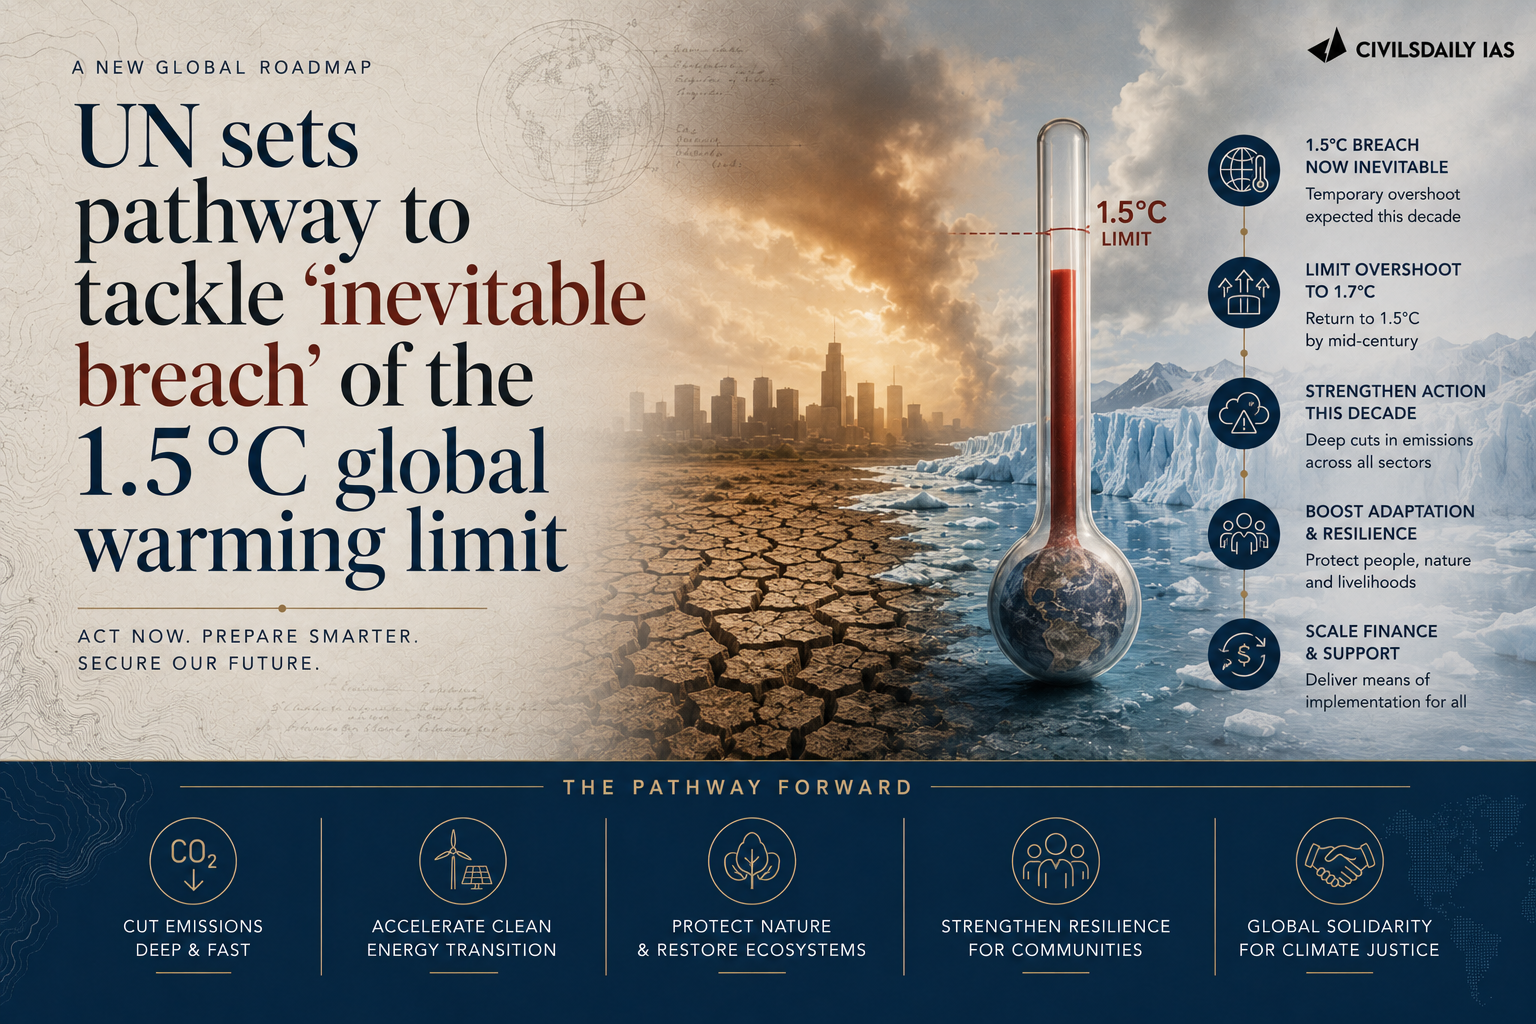
    The United Nations Environment Programme (UNEP) has for the first time set out a detailed “overshoot, peak, and decline” pathway for global warming. Its report, Limiting Overshoot, states that a breach of the 1.5 degrees Celsius limit is now unavoidable and will bring irreversible ecological losses that no adaptation initiative can undo. That limit is the central goal of the Paris Agreement, 2015, which committed parties to holding the rise in average global temperatures well below 2 degrees Celsius and to pursuing efforts to limit it to 1.5 degrees Celsius above pre industrial levels. The shift is in the framing rather than in the science: the objective being planned for is no longer the prevention of a breach but the management of one, described in the report itself as by no means an acceptable or preferred pathway and simply the best remaining option.

    What is the “overshoot, peak, and decline” pathway?

    1. The sequence it describes: Average global temperature crosses the 1.5 degrees Celsius limit, rises to a peak, and is then brought back down below the limit by 2100.
    2. What it tries to control: With the crossing treated as fixed, the two variables left are the height of the peak and the length of time spent above the limit, and the pathway seeks to hold both as low as possible.
    3. What it requires that mitigation alone does not: Returning below the limit after a peak requires removing carbon dioxide already in the atmosphere, not only stopping additional emissions.

    What do the warming projections show?

    1. The breach is imminent: Global warming will cross 1.5 degrees Celsius in the next few years.
    2. Full delivery of every pledge still overshoots: A scenario in which every country delivers on its national climate plan and its net zero target puts peak warming at 1.8 degrees Celsius.
    3. Current policies point far higher: They point to a rise of about 2.6 degrees Celsius by 2100, within a range of 1.9 to 3.6 degrees Celsius.

    What are the compounding costs of time spent above 1.5 degrees Celsius?

    1. Sea level and ocean systems: Sea level rise accelerates, and coral reefs collapse.
    2. Cryosphere: Glacier loss exceeds a quarter of global glacier mass by 2100.
    3. Food systems: Global food production declines by up to 14% by 2050 without effective adaptation.
    4. Tipping points: The odds rise of irreversible transitions in the West Antarctic and Greenland ice sheets, the Atlantic Meridional Overturning Circulation, the ocean current system that redistributes heat across the Atlantic, and the Amazon.

    Why is reversing an overshoot harder than avoiding it?

    1. Delay adds warming at a fixed rate: Every five years of continued high emissions adds roughly 0.1 degrees Celsius to peak warming.
    2. Removing the same warming costs far more than adding it: Reversing that 0.1 degrees Celsius afterwards means pulling about 220 billion tonnes of carbon dioxide out of the atmosphere, over and above whatever is still being emitted.
    3. Emission cuts alone no longer close the gap: A steep scaling up of nature based removals, such as large reforestation programmes, is required alongside them.

    Why does the report single out methane?

    1. A first for the United Nations: This is the first time a report of this kind has placed significant stress on methane rather than treating carbon dioxide as the only lever.
    2. Its share of the problem is large: Methane contributes about 0.5 degrees Celsius of current warming.
    3. It is the fastest acting lever available: Cutting methane is described as the most effective way to slow warming in the near term, which is precisely what holding down the peak requires.

    How was the diplomatic ground for conceding an overshoot laid?

    1. The concession was made first at a climate conference, not in a science report: The 30th UN Climate Change Conference (COP30), held in 2025 at Belém in Brazil, produced the consensus “Global Mutirão” decision, mutirão being a Portuguese term for collective effort.
    2. What made it significant: It was the first COP text to concede that a temporary overshoot of the 1.5 degrees Celsius limit was likely, given how fast the remaining carbon budget was being spent.
    3. The political framing accompanying the report: This summer’s heat, wildfires and floods have been described as a warning of what lies ahead, with the stated objective now to make the overshoot as small and as short as possible.

    Challenges to an overshoot, peak and decline pathway

    1. Carbon removal at the required scale does not exist: The pathway assumes gigatonne scale removal that current technology and land availability cannot deliver. Eg. Operating direct air capture plants worldwide remove a volume measured in thousands of tonnes a year against a requirement measured in billions.
      The Fix: Separate emission reduction and removal targets in every nationally determined contribution, so removal cannot be used to discount a country’s reduction obligation.
    2. Overshoot creates a moral hazard in near term policy: Once a temporary breach is accepted as planned for, the incentive to cut now weakens, because the shortfall is deferred to a future removal obligation. Eg. Net zero pledges dated to mid century already rely on unspecified future removals to close the residual gap.
      The Fix: Fix binding five year interim carbon budgets, so a country’s compliance is assessed against cumulative emissions rather than against a distant target year.
    3. Tipping points are not reversible when the temperature comes back down: Bringing temperature below the limit later does not restore a system that has already crossed its threshold. Eg. An ice sheet that has begun irreversible retreat continues losing mass even after warming stabilises.
      The Fix: Set the peak temperature, rather than the end of century value, as the headline metric against which climate policy is assessed.
    4. Nature based removal competes with food and land rights: Large reforestation programmes need land that is already used for cultivation, grazing or forest dwelling communities. Eg. Plantation drives on land recorded as degraded have displaced pastoral and forest dependent use in several countries.
      The Fix: Require free, prior and informed consent and a land tenure audit before any removal project is counted towards a national target.
    5. The cost falls on countries that did not cause the overshoot: Adaptation finance to survive the period above the limit is needed by economies with the least capacity to raise it. Eg. Small island developing states face permanent territorial loss from sea level rise they contributed almost nothing to.
      The Fix: Tie disbursement from the loss and damage fund to a published overshoot period schedule, so the finance arrives during the years the harm is being incurred.

    Conclusion

    The value of this pathway is that it makes the cost of delay arithmetic rather than rhetorical. Warming added by continuing to emit is cheap and automatic; warming removed afterwards is expensive, slow and dependent on technology that has not been built at scale. That asymmetry is what converts a distant target year into an immediate operational question about the next few years of emissions. The reform that follows is to shift the metric climate policy is judged on, from a date by which a country claims to reach balance to the height of the peak its emissions in this decade produce.

    [2025, GS3, 15 marks] Write a review on India’s climate commitments under the Paris Agreement (2015) and mention how these have been further strengthened in COP26 (2021). In this direction, how has the first Nationally Determined Contribution (NDC) intended by India been updated in 2022?”

  • Solution for stubble burning lies close to the farm

    Solution for stubble burning lies close to the farm

    Why in the News


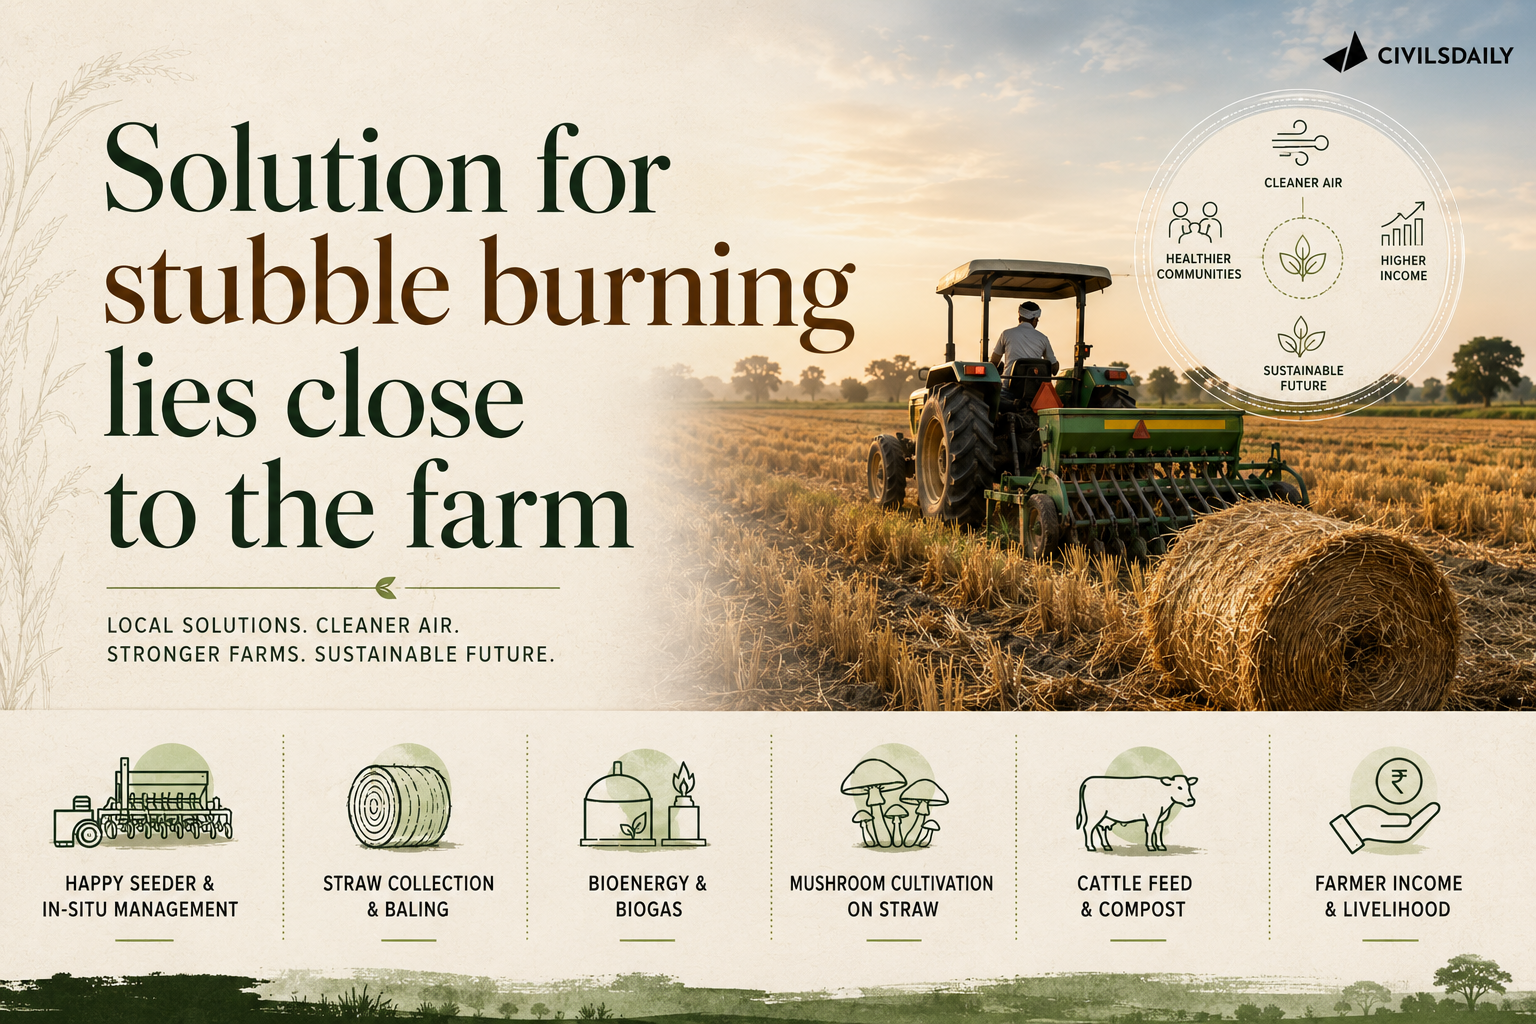
    Punjab’s paddy harvesting season is approaching, reviving Delhi’s air-pollution concerns. The focus is shifting from banning stubble burning to creating profitable markets for parali and increasing farmers’ income.

    What is biochar?

    1. Definition: Biochar is a carbon-rich material produced by heating biomass under limited oxygen, so the carbon is retained as char rather than burnt away.
    2. Feedstock: It can be made from crop residues such as paddy, maize, cotton and mustard stalks.
    3. Yield: Roughly 100 kg of dry parali yields around 30 kg of char.
    4. Use in soil: Applied to soil, it improves water retention and nutrient-use efficiency and locks carbon away for a century.

    Why do farmers still burn after years of measures?

    1. Unchanged economics: Residue is bulky, the window before wheat sowing is narrow, and almost every alternative to burning carries a cost.
    2. Burning is quick and cheap: Alternatives involve cost, labour and uncertainty, so burning remains the rational choice at the field.
    3. Limits of enforcement and subsidy: Enforcement and machinery subsidies help, and behaviour changes only when the residue itself becomes valuable.

    What has changed in the economics of parali?

    1. From a cost to a price: Farmers in several locations were paying to have straw removed. Today in parts of Punjab the same straw fetches around Rs 1.5 to 2 per kg.
    2. Who is buying: Demand from power plants, compressed biogas (CBG) units and pellet manufacturers is slowly creating a market for what was treated as waste.
    3. The new question: If parali now has value, the issue is where that value should be created and how much can remain with the farmer.

    Why is biochar different from burning straw for energy?

    1. Carbon fate: Burning biomass as fuel recovers energy and returns much of its carbon to the atmosphere. Biochar applied to soil retains a significant share of the carbon and serves an agronomic purpose.
    2. Punjab’s need: The rice-wheat system is under stress from declining soil quality, intensive fertiliser use and groundwater depletion, and residue generated by the same system could improve its soils.

    Where is the value created, and who captures it?

    1. The processing location problem: Parali has to be collected, baled, stored and transported within the narrow window before wheat sowing. Long-distance transport of a bulky, relatively low-value material quickly eats into its economics.
    2. Farmer as raw material supplier: The farmer supplies the raw material, and most value addition happens after the biomass leaves the village.
    3. The biochar irony: A farmer supplies the straw, sees it processed elsewhere and later buys back a product made from biomass originating on farms like his.
    4. The chakki precedent: Wheat does not travel 100 km merely because flour requires machinery. The village chakki places processing close to where the commodity is produced and consumed.

    How would a village-scale biochar system work?

    1. Build-operate-transfer: A technology provider installs and operates the unit, trains local operators and ensures quality and emission standards. Over time the asset and the capability transfer to a farmer producer organisation (FPO), a self-help group (SHG) or a cooperative.
    2. Government’s role: The government provides standards, training, concessional finance and initial support rather than running thousands of units, and panchayats help with land and coordination.
    3. Farmer’s routine: Farmers bring straw to a nearby processing point much as they bring wheat to a flour mill. Some biochar returns to their fields and the rest is sold where markets exist.
    4. What changes: Raw straw travels less, value addition happens closer to the farmer, and villages are not left with subsidised machinery nobody knows how to operate.

    Challenges to village-scale biochar processing

    1. Emissions from small kilns: A poorly run pyrolysis unit releases methane, carbon monoxide and particulate matter, and so replaces one smoke source with another. Eg. The Kon-Tiki flame curtain kiln, the low-cost design most village pilots use, has no flue gas treatment.
      The Fix: Notify emission standards for small pyrolysis units under the Central Pollution Control Board and make the build-operate-transfer operator liable for them until handover.
    2. Carbon credit verification: Biochar earns carbon removal credits only where permanence is measured, and a village unit cannot measure it alone. Eg. The Puro.earth biochar methodology requires a hydrogen to organic carbon ratio below 0.7 as the test of permanence.
      The Fix: Aggregate village units under an FPO level registry with laboratory testing so that credits are pooled and sold at scale.
    3. Paddy straw is a poor feedstock on its own: Paddy straw carries a high silica content, so its char is ash heavy and lower in fixed carbon than wood char. Eg. Rice straw ash is largely silica, and the char inherits it.
      The Fix: Blend paddy straw with maize, cotton and mustard stalks across seasons so that a unit runs year round on a better mix.
    4. Competition from existing straw buyers: A village unit competes for the same straw as large plants that already pay for it. Eg. The Verbio compressed biogas plant at Lehragaga in Sangrur, Punjab, consumes about one lakh tonnes of paddy straw a year.
      The Fix: Site biochar units in blocks beyond the collection radius of existing CBG and pellet plants, using the State’s straw balance map.
    5. Window mismatch: Straw arrives in three weeks and a unit needs feedstock for months. Eg. Punjab’s paddy harvest runs through late October and wheat sowing closes by mid-November.
      The Fix: Subsidise baling and covered storage at the processing point under the crop residue scheme so that processing continues after the window closes.

    Conclusion

    The policy question on parali has moved from stopping a practice to locating a market, and the location decides who captures the value. Village-scale processing answers that question only if quality, emissions and offtake are secured before the technology provider exits. The next window is the October to November harvest. Whether any State pairs its residue management subsidies with village-level processing points is the thing to watch.

    Stubble Burning in India

    1. What it is: Stubble burning is the practice of setting fire to the straw residue left in fields after harvest, especially paddy, to clear the land quickly for the next sowing.
    2. Where and when: It is concentrated in Punjab, Haryana, Uttar Pradesh and the National Capital Region during the post-monsoon October to November window.
    3. Why it happens: The narrow gap between paddy harvest and wheat sowing pushes farmers toward the cheapest and fastest clearing method.
    4. Scale: Punjab alone generates about 20 million tonnes of paddy straw a year.

    Challenges in Stubble Burning

    1. Episodic air pollution: Burning sharply aggravates the Air Quality Index across the Indo-Gangetic Plain within days. Eg. In December 2025 Delhi’s AQI crossed 500 and over 150 flights were delayed.
      The Fix: Front-load machine deployment in the fortnight before harvest with block-level fire targets monitored by satellite.
    2. Soil degradation: Burning destroys beneficial soil microbes, nitrogen and organic carbon. Eg. Each tonne of burnt paddy straw loses about 5.5 kg of nitrogen, 2.3 kg of phosphorus and 25 kg of potassium.
      The Fix: Pay a per-acre incentive for in-situ incorporation with Happy Seeder or Super Seeder, verified by satellite.
    3. Meteorological trap: Winter temperature inversions and calm winds prevent dispersal and compound the damage. Eg. Delhi invoked Stage IV of the Graded Response Action Plan in November 2024 when the AQI crossed 450.
      The Fix: Time enforcement and straw collection to the weeks before inversions set in rather than to the pollution peak.
    4. Paddy-centric cropping in a water-stressed region: Free farm power and assured procurement lock Punjab into paddy. Eg. About three fourths of Punjab’s groundwater assessment units are over-exploited as per the Central Ground Water Board.
      The Fix: Offer a per-hectare diversification incentive for maize and pulses with assured procurement so that the residue problem shrinks at source.
    5. Penalty without a price: Enforcement fines farmers who have no cheaper alternative. Eg. Environmental compensation for burning was doubled in November 2024 to Rs 5,000 for under two acres, Rs 10,000 for two to five acres and Rs 30,000 above five acres.
      The Fix: Pair the penalty with a guaranteed straw purchase price at the block level so that not burning is the cheaper option.

    “[2025, GS3, 10 marks] What is Carbon Capture, Utilization and Storage (CCUS)? What is the potential role of CCUS in tackling climate change?”

  • All animals need equal consideration

    All animals need equal consideration

    Why in the News

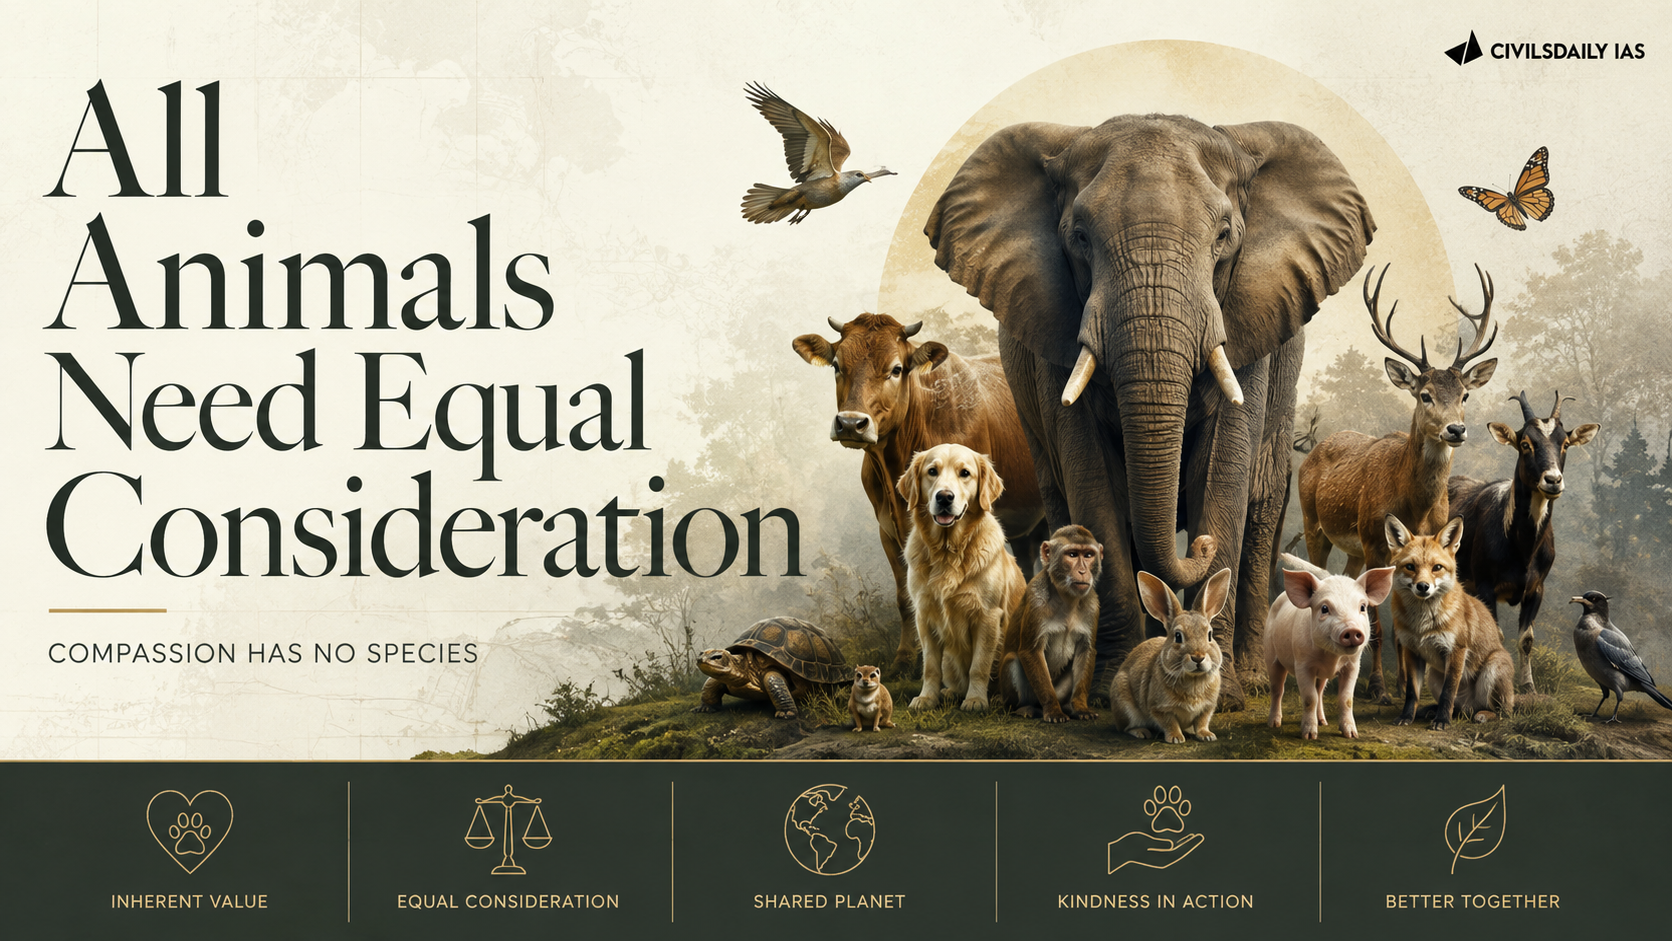
    A division Bench of the Supreme Court has ordered the Keralam government to take custody of Raman, Keralam’s tallest elephant, in Jayakrishna Menon vs. Krishnankutty & Ors. The Bench observed that the court cannot remain a mute spectator in matters concerning animals and that their wellbeing is of “paramount importance”. It held that it would fail in its duty towards “voiceless animals” if it ignored the elephant’s continued use for temple activities after its own prohibition. The order stands in contrast with Re: City Hounded by Strays, Kids Pay Price (2026). There a three judge Bench adopted a much narrower interpretation of the law. That reading led to the removal of large numbers of dogs from public institutions. The divergence raises the question whether Indian animal law grades animals by their value to humans rather than by their capacity to suffer.

    What is equal consideration?

    1. The principle: Framed by moral philosopher Peter Singer, equal consideration holds that the basic principle of equality does not require equal or identical treatment; it requires that the interests of each being be weighed equally.
    2. Who qualifies: Every being that has interests, some subjective awareness, or the capacity to feel pleasure or pain.
    3. Different treatment can follow: Equal consideration for different beings can lead to different treatment and different rights, because their needs differ.

    What questions does the differential treatment of two animals raise?

    1. The court’s own premise: The elephant order implicitly acknowledges an animal’s propensity to suffer and the need to ensure its wellbeing.
    2. One elephant against lakhs of dogs: Why one elephant’s wellbeing is of paramount importance and the welfare of lakhs of street dogs is disregarded.
    3. One institution, two approaches: How the same institution adopts two contrasting, if not contradictory, approaches to issues involving similar moral considerations.
    4. Whether courts should decide at all: Whether the judiciary is the best positioned institution to decide cases that seal the fate of animals, for better or for worse.

    Do the differences between the two animals justify different consideration?

    1. The elephant’s legal standing: The Indian elephant is a charismatic animal, listed as Endangered on the International Union for Conservation of Nature (IUCN) Red List, and explicitly protected under the Wild Life (Protection) Act, 1972.
    2. The street dog’s legal standing: The street dog is legally perceived as a problem that needs to be tackled.
    3. Different relationships with humans: One is expected to live in the wild away from human habitation. The other shares public spaces, requiring humans to learn to coexist in shared spaces.
    4. The test: Whether these differences are significant enough to attract completely different moral and legal considerations.
    5. What is actually missing: In the two judgments the absence of equal consideration itself drives the differential treatment. Equal consideration would require an assessment of the needs of each animal and then the determination of a course of action.

    Why does the remedy lie with Parliament rather than the courts?

    1. Anthropocentric bias in both statutes: The Wild Life (Protection) Act, 1972 for elephants and the Prevention of Cruelty to Animals Act, 1960 for street dogs evaluate the worth of animals by their value to humans. That valuation determines the nature and level of protection each animal receives.
    2. A gap in legislative guidance: Two cases involving different animals produced contrasting approaches from the same court. That exposes the absence of a legislative standard for animal well-being across legal categories.
    3. The Swiss model, cited in passing: The Swiss Constitution ensures the well-being of animals and also protects animal dignity, granting animals an inherent worth.
    4. Parliament’s responsibility: Parliament should extend protection to every being worthy of moral consideration, through a legislative foundation that provides moral consideration to all animals and pathways for ethical coexistence.

    Challenges to an equal consideration standard in Indian animal law

    1. Fragmented statutes: The same act of harm is governed by different laws depending on the animal’s legal category, so no single test of suffering applies. Eg. Street dogs fall under the Animal Birth Control Rules, 2023 made under the cruelty law, and elephants fall under Schedule I of the wildlife law.
      The Fix: Enact a single animal welfare code with a sentience-based standard that applies across categories, with the wildlife schedules layered on top for conservation purposes.
    2. Nominal penalties: Section 11 of the Prevention of Cruelty to Animals Act, 1960 punishes a first cruelty offence with a fine of Rs 10 to Rs 50, unchanged since enactment. Eg. The draft Prevention of Cruelty to Animals (Amendment) Bill, 2022 proposed fines up to Rs 75,000 and imprisonment for gruesome cruelty and has not been introduced in Parliament.
      The Fix: Introduce the amendment Bill with graded penalties and a statutory definition of sentience.
    3. Unsettled legal status of animals: High Courts and the Supreme Court have taken different positions on whether animals are legal persons, so lower courts have no stable rule. Eg. The Uttarakhand High Court in Narayan Dutt Bhatt v. Union of India (2018) and the Punjab and Haryana High Court in Karnail Singh v. State of Haryana (2019) declared animals legal persons, a status no Supreme Court ruling has endorsed.
      The Fix: Settle the legal status of animals in statute rather than leaving it to divergent judicial declarations.
    4. No enforcement arm: The Animal Welfare Board of India is advisory, and district level societies exist on paper. Eg. The Prevention of Cruelty to Animals (Establishment and Regulation of Societies for Prevention of Cruelty to Animals) Rules, 2001 require a society in every district, and many districts have none.
      The Fix: Fund district societies from State budgets with mandated veterinary and inspector staffing and a reporting line to the State Animal Welfare Board.

    Conclusion

    The two rulings leave a tension unresolved. Indian animal law protects by category, endangered species on one side and nuisance animals on the other, and the capacity to suffer sits on neither side of that line. A court can decide the case before it; it cannot write a standard that applies to every animal. The thing to watch is whether Parliament takes up the pending amendment to the cruelty law and whether it writes sentience, rather than human utility, into the test.

    Animal Welfare Law in India

    1. What it covers: Statutory protection of animals from cruelty and of wild species from harm, spread across a cruelty statute, a wildlife statute and subordinate rules for specific uses such as transport, slaughter, performance and experiments.
    2. Two regimes: The cruelty law applies to any animal, domestic, captive or stray. The wildlife law protects species by schedule, and the Wild Life (Protection) Amendment Act, 2022 reduced the schedules from six to four.
    3. Institutions: The Animal Welfare Board of India (statutory since 1962), the Committee for Control and Supervision of Experiments on Animals for laboratory use, and the National Board for Wildlife for protected species.
    4. Scale: India holds about 60 percent of the world’s Asian elephants, with 29,964 counted in the 2017 synchronised census, and the 20th Livestock Census (2019) counted 1.53 crore stray dogs.

    Challenges in Animal Welfare

    1. Rabies from an unmanaged stray population: Sterilisation and vaccination have not reached the coverage that stops transmission. Eg. India accounts for about 36 percent of global rabies deaths as per the World Health Organization.
      The Fix: Fund local bodies to reach 70 percent vaccination coverage of the dog population in each ward, since transmission breaks at that threshold.
    2. Captive elephants at festivals: Parading in heat, crowds and noise causes injury and deaths of animals and people. Eg. The Kerala High Court’s 2024 guidelines on distance and rest norms for parading elephants were contested before the Supreme Court by festival organisers.
      The Fix: Enforce microchip registration and the 2024 transfer rules so that every captive elephant has a traceable owner accountable for its welfare.
    3. Culture against welfare: Traditional events with animals are permitted by State amendments to the cruelty law. Eg. A five judge Bench in Animal Welfare Board of India v. Union of India (2023) upheld Tamil Nadu’s Jallikattu amendment.
      The Fix: Codify measurable welfare conditions for each permitted event under the Performing Animals rules, with veterinary supervision as a licence condition.
    4. Regulation of livestock trade: Welfare rules for animal markets have collapsed under political contest. Eg. The Prevention of Cruelty to Animals (Regulation of Livestock Markets) Rules, 2017 were stayed by the Supreme Court and withdrawn in 2018.
      The Fix: Re-notify market rules confined to welfare conditions such as water, shade and transport limits, without conditions on the purpose of sale.

    “[2022] Which one of the following has been constituted under the Environment (Protection) Act, 1986 ?

    (a) Central Water Commission

    (b) Central Ground Water Board

    (c) Central Ground Water Authority

    (d) National Water Development Agency

  • [2nd September 2026] The Hindu OpED: The two balance sheets behind every e-waste decision

    [2nd September 2026] The Hindu OpED: The two balance sheets behind every e-waste decision

    Question (2018): “What are the impediments in disposing the huge quantities of discarded solid wastes which are continuously being generated? How do we remove safely the toxic wastes that have been accumulating in our habitable environment?
    Linkage: Discarded computers, servers, and networking systems are a rapidly growing source of toxic and solid electronic waste. This question directly addresses the core administrative and logistical bottlenecks that prevent advanced recycling from becoming the default choice in India.

    Mentor Comment

    Governments and companies replace thousands of computers, servers, networking devices and storage systems every few years, and this discarded equipment holds copper, aluminium, gold, silver, palladium and critical minerals. Advanced recycling of such equipment has still not become the default choice in India. The reason is that procurement in both the public and private sectors rewards the lowest visible cost at the point of disposal. Every disposal decision creates two balance sheets, one financial and closed with the transaction, the other strategic and open long after it. The lowest-price principle that secures transparency and fiscal discipline in public procurement now sits in tension with the lifetime cost of decisions in electronics, batteries and renewable energy.

    What is urban mining?

    1. Definition: Urban mining is the recovery of valuable materials from products that have already served their purpose, in place of extracting fresh ore from the earth.
    2. The ore body: Discarded IT equipment is among the largest untapped sources of strategic raw materials as economies digitise, and it is hazardous waste when poorly handled.
    3. What safe recovery needs: Sophisticated technology, secure data destruction, environmentally compliant processing and traceable supply chains, with collection and segregation adding to the cost.

    Why has advanced recycling not become the default choice in India?

    1. Procurement rewards the lowest visible cost: Public and private buyers maximise resale value and minimise processing cost when they dispose of equipment.
    2. Strategic value stays off the invoice: Recovery of critical minerals, secure data destruction, environmental benefit and domestic industrial capability rarely appear in the price that decides the contract.
    3. The gains accrue to others: Less virgin mining, stronger domestic supplies of critical materials, lower import dependence and responsible handling of hazardous components are benefits the disposing organisation does not book.

    What are the two balance sheets every disposal decision creates?

    1. The first, financial and immediate: Purchase price, resale value and savings achieved, all measurable, auditable and reflected in annual budgets.
    2. The second, strategic and open ended: It stays open long after the transaction and records resource security, environmental sustainability, industrial capability, supply-chain resilience, public health and national competitiveness.
    3. Good governance manages both: Some investments look expensive at first and later transform economies. Eg. Fifteen years ago solar power struggled to compete with conventional electricity on cost and governments that invested early were criticised for paying too much. Scale and learning have since made solar one of the world’s cheapest sources of electricity, and countries that built manufacturing capacity early hold advantages a cost comparison could not have predicted.

    How do the costs left off the invoice return later?

    1. Recovery priced against disposal: Investment in urban mining infrastructure looks expensive when judged only against the cost of disposing of a computer. The calculation changes when recovered materials, avoided imports, environmental safeguards, data security and future industrial capability are counted together.
    2. Pollution becomes health-care expenditure: The public health cost of unsafe processing lands on the exchequer years after the disposal saving was booked.
    3. Resource depletion becomes import dependence: Metals not recovered at home are bought abroad, raising manufacturing costs.
    4. Weak domestic capability becomes strategic vulnerability: An economy without recovery capacity depends on others for the materials its industry runs on.
    5. Environmental costs turn economic: Governments spend more on remediation, businesses face higher compliance costs and citizens pay through taxes and lost productivity. The costs are delayed or redistributed and rarely avoided.

    What should an organisation ask before selecting a recycler?

    1. Secure data destruction: Whether sensitive data on the equipment is securely destroyed before any material moves.
    2. Refurbishment before recycling: Whether working equipment is refurbished for reuse before it is broken down for materials.
    3. Efficient and transparent mineral recovery: Whether critical minerals are recovered efficiently and the recovery is traceable.
    4. The cost of skipping the questions: A marginal gain today becomes tomorrow’s cybersecurity risk, import dependence, reputational damage and permanent loss of strategic resources.

    Can the lowest-price principle survive in sectors where acquisition cost is not lifetime cost?

    1. What the principle protects: Governments have relied on the lowest-price rule to ensure transparency and fiscal discipline in public spending.
    2. Where it fails: Renewable energy systems, batteries, electronics and advanced manufacturing are sectors where the lowest acquisition cost is rarely the lowest lifetime cost.
    3. The alternative many countries have adopted: Life-cycle costing (pricing an option across purchase, operation, disposal and recovery rather than at purchase alone) and value-based procurement ask which option delivers the greatest long-term public value. Procurement then becomes a tool of industrial policy that shapes which technologies scale and which capabilities are built.
    4. The same logic in compliance markets: Judging Extended Producer Responsibility (EPR, the obligation on a producer to finance the collection and recycling of the products it sells) compliance on the cheapest available certificate rewards the lowest-cost provider over the highest-quality outcome. Rewarding traceability, recovery efficiency and technological capability would instead draw investment into advanced recycling and strengthen India’s domestic supply of critical minerals.

    Challenges to urban mining of e-waste in India

    1. Fake certificates break traceability: An EPR certificate market cannot reward quality when the certificates themselves are unverified. Eg. The Central Pollution Control Board (CPCB) found over 600,000 fake recycling certificates in 2023 across Gujarat, Maharashtra, Karnataka.
      The Fix: Digitise certificate tracking against audited mass balance at each registered recycler, with cancellation of registration for a fake certificate.
    2. A floor price too low to sustain formal recycling: EPR pricing set below the cost of compliant recovery pushes material to informal and fraudulent channels. Eg. In April 2025 Daikin, Hitachi and Samsung sued the government opposing the mandated minimum recycler price.
      The Fix: Index the floor price to the audited cost of compliant recovery and revise it annually through a published formula.
    3. Inefficient recovery loses the minerals the policy exists to secure: Crude recycling wastes lithium, cobalt, nickel, copper, gold and silver. Eg. Improper battery handling alone could cost India over USD 1 billion in foreign exchange by 2030.
      The Fix: Fund research in advanced shredding, bioleaching and non-thermal recovery and tie EPR credit to recovery efficiency rather than to tonnage collected.
    4. No domestic refining of precious metals: Indian recyclers dismantle equipment and export the printed circuit boards, so the highest-value step happens abroad. Eg. Circuit boards from Indian dismantlers are shipped to integrated smelters in Belgium, Japan and South Korea for gold and palladium refining.
      The Fix: Mandate a minimum domestic refining share within EPR targets and treat integrated refining as eligible infrastructure under the critical mineral recycling incentive.

    Conclusion

    India’s discarded IT equipment will become either a strategic reserve or an environmental liability, and the deciding instrument is the procurement rule rather than the recycling technology. The reform that follows is to score public disposal tenders on lifetime value. That means amending the General Financial Rules, 2017, the rules for central procurement, so that a tender can weigh quality of recovery against the immediate price. The unresolved question is who pays: the buyer who funds advanced recycling is not the one who gains from resource security, and no mechanism yet closes that gap.

    E-Waste Management in India

    1. Scale: As per the CPCB, India generated 14,14,645 metric tonnes (about 1.41 million tonnes) of e-waste in 2025-26 till March 2026, of which 9,79,080 metric tonnes (about 0.98 million tonnes) was recycled.
    2. Global standing and growth: India is the third largest generator behind China and the United States. Volumes surged over 150 percent in six years from 0.71 million tonnes in 2017-18 and are projected to nearly double by 2030.
    3. Formal capacity: 386 registered recyclers across 19 States and Union Territories offer a capacity of about 34.66 lakh metric tonnes per annum.
    4. Concentration: Just 65 cities generate over 60 percent of total e-waste, and 10 States account for around 70 percent.

    Laws and Rules Governing E-Waste Management

    1. Environment (Protection) Act, 1986: The parent statute under which every set of e-waste rules is notified.
    2. E-Waste (Management) Rules, 2016: Introduced the Producer Responsibility Organisation (PRO) concept.
    3. E-Waste (Management) Rules, 2022: Make EPR the core engine, mandate registration of all producers, refurbishers and recyclers on the CPCB portal, and expand coverage from 21 to 106 electrical and electronic equipment items.
    4. E-Waste (Management) Second Amendment Rules, 2023: Added provisions for safe, sustainable refrigerant management in refrigeration and air-conditioning manufacturing.
    5. E-Waste (Management) Amendment Rules, 2024: Enabled CPCB supervised platforms for trading EPR certificates, priced between 30 percent and 100 percent of the environmental compensation for non-compliance.
    6. Hazardous and Other Wastes (Management and Transboundary Movement) Amendment Rules, 2025: Introduced an EPR framework for non-ferrous metal scrap, with targets rising from 10 percent in 2026-27 to 75 percent in 2032-33.
    7. Basel Convention, 1989: India is a signatory to this treaty limiting the transboundary movement of hazardous waste, including e-waste.

    Challenges in E-Waste Management

    1. Informal-sector dominance: Over 50 percent of e-waste is handled informally through open-air burning and acid leaching, exposing workers and residents to respiratory illness, neurological damage and DNA damage. Eg. Acid leaching of circuit boards in Moradabad releases toxic slurry into the Ramganga and local groundwater.
      The Fix: Train waste-pickers as certified green collar technicians with protective gear, certification and links to healthcare, insurance and pensions.
    2. Illegal imports: Developed nations export e-waste to India under cover of used goods. Eg. 29 illegal-import instances were identified during 2019-22 across Tamil Nadu, Maharashtra, Gujarat, West Bengal and Uttar Pradesh.
      The Fix: Pre-shipment inspection of used electronics consignments at ports under the Basel Convention notification procedure.
    3. Low awareness in the trade itself: The people who handle discarded electronics first do not know the rules. Eg. A 2021 Delhi study found 70 percent of repair workers and 79 percent of scrap dealers unaware of e-waste rules.
      The Fix: Run registration and awareness campaigns through resident welfare associations and self-help groups linked to registered collection points.
    4. Uneven infrastructure: Recycling capacity and expertise are concentrated in a few States. Eg. Telangana has built formal capacity, and Chandigarh lacks formal facilities.
      The Fix: Set up decentralised recycling hubs in every State with a collection target tied to the State’s generation share.
  • National Biodiversity Authority disburses Rs. 5.68 Crore in Access and Benefit Sharing funds

    National Biodiversity Authority disburses Rs. 5.68 Crore in Access and Benefit Sharing funds

    Why in the News

    The National Biodiversity Authority (NBA) disbursed Rs. 5.68 crore in Access and Benefit Sharing (ABS) funds.

    Core facts

    1. Disbursing body: The National Biodiversity Authority (NBA) released the funds.
    2. Amount: The verified headline figure is Rs. 5.68 crore, drawn from the release title.
    3. Mechanism: ABS returns a share of the commercial gains from biological resources to the communities and institutions that conserve them.
    4. Unverified detail: The recipient states, institutions and the per beneficiary split stated in the release body could not be verified this run. PRID 2304759.

    Static Context

    1. Biological Diversity Act, 2002: It gives effect to the Convention on Biological Diversity (CBD). It created a three tier structure.
    2. Three tier structure: The National Biodiversity Authority (NBA) sits at the national level. State Biodiversity Boards (SBBs) sit at the state level. Biodiversity Management Committees (BMCs) sit at the local body level.
    3. Access and Benefit Sharing: The principle flows from the Nagoya Protocol of 2010, a supplementary agreement to the CBD on fair and equitable sharing of benefits from genetic resources.
    4. Biopiracy check: The NBA regulates access to Indian biological resources by foreign entities. It clears Intellectual Property Rights (IPR) applications based on Indian biological material.
    5. 2023 amendment: The Biological Diversity (Amendment) Act, 2023 eased compliance for codified traditional knowledge and registered practitioners of Indian systems of medicine.

    Prelims angle

    The three tier NBA, SBB and BMC structure, the BMC role in ABS and the levy of collection fees, the Nagoya Protocol link, and the NBA gatekeeping of IPR applications are the testable static hooks.

    Mains angle

    GS Paper 3 (conservation, biodiversity governance). A question can assess whether the ABS mechanism delivers real incentives for community level conservation.

    “[2023] Consider the following statements:

    1. In India, the Biodiversity Management Committees are key to the realization of the objectives of the Nagoya Protocol.

    2. The Biodiversity Management Committees have important functions in determining access and benefit sharing, including the power to levy collection fees on the access of biological resources within its jurisdiction.

    Which of the statements given above is/are correct?

    (a) 1 only

    (b) 2 only

    (c) Both 1 and 2

    (d) Neither 1 nor 2

    “[2012] How does the National Biodiversity Authority (NBA) help in protecting the Indian agriculture?

    1. NBA checks the biopiracy and protects the indigenous and traditional genetic resources.

    2. NBA directly monitors and supervises the scientific research on genetic modification of crop plants.

    3. Application for Intellectual Property Rights related to genetic/biological resources cannot be made without approval of NBA.

    Which of the statements given above is/are correct?

    (a) 1 Only

    (b) 2 and 3 only

    (c) 1 and 3 only

    (d) 1, 2 and 3

  • What two districts can teach us about dealing with rural waste

    What two districts can teach us about dealing with rural waste

    Why in the News

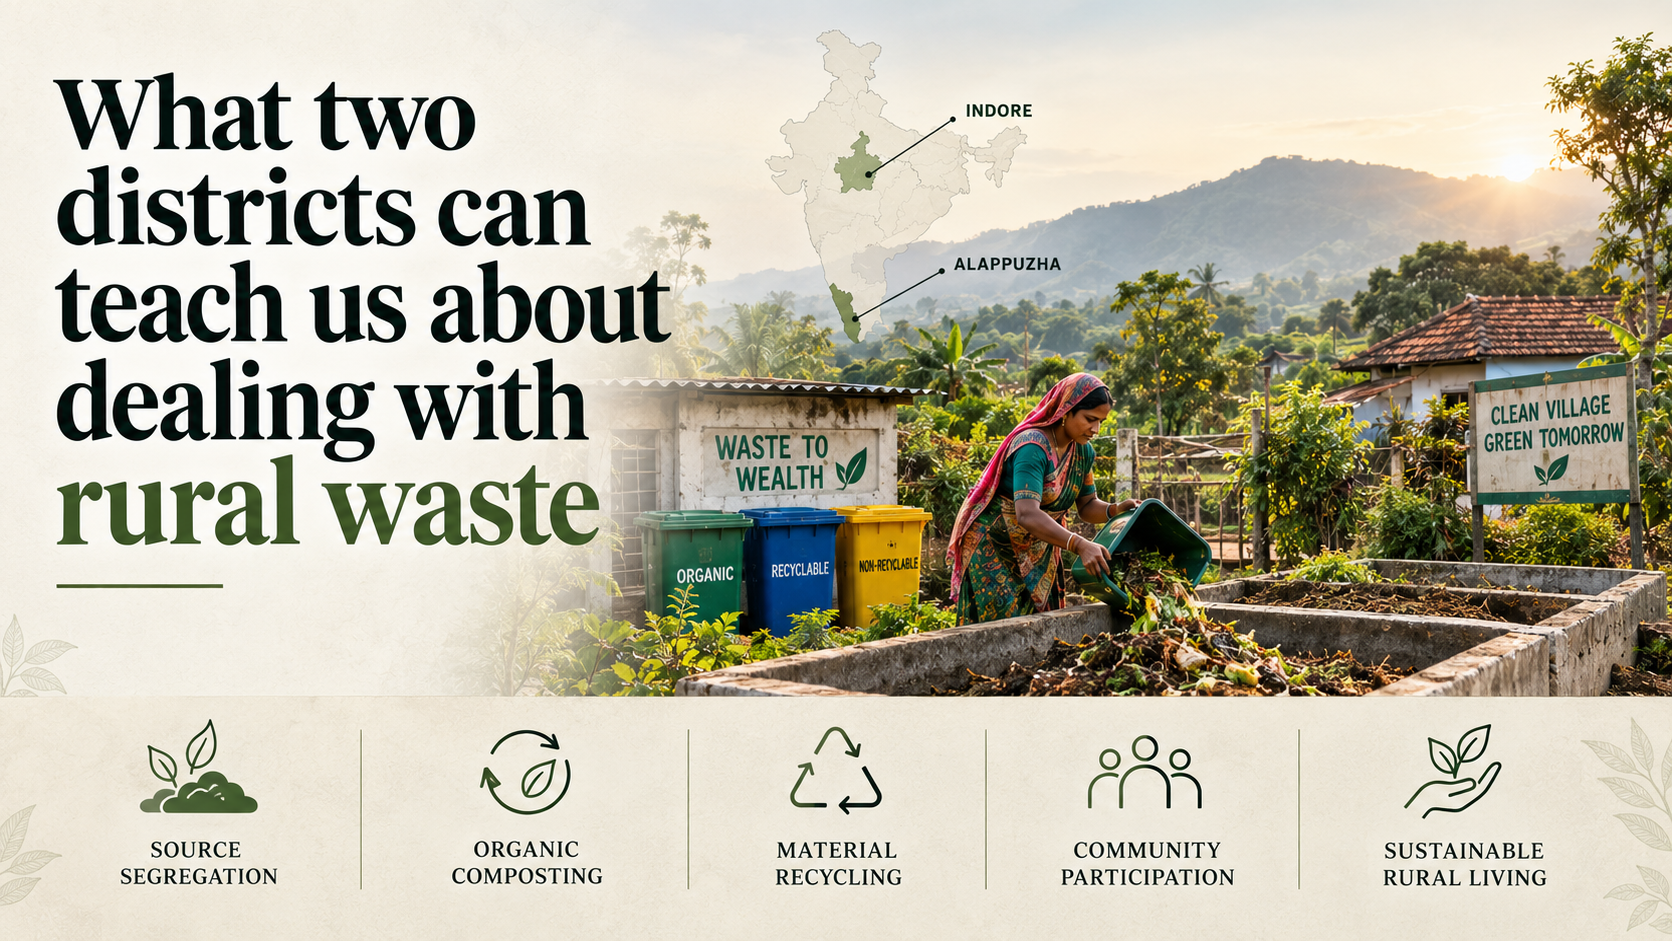
    The Supreme Court has demanded functional waste regulators, exposing weak institutionalisation. While India generates 1.7 lakh tonnes daily, successful community systems in Majuli and Tawang show operational gaps, especially rurally.

    Why does India’s waste system not see the countryside?

    1. Rural waste data are not collected: Waste data for rural areas do not exist, according to the Centre for Science and Environment (CSE), a New Delhi based research and advocacy body.
    2. The duty sits with bodies that do not discharge it: Urban and rural local bodies are tasked with solid waste management and with recording volumes and expenses, and they rarely do the needful.
    3. The gap is global and overwhelmingly rural: Around 2.7 billion people worldwide have no waste collection, and 2 billion of them live in rural areas, per an analysis by the United Nations Environment Programme (UNEP).
    4. Uncollected waste goes to land, water or fire: Where people cannot manage waste, they dump it on land or in rivers, streams and seas, or they burn it, which is a major concern in India.

    Why has rural waste grown without collection following it?

    1. Rural spending has risen: Data show a rise in per capita spending in India’s rural areas, and more consumption produces more waste.
    2. Packaging reached the remotest markets: Food, beverages and personal care or hygiene products are almost all wrapped in plastics or multi layered packaging, and those goods have penetrated the remotest rural markets.
    3. Waste management did not follow the goods: Collection systems did not extend into those markets alongside the products that created the waste.
    4. Organic waste had a use and mixed waste does not: Organic waste fed livestock or served as manure for centuries, and plastics and other non-biodegradable materials have produced a mixed waste that is harder to decompose.

    What did Majuli change after its facilities went unused?

    1. The sheds were built years before the system was: The Swachh Bharat Mission and the Public Health Engineering Department built Central Material Collection Facilities (CMCFs), the village level sheds where sorted waste is received and stored, in 19 of 20 panchayats between 2017 and 2022, along with mini collection facilities in most of the 160 villages.
    2. Neither the sheds nor the workers were put to use: The tin sheds went unused and the workers were not mobilised until the departments teamed up with the waste management non-profit Sahaas in 2024.
    3. The missing components were operational rather than physical: Funding, staffing and training of sanitation workers, vehicles for transport, operation of the collection facilities and buyers for the sorted material all had to be arranged.
    4. Participation was organised before collection began: Village leaders, homestay and hotel owners, schools and self-help groups (SHGs) ran awareness programmes and handed out bags for storage and segregation.
    5. Collection now runs in 19 of 20 panchayats: Garbage is now collected across them, in a district that faces flooding and erosion every year.
    6. Staffing remains thin against the population: Majuli’s 1.67 lakh people are served by 37 sanitation workers and 19 sorting staff.
    7. The fleet was funded only recently: The district departments purchased 21 e-vehicles and 15 tricycles and approved funds for the collection crew.
    8. The first river crossing was in April 2025: A tonne of waste left Majuli by boat across the Brahmaputra, the first time the island’s waste crossed the river instead of being dumped into it.
    9. The tonnage is now measurable: Majuli has collected 82.4 tonnes of waste since 2024, and it transferred 16.78 tonnes and earned Rs 1.47 lakh between April 2025 and May 2026.

    How does Tawang collect waste without sanitation workers?

    1. Scattered settlements rule out door to door collection: Households in these land-locked mountain villages sit too far apart for a sanitation worker to cover on a route.
    2. The pilot began in one village in 2024: Local officials and village leaders piloted a community led model in Chullyu in Keyi Panyor district through the Himalayan Fringes Project of the Further and Beyond Foundation.
    3. It spread across three districts in two years: A third of Tawang district and parts of Keyi Panyor and Upper Siang districts have adopted the model.
    4. Households store their own waste: Every household segregates biodegradable from non-biodegradable waste and keeps it at home until the collection day.
    5. Collection is a monthly village event: Each village organises a Swachchata Divas, or Cleanliness Day, at a designated point where residents arrive with sacks and sort the waste into 22 categories.
    6. The volumes are recorded: 26 villages in the project have organised more than 150 Swachchata Divas and collected 30 tonnes of waste.
    7. Secondary sorting happens at recovery facilities: The waste moves to material recovery facilities (MRFs), the sites where it is received, sorted and processed, at Zemithang, Lumla and Daporijo, with smaller community run facilities at Chullyu and Gobuk.
    8. Sorting deepens to 35 categories there: 12 full time MRF operators and dozens of women from self-help groups perform that second sort.
    9. Sanitary waste is handled rather than dumped: Sanitary napkins and diapers are washed, dried and stored at the facilities, and more than 20 tonnes have been sold to recyclers for Rs 3.53 lakh.
    10. One residue stream found a local use: About two tonnes of multi layered plastics went to a processing plant at Lhou in Jang sub-division and were used to make paver blocks.
    11. The first consignment left on Independence Day 2024: Villagers from Zemithang Circle, settled between 6,900 and 8,000 feet, sent 4.4 tonnes of garbage on a 390 km lorry journey of over 12 hours to scrap dealers in Tezpur in Assam.

    Who pays for rural collection, and who is accountable for it?

    1. Collection is the most expensive step in the chain: Crew wages, vehicle fuel and maintenance, insurance and other indirect costs make it the costliest link, per UNEP.
    2. Indian cities show the same cost structure: Primary collection and transportation account for the bulk of costs, per a CSE report on plastic waste management.
    3. Manpower dominates the rural cost: Nearly 50 per cent of the primary collection cost in rural Dharamshala was attributed to manpower.
    4. The Tawang model removes that cost line: Eliminating sanitation workers and door to door collection took the largest single expense out of the system.
    5. Households pay a monthly fee: Each household pays Rs 50 a month and shops and cafes pay Rs 100.
    6. Authority is vested in a village committee: A gaon bura, or village head, and a treasurer lead committees that draft waste management policies and set the rules, responsibilities and fines.
    7. A regional committee sits above them: Each region has a central committee chaired by a Circle Officer with a Lama, an influential religious leader, as secretary, and the committees meet every quarter.
    8. Financing remains the binding constraint: Money is the biggest problem in running such a system, per the officer who led the Zemithang effort.

    Where does the chain still break?

    1. Distance sets the transport economics: Waste travels farther from rural areas to reach recyclers, which renders the task less attractive for scrap dealers.
    2. One truckload costs Rs 45,000: Sending a truckload from Arunachal Pradesh to Assam costs that much, and fuel and the driver still cost Rs 20,000 a trip after State officials donated a truck.
    3. Boat transfers proved too costly to repeat: Majuli made three transfers across the Brahmaputra and now sells to local scrap dealers as well.
    4. Two streams have no buyer at all: Black polythene and textile scrap have found no takers.
    5. Storage is filling faster than offtake: Many CMCFs are filling up quickly, and rural collection facilities are commonly found full of baled waste with few takers.
    6. Processing capacity sits idle: Majuli’s long defunct plastics management facility is undergoing repairs.
    7. Segregation compliance is not universal: About 30 households in every 100 still hand over mixed waste.

    Challenges to rural solid waste management

    1. Panchayats have no funded sanitation establishment: A rural local body carries the duty without a permanent staffing line or a recurring budget head for waste, so the work depends on scheme money and an outside partner. Eg. Solid and liquid waste management money for gram panchayats arrives through Swachh Bharat Mission Grameen allocations and tied Fifteenth Finance Commission grants rather than through an own-source revenue stream.
      The Fix: Make a collected user fee a mandatory own-source revenue head for the panchayat, and release the matching grant only against fee actually collected.
    2. Legacy rural dumps are not inventoried: Remediation and bio-mining targets are written for urban dumpsites, so village dumps sit outside any list anyone is accountable for clearing. Eg. Dumpsite remediation targets under the second phase of the Swachh Bharat Mission are set for urban local bodies.
      The Fix: Require every gram panchayat development plan to carry a mapped inventory of existing dump points with a dated clearance commitment.
    3. Producer responsibility is verified on paper: A packaging producer discharges its obligation by buying a recycling certificate, and the certificate is easier to obtain than the collection is to perform. Eg. The CPCB has cancelled extended producer responsibility certificates issued by recyclers whose claimed processing capacity could not be verified.
      The Fix: Tie certificate issue to plant level input and output data reported from the processor’s own weighbridge.
    4. Rural sanitation work carries no protection: Workers handle mixed waste, including sanitary and medical items, without the equipment, registration or insurance that municipal employment carries. Eg. Rural collection crews are engaged on scheme funds rather than on a municipal payroll, which leaves them outside standing occupational safety obligations.
      The Fix: Register every rural sanitation worker on a State database and make supply of protective equipment a condition of releasing collection funds.
    5. Reported waste figures have no verification layer: Where a local body does report a number, no independent audit checks it against what a facility actually received. Eg. Swachh Survekshan Grameen scoring rests substantially on self-declared and observation based inputs rather than on weighed tonnage.
      The Fix: Make weighbridge or facility receipt records the reporting unit, and publish district level tonnage every month.

    Conclusion

    Rural India’s waste challenge is fundamentally an operational gap, not an infrastructure gap. Majuli and Tawang show that community-led collection can work, but sustained funding, accountable institutions, worker protection and reliable recycling markets are essential for a truly circular rural waste system.

    Back2Basics: Solid Waste Management Rules, 2016

    1. Legal basis: Notified by the Union Ministry of Environment, Forest and Climate Change under the Environment (Protection) Act, 1986, replacing the Municipal Solid Wastes (Management and Handling) Rules, 2000.
    2. Coverage beyond municipalities: They extend to census towns, notified industrial townships, and areas under railways, airports, defence establishments, special economic zones and places of pilgrimage.
    3. Source segregation is mandatory: A waste generator must separate waste into wet, dry and domestic hazardous streams and hand it to an authorised collector.
    4. Producers carry a post-consumer duty: Brand owners and manufacturers of non-biodegradable packaging must arrange to collect that packaging back from the market.

    [2019] As per the Solid Waste Management Rules, 2016 in India, which one of the following statements is correct?

    (a) Waste generator has to segregate waste into five categories.

    (b) The Rules are applicable to riotified urban local bodies, notified towns and all industrial townships only.

    (c) The Rules provide for exact and elaborate criteria for the identification of sites for landfills and waste processing facilities.

    (d) It is mandatory on the part of waste generator that the waste generated in one district cannot be moved to another district.

  • Deadly span

    Deadly span

    Why in the News

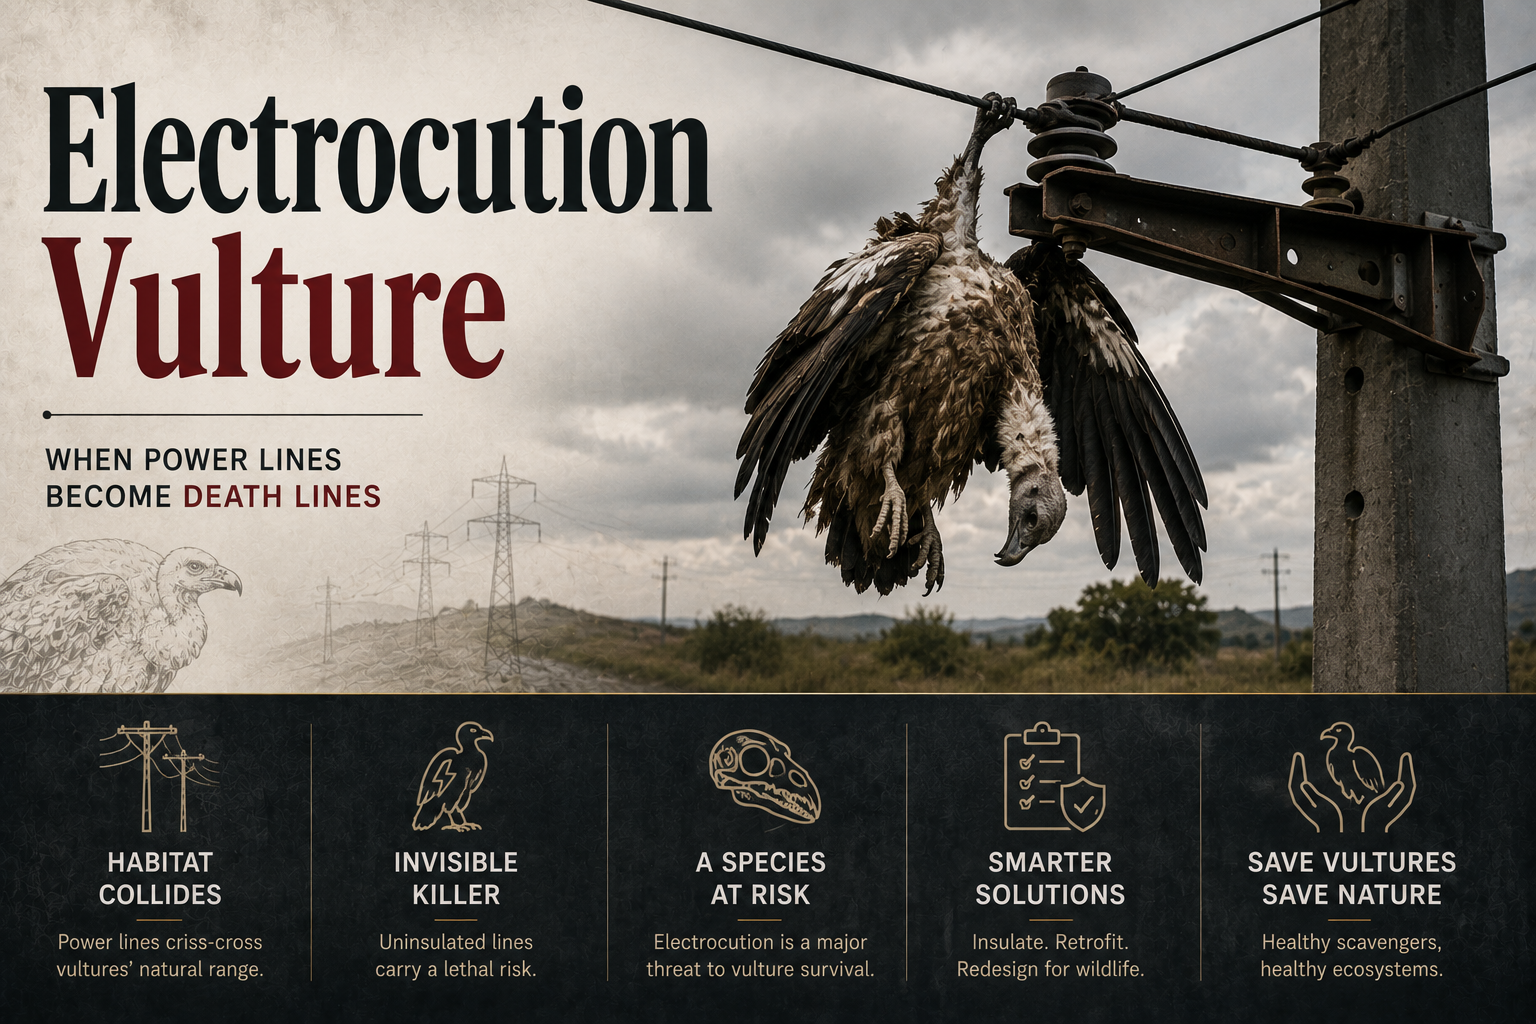
    Electrocution on India’s expanding power infrastructure is emerging as a threat to vultures capable of overtaking the chemical poisoning that caused their collapse.

    How far did the chemical crash take India’s vultures?

    1. The loss was among the world’s worst recorded: Numbers fell by 99.5 per cent by 2007 from a high of around four crore in the 1980s.
    2. Three species were nearly wiped out: The white-rumped, Indian and slender-billed vultures were the worst affected.
    3. The cause was a veterinary painkiller: Diclofenac administered to cattle destroyed the kidneys of vultures that fed on the carcasses.
    4. The regulatory response came in stages: The government banned diclofenac first, then added bans in 2023 on aceclofenac and ketoprofen among other NSAIDs.
    5. The population has not returned: One official survey reported in 2025 that vultures were nesting at only 50 per cent of their historic nesting sites.

    What did the collapse cost beyond the birds?

    1. Carcasses stayed exposed for longer: The loss of scavengers left livestock carcasses in the open, which supported feral dog populations.
    2. Rabies outbreaks followed: The growth in feral dog numbers led to outbreaks of rabies.
    3. Human mortality rose 4 per cent: A 2024 study in the American Economic Review estimated that increase as a consequence of the vulture decline.
    4. The damages were valued at 69.4 billion dollars a year: The same study put the associated cost to India at that figure.

    Why does power infrastructure kill vultures specifically?

    1. A wingspan can bridge two conductors: A large individual can contact two conductors at once, which is what completes the circuit through the bird.
    2. The birds seek elevated perches: Vultures habitually perch on elevated structures and are drawn to open landscapes, which is what a transmission corridor provides.
    3. Predictable food concentrates them: Vultures congregate where food availability is predictable, and dumping of food waste around electrical installations creates exactly that draw.
    4. Medium-voltage lines are also lethal: An assessment prepared for the State Climate Resilient Power System Development Project recorded an Egyptian vulture and steppe eagles electrocuted on medium-voltage rather than high-voltage lines.

    Why is the evidence on electrocution weaker than the threat?

    1. The deaths are removed before they are recorded: Avian electrocution is likely under-documented in India, since a dead bird can be taken by people or eaten by scavengers.
    2. The comparison with drugs understates the risk: Electrocution has not become as deadly as NSAIDs were, and the population it now acts on is a fraction of the one the drugs acted on.
    3. A local population can be lost to it alone: Research has noted that persistent mortality from electrocution by itself could render a local population extinct.
    4. Waiting for the data repeats the first failure: The fragility of the surviving population and the proliferation of unsafe power infrastructure are together the case for acting before the mortality record matures.

    Which interventions has the evidence actually tested?

    1. Moving the food source worked: Relocating a livestock carcass dump 2.4 km away from high-tension power infrastructure near Dehradun in Uttarakhand may have saved these scavengers from electrocution, per a recent study in the Journal of Threatened Taxa.
    2. Separation is the cheapest measure available: Keeping vulture feeding sites away from power infrastructure is a siting decision rather than a capital works programme.
    3. Insulating conductors removes the contact risk: Covering energised components stops a bird bridging them.
    4. Increasing clearances answers the wingspan: Widening the gap between energised and grounded components has to be sized against vulture wingspans rather than against smaller birds.
    5. Safe perches redirect the birds: Installing perches that carry no current gives raptors an alternative to the energised structure.

    Challenges to vulture conservation in India

    1. Human formulations substitute for the banned veterinary drug: Multi-dose human vials of diclofenac remain on sale and are diverted to cattle, so the ban is defeated at the pharmacy counter. Eg. India capped the human diclofenac vial at 3 ml in 2015 because larger vials were being used on livestock.
      The Fix: Make sale of injectable diclofenac without a veterinary prescription an enforceable offence policed by drug inspectors rather than by forest staff.
    2. New painkillers enter the market faster than they are tested: A molecule is approved for cattle without a vulture safety trial, so each ban is followed by the next drug. Eg. Nimesulide has been shown to be toxic to Gyps vultures and remains in veterinary use.
      The Fix: Require safety testing on Gyps vultures as a condition of veterinary marketing approval for any NSAID, with meloxicam as the reference safe alternative.
    3. Captive breeding cannot outpace adult mortality: Vultures lay a single egg a year and mature slowly, so releases add birds far more slowly than a landscape threat removes them. Eg. The Jatayu Conservation Breeding Centre at Pinjore has released birds only in small annual batches.
      The Fix: Certify the release landscape as safe before any release, with drug residue sampling and line insulation audited as the precondition.
    4. The food base has been engineered away: Rendering and burial of livestock carcasses removes the open food supply that once sustained large scavenger populations. Eg. Vulture restaurants in Maharashtra and Punjab exist because the traditional open carcass dump has disappeared from many districts.
      The Fix: Fund supplementary feeding sites from State animal husbandry budgets and site them by rule away from transmission corridors.
    5. No agency is answerable for bird deaths on power lines: Transmission and distribution utilities carry no reporting duty for wildlife mortality, so the threat has no dataset behind it. Eg. Bird deaths on power lines in the Thar landscape became visible only after Great Indian Bustard litigation forced surveys.
      The Fix: Make wildlife mortality reporting a licence condition for transmission and distribution licensees, with the returns published by the State electricity regulator.
    6. Bird safe design is not written into line standards: Construction standards specify electrical clearances, not clearances sized for large raptors. Eg. Directions on undergrounding power lines in Great Indian Bustard habitat were later narrowed on feasibility and cost grounds.
      The Fix: Write raptor safe pole and cross-arm geometry into the national electricity standards for new lines in identified vulture landscapes.

    Conclusion

    The chemical crash was answerable on paper, because a single molecule could be identified and banned. Electrocution offers no such lever, since the killing agent is ordinary infrastructure doing what it was built to do. The unresolved tension is that conservation authority sits with forest departments while the hazard sits with the power sector, and no rule connects the two. Until that link is made, the threat will keep being measured only after the fact.

    Back2Basics: White-rumped Vulture

    1. Status: Listed as Critically Endangered on the IUCN Red List and protected under Schedule I of the Wild Life (Protection) Act, 1972.
    2. Identification: It carries a white neck ruff and a white rump against black and brown plumage.
    3. Range and nesting: It is found near human settlements across northern and central India, nesting in tall trees and on cliffs.
    4. Ecological role: It is a social scavenger that feeds in flocks on carrion, garbage and slaughterhouse waste, which is how a small population clears waste across a wide landscape.

    [2012] Vultures which used to be very common in Indian countryside some years ago are rarely seen nowadays. This is attributed to:

    (a) the destruction of their nesting sites by new invasive species disease among them

    (b) a drug used by cattle owners for treating their diseased cattle persistent and fatal

    (c) scarcity of food available to them

    (d) a widespread, persistent and fatal disease among them

  • Atmanirbharta in fuel must strengthen, not undermine, India’s food security

    Atmanirbharta in fuel must strengthen, not undermine, India’s food security

    Why in the News

    The all India modal retail price of sugar has climbed from around Rs 45 a kg to about Rs 65 a kg within a month, an increase of nearly 44 per cent. The Union government has attributed the rise to hoarding by traders and millers and has threatened strict action. The rise follows a tightening of supply on three counts at once, arriving just before the festive season when sugar demand typically rises. The tension is that the same government fixes cane prices, sugar sales, imports, exports and the allocation of feedstock to ethanol, so a price spike inside a fully administered chain is a policy outcome rather than a market one.

    What is the Ethanol Blended Petrol Programme?

    1. What it requires: Oil marketing companies blend a mandated share of ethanol into the petrol they sell, which substitutes domestically produced fuel for imported crude.
    2. What it runs on: Ethanol is produced from sugarcane juice, syrup and molasses, and from surplus foodgrain such as rice and maize.
    3. How fast it scaled: Blending stood at 1.53 per cent in 2013-14, reached around 5 per cent by 2019-20 and 20 per cent in 2025-26, and feedstock supply did not keep pace with that trajectory.

    Why did sugar prices spike?

    1. The opening cushion had halved: Stocks at the start of the current sugar year, which runs October to September, were 5 million tonnes against 8 million tonnes a year earlier, leaving little room to absorb a fresh shock.
    2. Production came in below estimate: The 2025-26 output estimate was cut from about 34.3 million tonnes to 30.6 million tonnes on damage from red rot, a fungal disease that rots the cane stalk and destroys sucrose, and from top borer. About 27.35 million tonnes had been produced by June, so 3.25 million tonnes would have to arrive between July and September against a six season average of only 0.38 million tonnes for those months, pointing to a further cut to between 28 and 29 million tonnes.
    3. Ethanol removed supply at the worst moment: The ethanol programme diverted about 2.75 million tonnes of sugar at a time when supplies were already tight. That diversion is what turns energy policy into a competitor of the food market.

    Why can the market not correct the shortage on its own?

    1. Price signals are not allowed to act: In a more open economy a production shortfall corrects itself as higher prices pull in imports and trim consumption.
    2. Every step is administered: Sugarcane pricing, sugar sales, imports, exports and ethanol feedstock allocation are all decided by the government, so a correction has to be ordered rather than triggered.
    3. The calendar closes the escape route: Fresh cane will not reach mills in significant quantity until mid October, so the market must run on existing stocks through the festive demand peak.

    What correction does the assessment call for?

    1. Imports opened too narrowly: One million tonnes of duty free raw sugar has been allowed, against an assessed requirement of at least 3 to 4 million tonnes of refined sugar reaching the open market before and during the festive season. The 100 per cent import duty on refined sugar should be cut to zero or to 5 per cent.
    2. Shift the ethanol feedstock temporarily: Sugar based ethanol should be reduced sharply, with rice from Food Corporation of India (FCI) stocks held far above buffer norms taking its place. FCI should charge ethanol plants at least the procurement price of rice, if not its full economic cost.
    3. Import ethanol or lower the mandate: Ethanol can be imported directly when domestic feedstock is pushing up food prices, or the blending share can be brought down from 20 per cent to about 15 per cent.

    Does switching feedstock end the food versus fuel trade off?

    1. Maize is the least thirsty option: Maize does not consume as much water as rice or sugarcane, and it is already being used as a primary ethanol feedstock.
    2. Yield is the binding constraint: Maize productivity in India hovers around 3.5 tonnes per hectare against about 11 tonnes per hectare in the United States, so the surplus that fuel demand needs does not exist.
    3. The pressure moves to protein: Diverting more maize without a matching rise in output raises maize prices, and that passes into poultry meat, eggs and milk, where maize is the main feed.
    4. The trade off relocates rather than ends: Moving from sugar to rice or maize shifts the food versus fuel choice to a different crop, and closing it requires a large maize surplus, which raises the question of whether India will permit the genetically modified maize that drives United States yields.

    How should the ethanol programme be recalibrated?

    1. The basic number is missing: The net energy balance of each feedstock, meaning the energy returned against the energy spent producing it, has not been established, so allocation is being decided without it.
    2. Let the buyer choose the feedstock: Oil marketing companies could be given flexibility to source ethanol from the most economical feedstock, subject to safeguards for food security, farmers and the environment, in place of a rigid allocation from sugar, rice and maize.
    3. The state’s role narrows to the buffer: Government should hold strategic buffers and enforce food security safeguards rather than manage every feedstock allocation, and the programme itself needs a full evaluation of its design.

    Challenges to the Ethanol Blended Petrol Programme

    1. Capacity was financed against a fixed mandate: Distillery capacity was built on the assurance of a fixed blending share and long term offtake, so any temporary cut leaves loans outstanding against idle plants. Eg. The Ethanol Interest Subvention Scheme financed new and expanded distilleries through soft loans carrying a 6 per cent interest subvention. Fix. Convert the fixed target into a band with a stated floor, so capacity is financed against the floor rather than against a single number.
    2. The efficiency cost sits with the vehicle owner: Ethanol carries lower energy density than petrol, so mileage falls in engines not calibrated for the blend. Eg. Vehicles built before E20 compatibility became standard draw the same blend at the pump with no compensating price difference. Fix. Retain a lower blend grade at outlets serving older fleets, and publish blend specific mileage data at the pump.
    3. Two administered prices move at different speeds: The government fixes both the cane price and the ethanol procurement price, and only the cane price has been revised upward in successive seasons. Eg. Mills carrying distillation capacity report underutilisation as the margin on ethanol narrows. Fix. Index the ethanol procurement price to the cane price fixed under the same control order.
    4. The gains cluster geographically: Distillery capacity follows cane and grain surpluses, so the income the programme creates concentrates in a few States. Eg. Uttar Pradesh and Maharashtra, the two largest cane producing States, hold the bulk of cane based distillation capacity. Fix. Weight new capacity approvals toward maize growing districts, where the water saving is also largest.

    Conclusion

    Fuel self reliance and food security are traded against each other because the blending target was fixed as a number and the feedstock left to catch up. What to watch is whether the correction stops at emergency imports or reaches the design: a blending band replacing a fixed share, and feedstock chosen by the buyer against a stated food security safeguard. The maize yield gap decides whether the trade off can be closed at all rather than merely moved.

    The Sugar Industry in India

    1. Scale and geography: India is the second largest sugarcane producer, with output of 454.61 million tonnes in 2024-25, drawn mainly from Uttar Pradesh and Maharashtra.
    2. The dependent population: About five crore cane farmers and their families depend on the crop, alongside mill and ancillary unit workers.
    3. Mills are multi product units: Beyond sugar, a mill earns from ethanol, bagasse co-generated power, and press mud biogas and bio-fertiliser.

    Laws and Rules Governing the Sugar and Ethanol Sector

    1. Essential Commodities Act, 1955: Sugar is a scheduled commodity under it, so the Centre can impose stock limits and regulate sale and distribution.
    2. Sugarcane (Control) Order, 1966: Issued under that Act, it is how the Centre fixes the Fair and Remunerative Price payable by mills to cane growers.
    3. National Policy on Biofuels, 2018: Sets ethanol blending targets and permits cane juice, syrup, molasses and surplus foodgrain as feedstock, its 2022 amendment advancing the 20 per cent target.
    4. Foreign Trade (Development and Regulation) Act, 1992: Sugar exports are regulated through notifications issued under it, which placed raw, white and refined sugar in the prohibited category.

    Government Initiatives for the Sugar Sector

    1. Sugar Development Fund: Provides concessional loans for mill modernisation, crushing capacity expansion, co-generation and cane development.
    2. Pradhan Mantri JI-VAN Yojana: Supports second generation ethanol from crop residue rather than food grade feedstock.

    Challenges in the Sugar Sector

    1. Cane price and sugar price move independently: The Fair and Remunerative Price rose from Rs 285 a quintal in 2020-21 to Rs 340 in 2024-25 and Rs 355 for 2025-26, and the minimum selling price of sugar has stayed at Rs 31 a kg since 2019. Eg. Cane arrears recur in Uttar Pradesh whenever mill realisation lags the obligatory cane price. Fix. Adopt the Rangarajan Committee’s revenue sharing formula, linking cane payment to realisation from sugar and by-products.
    2. Export policy doubles as an inflation tool: Raw, white and refined sugar sit in the prohibited export category to protect domestic stocks and ethanol feedstock, costing mills global market access. Eg. Exporters lose long term contracts each time the category is switched mid season. Fix. Announce an export quota at the start of each sugar season against a stated closing stock norm, letting mills contract ahead.
    3. The highest recovery belt is the most water stressed: Maharashtra, Karnataka and Tamil Nadu record higher sucrose recovery and face the sharpest groundwater depletion. Eg. El Nino years have cut cane availability in Maharashtra and Karnataka and closed crushing seasons early. Fix. Make drip irrigation and fertigation under the Pradhan Mantri Krishi Sinchayee Yojana a condition for cane area expansion, with early maturing drought resistant varieties.
    4. The northern belt crushes longer and recovers less: Uttar Pradesh and Bihar run longer crushing seasons on lower sucrose recovery, with fragmented landholdings raising cane aggregation costs. Eg. A single national recovery benchmark treats a Bihar mill and a Kolhapur mill as comparable. Fix. Set belt specific recovery, crushing and payment benchmarks rather than one national norm.

    “[2025] Consider the following statements:

    Statement I: Of the two major ethanol producers in the world, i.e., Brazil and the United States of America, the former produces more ethanol than the latter.

    Statement II: Unlike in the United States of America, where corn is the principal feedstock for ethanol production, sugarcane is the principal feedstock for ethanol production in Brazil.

    Which one of the following is correct in respect of the above statements?

    (a) Both Statement I and Statement II are correct and Statement II explains Statement I

    (b) Both Statement I and Statement II are correct but Statement II does not explain Statement I

    (c) Statement I is correct but Statement II is not correct

    (d) Statement I is not correct but Statement II is correct

  • [31st August 2026] The Hindu OpED: Adopt policies for reuse of treated water

    [31st August 2026] The Hindu OpED: Adopt policies for reuse of treated water

    Question (2025, GS3): “Examine the factors responsible for depleting groundwater in India. What are the steps taken by the government to mitigate such depletion of groundwater?
    Linkage: The safe reuse of treated water is a critical step in mitigating groundwater depletion. By directing treated wastewater to agricultural fields (“farms”) and industrial units (“factories”), states can significantly reduce their dependence on fresh groundwater extraction.

    Mentor Comment

    Uttar Pradesh and Uttarakhand have notified treated wastewater reuse policies built for their own geography rather than on a single national template. Both were framed through an extensive consultative process, and both separate the needs of hill communities from those of densely populated plains. They follow the National Framework on Safe Reuse of Treated Water (SRTW), 2022, which made reuse a stated national priority and required States to frame reuse policies of their own. The tension is that sewage treatment capacity has already been built at scale under the Atal Mission for Rejuvenation and Urban Transformation (AMRUT), the central urban mission that funds water supply and sewerage, and a plant discharging into a drain rather than into a farm or a factory returns no water to the system.

    What is the National Framework on Safe Reuse of Treated Water, 2022?

    1. What it establishes: It sets the national position that reuse of treated water is a priority rather than a peripheral option, which is a policy signal as much as a guidance document.
    2. How it devolves: It requires States to develop their own reuse policies, on the reasoning that water solutions are local even where the ambition is national.

    What makes the two State policies a departure from template policymaking?

    1. Geography is written into the policy: Each policy accounts for the stark internal diversity of its State, treating hill settlements and dense plains as different reuse problems.
    2. Reuse is matched to purpose: Both embed fit for purpose reuse, so water is treated to the standard its end use needs rather than to a single quality for every user.
    3. Reuse is tied to other plans: Both integrate reuse with urban planning and with river rejuvenation, instead of running it as a standalone sanitation activity.
    4. Financing and monitoring are built in: Both carry community participation, blended finance and public private partnership pathways, and digital monitoring systems that make reuse accountable.

    Why does built treatment capacity not become reuse?

    1. A plant without an offtake is idle capacity: National missions have scaled treatment infrastructure, and pipes and plants alone do not close the loop when the output goes into a drain.
    2. Departments do not work together: Utilities, urban departments, irrigation agencies and industries operate in silos, and reuse succeeds only where they operate as one chain.
    3. There is no price signal: Reuse becomes economically rational only when pricing reflects what freshwater actually costs the system.
    4. End users have no assurance: Quality standards are what give a farmer or a factory confidence to take treated water as an input.
    5. National ambition has no local plan: City level roadmaps are what convert a national framework into action by a specific municipal body.

    What is the economic case for reuse?

    1. A supply that does not fail: Treated wastewater offers agriculture, industry, urban landscaping and ecological restoration a reliable and drought proof supply, which is increasingly rare.
    2. It reduces a costly dependence: Reuse cuts expenditure on sourcing fresh water and builds climate resilience into a city’s water balance.
    3. It removes a ceiling on growth: Industrial and urban expansion can proceed without straining existing freshwater supplies, and it supports low carbon urban development at scale.
    4. The case has not been made to the decision maker: Until this computable value is put clearly to State governments and planners, the policy remains an aspiration rather than a budget line.

    What decides whether a State actually adopts reuse?

    1. Money comes from convergence, not new allocations: The financial momentum for reuse targets is unlocked by identifying synergies with already funded schemes rather than by fresh budgetary provision.
    2. Public resistance is the deeper constraint: Misconceptions about the safety of treated water run deep, which is why the national framework and both State policies name treated water Apna Jal, our water.
    3. The shift required is psychological: No document can produce acceptance on its own, and the naming choice is an attempt to change how the resource is perceived before it is used.
    4. Delay compounds: States without a clear reuse plan for water security are not merely behind others, they are running out of time to catch up.

    Challenges to the National Framework on Safe Reuse of Treated Water, 2022

    1. The Framework carries no enforceable target: It directs States to frame reuse policies and fixes no volume any State must actually reuse, so a policy can be notified without a single litre changing hands. Eg. Maharashtra’s obligation to reuse 20 per cent of effluent comes from its own State water regulator rather than from any national instrument. Fix. Attach a reuse share to the consent to discharge issued under the Water (Prevention and Control of Pollution) Act, 1974, so the obligation sits on the discharger.
    2. Supply is continuous and demand is seasonal: A treatment plant produces a steady flow around the clock and agricultural offtake follows the cropping calendar, and the storage that bridges the two is rarely built. Eg. Chennai contracted its tertiary treatment output to industrial users in the Manali belt precisely because industry draws a steady year round volume. Fix. Contract an anchor buyer before a plant is commissioned rather than after it is built.
    3. Reuse in food crops carries a health exposure: Irrigation with partially treated sewage moves pathogens and heavy metals into the food chain, and the risk falls on consumers who never chose the input. Eg. The Musi river corridor downstream of Hyderabad has long been irrigated with untreated and partially treated sewage. Fix. Enforce end use specific quality tiers, with the strictest limits for crops eaten raw.
    4. The certifier is also the enforcer: State Pollution Control Boards must certify effluent quality and simultaneously prosecute the dischargers they certify, and they are thinly staffed for either task. Eg. Central Pollution Control Board reviews have repeatedly found a large share of sewage treatment plants operating outside discharge norms. Fix. Separate reuse quality certification from the enforcement function, and staff the certification arm to the number of plants it must clear.

    Conclusion

    The variable that decides reuse is not how much treatment capacity exists but who has contracted to take the output. What to watch is whether the States that have notified policies convert a stated reuse target into signed offtake agreements with irrigation agencies and industry, since that is the point at which a policy becomes a volume of water. The measure worth tracking is the share of treated sewage actually reused, not the share treated.

    Reuse of Treated Water in India

    1. What the activity is: Sewage or industrial effluent is processed to a defined quality standard and then supplied for a use that does not require freshwater.
    2. How little is recovered: Around 28 per cent of India’s sewage is treated and barely 3 per cent of that is beneficially reused, per the Central Pollution Control Board (CPCB).
    3. The resource ahead: Over 35,000 million cubic metres of treated wastewater is expected to be available by 2050.
    4. Why the resource matters: India holds around 18 per cent of the world’s population and about 4 per cent of its freshwater, and per capita availability had fallen to 1,486 cubic metres by 2021, below the 1,700 cubic metre stress threshold.

    Laws and Rules Governing Reuse of Treated Water

    1. Water (Prevention and Control of Pollution) Act, 1974: Created the Central Pollution Control Board and the State Pollution Control Boards, and made the discharge of sewage or trade effluent into a water body subject to their consent.
    2. Water (Prevention and Control of Pollution) Amendment Act, 2024: Rationalised the penalty regime, replacing prosecution for a set of minor offences with monetary penalties decided by an adjudicating officer.
    3. Environment (Protection) Act, 1986: The source of the effluent discharge standards a treatment plant must meet before its output is discharged or supplied to a reuse customer.
    4. Entry 17 of the State List: Water supply, irrigation and drainage are State subjects, which is why a national framework can direct States to act but cannot itself operate a reuse policy.

    Government Initiatives for Reuse of Treated Water

    1. Namami Gange Programme: Funds sewage treatment across the Ganga basin, including colony level decentralised plants and the reuse of treated water for irrigation.
    2. National Water Mission: Targets a 20 per cent improvement in water use efficiency, with reuse counted as a demand side measure alongside conservation.
    3. Maharashtra Water Resources Regulatory Authority mandate: The State regulator requires 20 per cent effluent reuse, a model NITI Aayog has endorsed for wider adoption.
    4. Water Reuse Certificates: Developed by the World Bank hosted 2030 Water Resources Group, these are tradable permits on a cap and trade model, with higher quality treated water earning more credits.