💥Join UPSC 2027,2028 Mentorship (July Batch) + XFactor Notes & Microthemes PDF

Subject: Geographical Features

  • Geography uncover why some rivers stay single while others split

    Introduction

    For decades, scientists wondered why some rivers flow as single channels while others split into braided systems. Researchers at the University of California, Santa Barbara (UCSB), after studying 84 rivers over 36 years using satellite data, have uncovered the mechanism. Their findings resolve a geomorphological puzzle and offer fresh insights for managing rivers amid climate change, rising floods, and human interventions.

    Why is this discovery significant?

    The UCSB study shows that erosion, not equilibrium, drives multi-threading. Single-thread rivers balance erosion and deposition, while braided rivers erode banks faster than they deposit, making them unstable. This overturns earlier models assuming fixed depth and width. In an era of extreme weather, such insights are vital for flood prediction, ecosystem restoration, and sustainable infrastructure.

    Understanding the dynamics of single-thread and multi-thread rivers

    1. Single-thread rivers: They maintain equilibrium between bank erosion and bar accretion, ensuring stable width.
    2. Multi-thread rivers: They are characterised by imbalance, where erosion exceeds deposition, causing channels to widen and split repeatedly.
    3. Example: Brahmaputra’s braided channels erode laterally at a rapid pace, making them inherently unstable.

    Scientific breakthrough in decoding river channel behavior

    1. Data analysed: 84 rivers across climates and terrains, spanning 36 years (1985–2021).
    2. Technology used: Particle Image Velocimetry (PIV) on satellite images, generating 4 lakh+ measurements of erosion and accretion.
    3. Outcome: Identification of patterns showing why some rivers remain stable and others split into multiple channels.

    The ecological role of vegetation in shaping river morphology

    1. Earlier belief: Vegetated banks were considered essential for meandering rivers.
    2. Stanford study finding: Vegetation alters river bend migration:
    3. Vegetated bends → Move outward, creating levees, limiting sinuosity.
    4. Unvegetated bends → Drift downstream, forming different sedimentary deposits.
    5. Implication: River evolution is not only hydrological but also ecological.

    Implications for India’s river systems: Ganga and Brahmaputra in focus

    • Case studies: Ganga near Patna, Farakka, Paksey; Brahmaputra near Pandu, Pasighat, Bahadurabad.
    • Findings: Multi-thread rivers like Brahmaputra are inherently unstable due to rapid lateral erosion.
    • Problem: Artificial confinement by embankments has worsened risks in India.
    • Implication: Flood forecasting models (rating curves) need frequent updates as channel shapes shift.

    Nature-based solutions and strategies for sustainable river management

    1. Remove artificial embankments
    2. Restore natural floodplains
    3. Create vegetated buffer zones along banks
    4. Reactivate abandoned channels
    5. Build wetlands in braided sections
    6. Advantages: Lower cost of restoration, better flood absorption, reduced disaster risk.

    Conclusion

    The new understanding of why rivers split reshapes our approach to flood management, river restoration, and ecological conservation. For India, where rivers like the Ganga and Brahmaputra are lifelines but also sources of recurrent floods, this research is a wake-up call. Emphasising natural solutions over artificial confinement could pave the way for sustainable water governance in the climate change era.

    PYQ Relevance

    [UPSC 2016] Major cities of India are becoming more vulnerable to flood conditions. Discuss.

    Linkage: The recent UCSB study highlights that multi-thread rivers like the Ganga and Brahmaputra are inherently unstable because erosion outpaces deposition, causing channels to split and shift rapidly. In India, this instability is often worsened by human interventions such as embankments, damming, and encroachment, which artificially confine rivers. As these channels change, urban centres located along floodplains (Patna, Guwahati, Kolkata, etc.) become highly flood-prone. The research also suggests that relying on outdated models assuming rivers are stable leads to poor flood prediction in cities. Thus, insights from this study strengthen the argument that urban flooding in India is not only due to unplanned urbanisation but also due to the geomorphological instability of river systems and flawed management practices.
  • Deadly Earthquake in Afghanistan

    Why in the News?

    A powerful earthquake in Afghanistan killed at least 800 people and injured thousands, highlighting the country’s extreme vulnerability to seismic hazards.

    Deadly Earthquake in Afghanistan

    Why is Afghanistan so prone to Earthquakes?

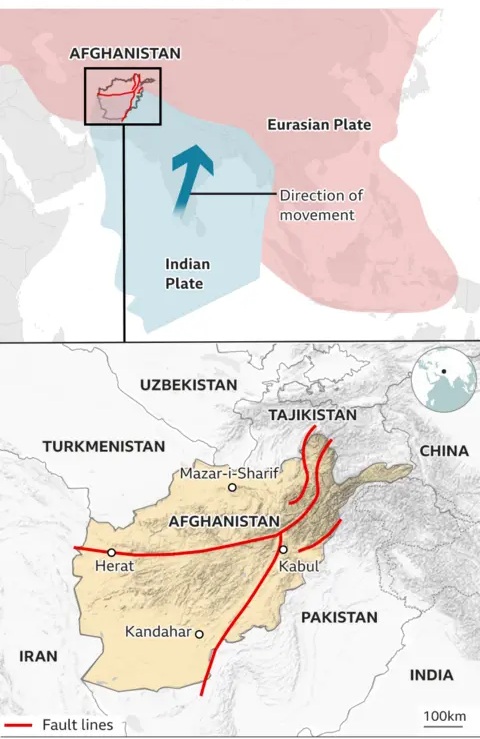
    • Geological Setting: Afghanistan lies in the Hindu Kush mountains, part of the Alpide Belt, the world’s second most seismically active belt after the Circum-Pacific.
    • Tectonic Origin: The Alpide Belt was formed by the closure of the Tethys Ocean, following the collision of the African, Arabian, and Indian Plates with the Eurasian Plate.
    • Ongoing Collision: The Indian Plate’s continued movement into the Eurasian Plate builds mountain ranges (Himalayas, Hindu Kush) and drives strong seismic activity.
    • Seismic Characteristics: Afghanistan experiences both shallow-focus earthquakes (0–70 km depth) causing major destruction and rare deep-focus quakes (up to 200 km) unique to the Hindu Kush.
    • Fault Structures: Major faults occur where the Indian and Eurasian Plates meet, making Afghanistan heavily fractured and highly vulnerable to tremors.

    Where do Afghanistan’s Earthquakes occur?

    • Hindu Kush Region (Northern Afghanistan): Produces both shallow and deep-focus quakes due to the Indian Plate’s lithosphere sinking into the mantle, making it one of the world’s most unique seismic zones.
    • Sulaiman Range (SE Afghanistan & Western Pakistan): Known for shallow, thrust fault quakes, often destructive at the surface.
    • Main Pamir Thrust Zone: Another hotspot for shallow, surface-level earthquakes that cause high damage.
    • Overall Vulnerability: These regions together make Afghanistan one of the most earthquake-prone countries, with repeated deadly events since the 1990s.
    [UPSC 2023] Consider the following statements:

    1. In a seismograph, P waves are recorded earlier than S waves.

    2. In P waves, the individual particles vibrate to and fro in the direction of waves propogation whereas in S waves, the particles vibrate up and down at right angles to the direction of wave propagation.

    Which of the statements given above is/are correct?

    Options: (a)  1 only (b) 2 only (c) Both 1 and 2 * (d) Neither 1 nor 2


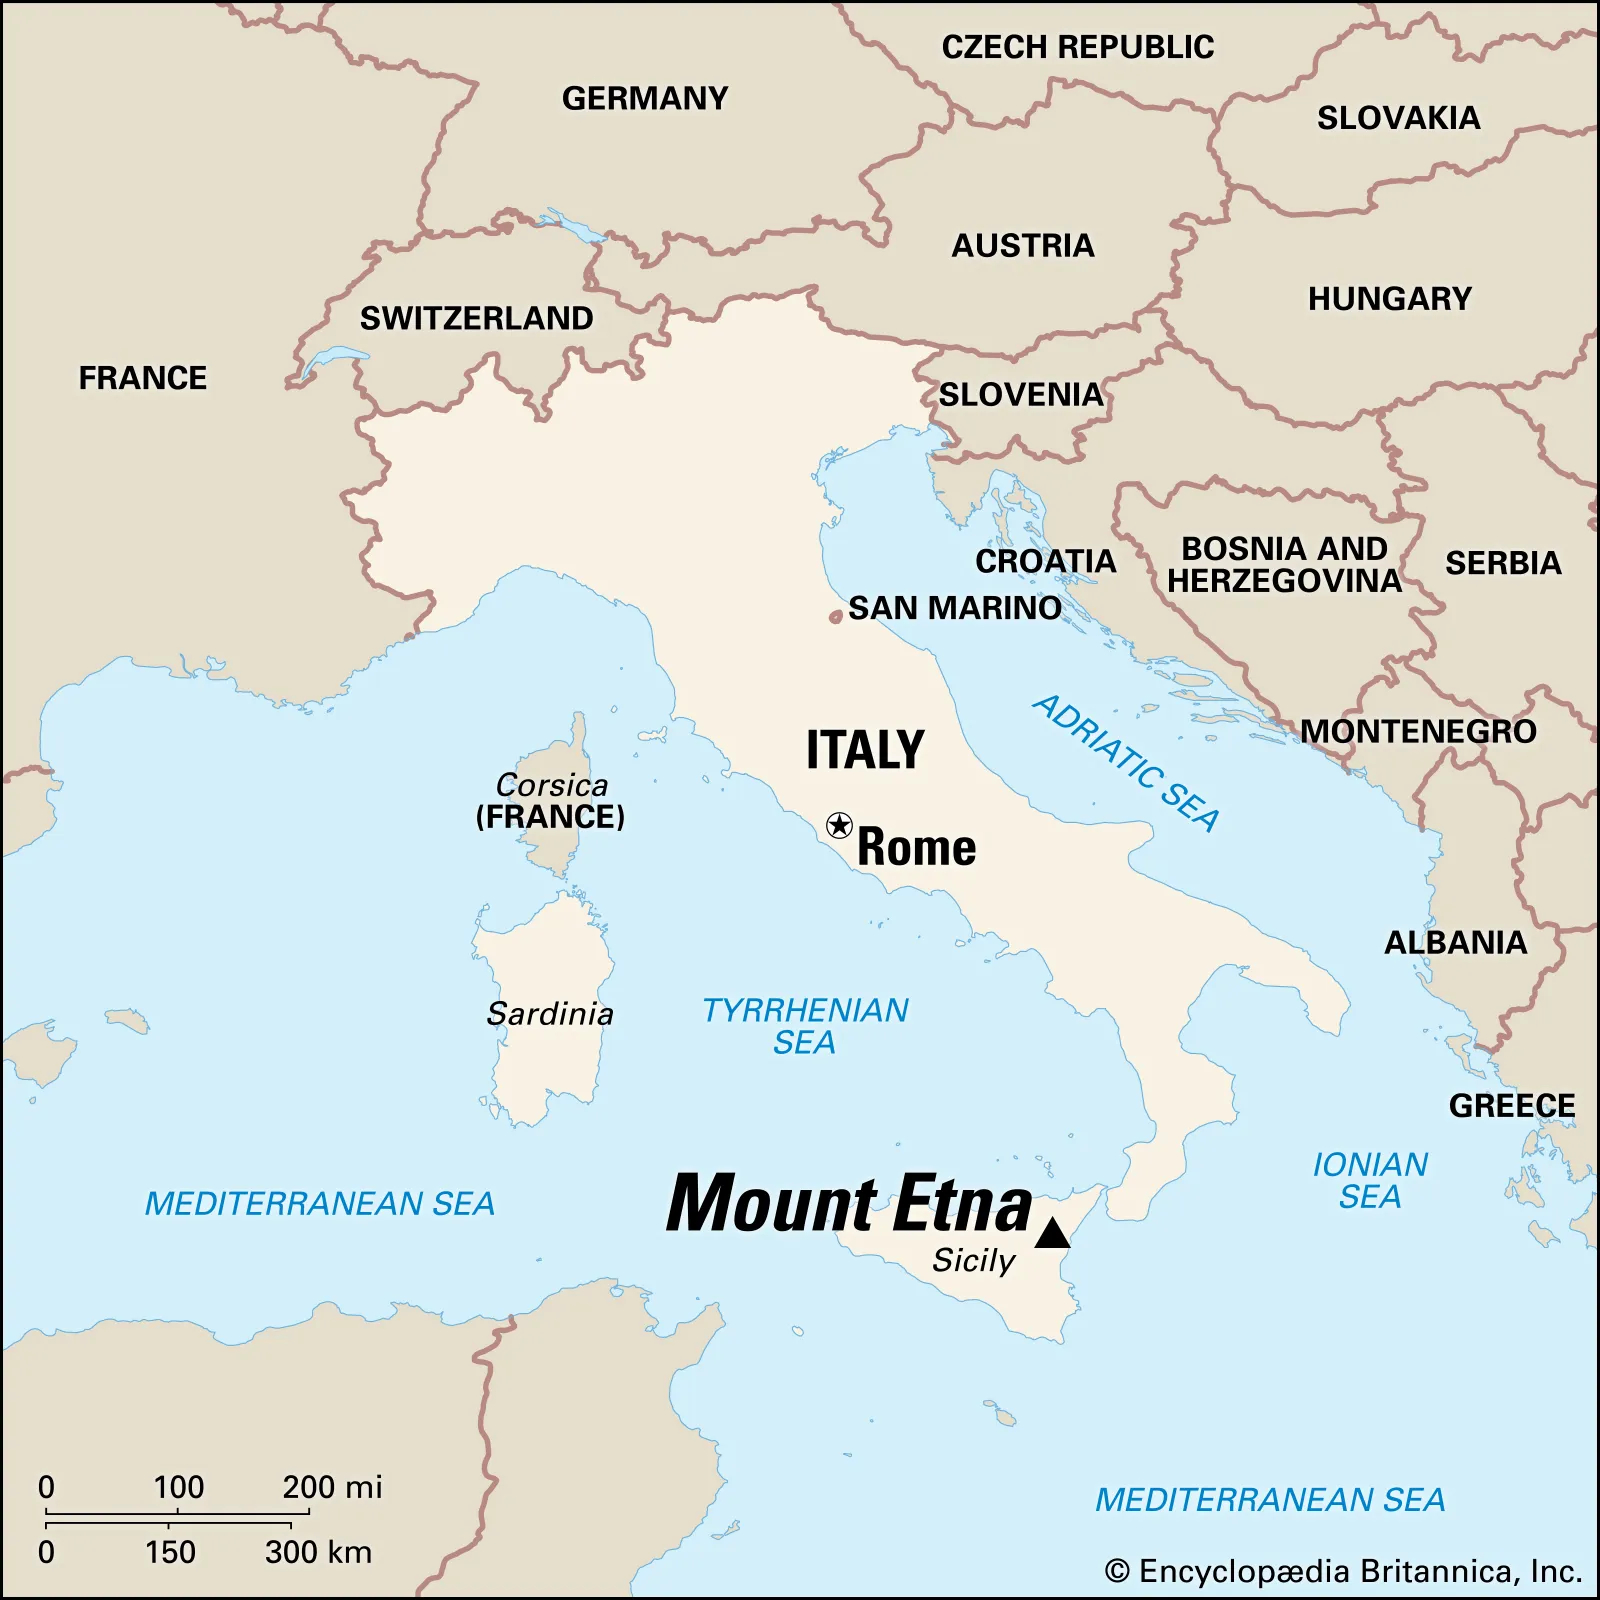
  • Mount Etna Eruption

    Why in the News?

    Mount Etna has erupted again after its recent eruption in June.

    About Mount Etna:

    • Location: Situated on the east coast of Sicily, Italy, near the city of Catania.
    • Type: Mount Etna is a stratovolcano (also called a composite volcano), which is formed from layers of hardened lava, volcanic ash, and rocks.
    • Height: It stands at approximately 3,300 meters, making it the tallest volcano in Europe south of the Alps.
    • Recognition: Declared a UNESCO World Heritage Site in 2013, with documented volcanic activity for at least 2,700 years.
    • Eruption Record: Etna is almost constantly active. Notable eruptions have occurred in 1400 B.C., 1669, 2001, 2018, 2021, 2024, and 2025.
    • Volcanic Activity Style: Known for Strombolian and effusive eruptions, with occasional Plinian eruptions (rare and more explosive).

    Reasons Behind the Eruption:

    • Nature of Eruption: The eruption is classified as either Strombolian or possibly Plinian, depending on interpretation:
      • Strombolian Eruption: Characterized by moderate explosive bursts, caused by gas bubbles in magma suddenly bursting at the surface.
      • Plinian Eruption: Some volcanologists suggest this classification due to the large ash column that may have reached the stratosphere.
    • Eruption Trigger: The eruption likely began due to pressure buildup from gas within the magma chamber, leading to collapse of the southeast crater and lava flows.
    [UPSC 2014] Consider the following geological phenomena:

    1. Development of a fault

    2. Movement along a fault

    3. Impact produced by a volcanic eruption

    4. Folding of rocks Which of the above cause earthquakes?

    Options: (a) 1, 2 and 3 (b) 2 and 4 (c) 1, 3 and 4 (d) 1, 2, 3 and 4*


  • Rivers, Dams, and Headworks of Punjab

    Why in the news?

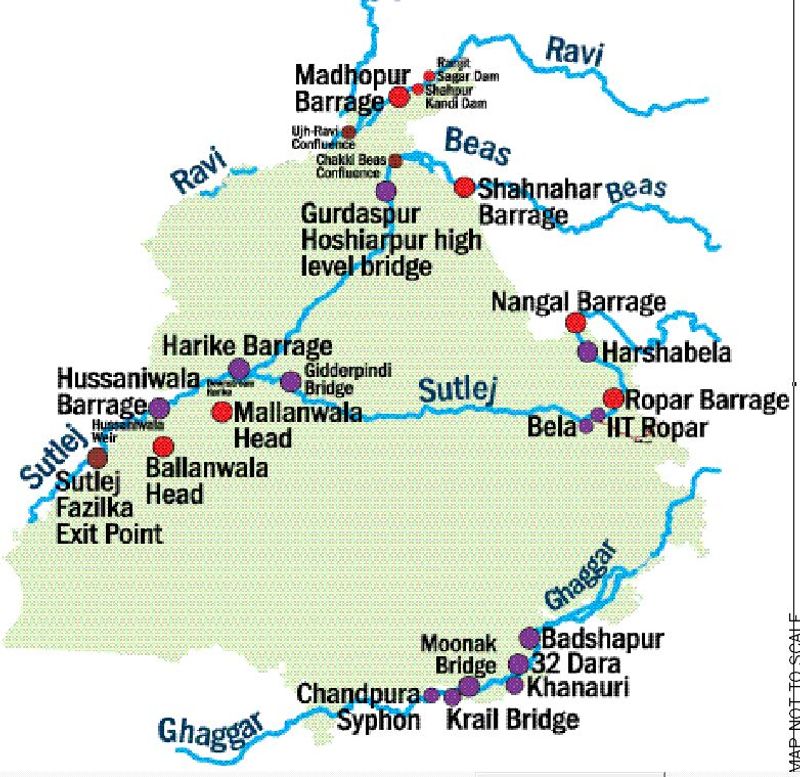
    Floods hit Punjab villages due to heavy rain in Himachal, high dam discharges (Bhakra, Pong, Ranjit Sagar), and regulated headworks flow.

    Rivers, Dams, and Headworks of Punjab

    About the Rivers, Dams, and Headworks of Punjab:

    River Origin & Entry into Punjab Major Dam (Location & Key Facts) Headworks & Functions
    Sutlej Origin: Rakshastal Lake (Tibet); enters India at Shipki La (HP); enters Punjab at Rupnagar; joins Beas at Harike, then Chenab in Pakistan. Bhakra Dam (near Nangal, HP–Punjab border).

    One of India’s highest gravity dams; reservoir = Gobind Sagar Lake; irrigation + hydropower.

    Ropar: Feeds Sirhind & BML canals (Punjab + Haryana).

    Harike: Diverts Sutlej–Beas water to Rajasthan & Punjab canals.

    Hussainiwala: Feeds Bikaner & Eastern Canals (Punjab + Rajasthan).

    Beas Origin: Beas Kund (Rohtang Pass, HP); enters Punjab near Mukerian (Hoshiarpur); flows via Hoshiarpur, Gurdaspur, Tarn Taran, Amritsar. Pong Dam (Maharana Pratap Sagar), HP (Kangra).

    Major irrigation + power dam; supplies Harike.

    Harike: Regulates Beas + Sutlej water; feeds Rajasthan & Punjab canals.
    Ravi Origin: Bara Banghal (Rohtang Pass, HP); enters Punjab near Pathankot; flows via Pathankot, Gurdaspur;

    Enters Pakistan and joins Chenab.

    Ranjit Sagar Dam (Thein Dam), Pathankot (Punjab–J&K border). Irrigation + hydropower. Madhopur: Feeds UBDC canal (Punjab).

    Madhopur–Beas Link: Transfers surplus Ravi to Beas before Pakistan.


    [UPSC 2021] With reference to the Indus river system, among the following four rivers, one of them joins the Indus directly:

    Options: (a) Chenab (b) Jhelum (c) Ravi (d) Sutlej*


  • Mawsynram and Cherrapunji no longer Wettest Places in India

    Why in the News?

    Cherrapunji and Mawsynram have recorded about 50% below normal rainfall this year.

    About the Wettest Places in India:

    • Cherrapunji (Sohra, East Khasi Hills, Meghalaya) and Mawsynram (same district) are globally known as the wettest places on Earth.
    • Average annual rainfall: ~11,000–12,000 mm.
    • World record events:
      • Highest annual rainfall: Mawsynram holds the record for highest annual rainfall.
      • Heaviest rainfall: Cherrapunji recorded 2,493 mm in 48 hours (June 1995), one of the heaviest rainfalls ever documented.

    Comparative Rainfall Data (for 2025 Monsoon Season):

    • Cherrapunji (Sohra): ~3,500 mm (≈50% deficit from normal).
    • Surlabbi (Kodagu, Karnataka): ~7,300 mm (highest in India this year).
    • Tamhini (Maharashtra): 5,788 mm (June–July).
    • Trend: At least 32 stations across India received more rainfall than Cherrapunji in June–July 2025.
    • Historical Low for Sohra: 5,401 mm in 1962 → 2025 may break this record if deficit continues.

    Why Mawsynram /Cherrapunji receive such high rainfall?

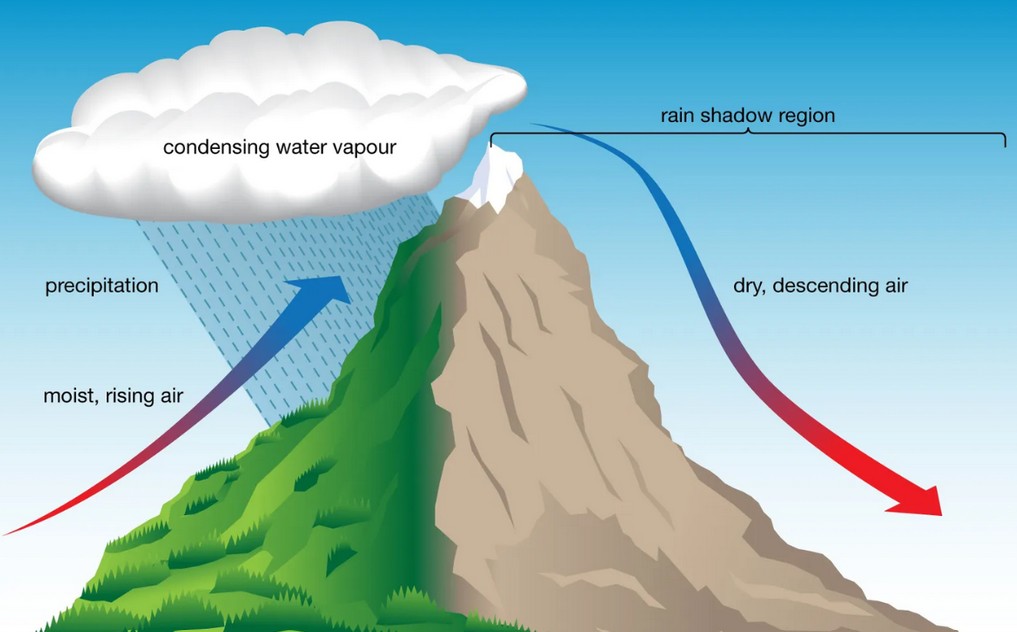
    • Geographical Location: Lies on the southern slopes of the Khasi Hills, directly facing the Bay of Bengal branch of the southwest monsoon.
    • Orographic Effect: Moist monsoon winds hit the steep hills, rise rapidly, and cause heavy orographic rainfall.
    • Monsoon Duration: Receives rainfall almost continuously from June to September, with frequent cloudbursts.
    • Topography: Steep hills + valleys act as a trap for moisture-laden winds, leading to intense rainfall concentration.
    • Climatic Setting: Part of the Humid Subtropical/Monsoonal climate zone of Northeast India, with high moisture inflow.
    [UPSC 2015] Consider the following States:

    1. Arunachal Pradesh 2. Himachal Pradesh 3. Mizoram

    In which of the above States do ‘Tropical Wet Evergreen Forests’ occur?

    Options: (a) 1 only (b) 2 and 3 only (c) 1 and 3 only* (d) 1, 2 and 3


  • African Union (AU) and the Mercator Map Debate

    Why in the News?

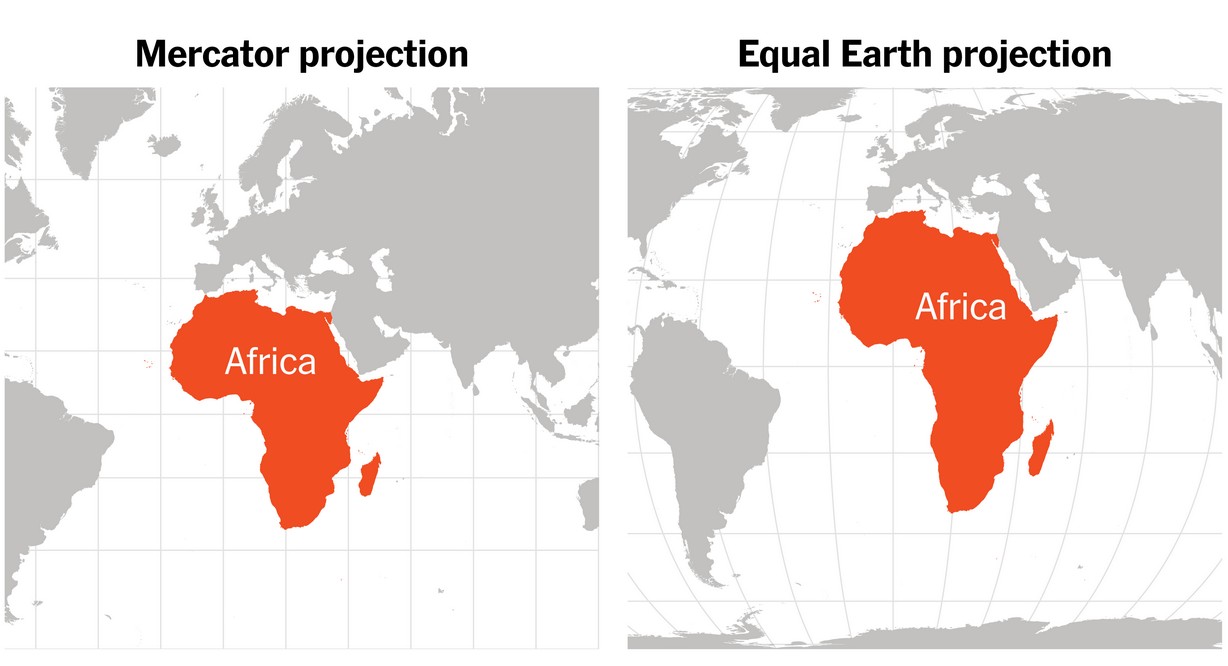
    The African Union (AU) has endorsed the Correct the Map campaign to replace the 16th-century Mercator projection with more accurate maps.

    African Union (AU) and the Mercator Map Debate

    About the African Union (AU):

    • Establishment: Formed in 2002, replacing the Organisation of African Unity (1963).
    • Membership: 55 African countries.
    • Headquarters: Addis Ababa, Ethiopia.
    • Vision: “An Integrated, Prosperous, and Peaceful Africa, driven by its own citizens.”
    • Agenda 2063: Blueprint for socio-economic growth and continental unity.
    • Main Organs: Assembly, Executive Council, AU Commission, Peace and Security Council.

    What is a Mercator Map?

    • Creation: Designed in 1569 by Gerardus Mercator.
    • Projection: Cylindrical map with straight longitude and latitude lines intersecting at 90°.
    • Purpose: Enabled sailors to plot straight-line courses for compass navigation.
    • Adoption: Became the standard map in schools, atlases, and wall charts by the 19th century.

    Issues with the Mercator Map:

    • Distortion: Enlarges high-latitude regions (Europe, Russia, North America) while shrinking Africa and South America.
    • Example: Greenland appears equal to Africa, though Africa is ~14 times larger.
    • Colonial Bias: Reinforced Western dominance narratives and downplayed Africa’s size and importance.
    • Impact: Supported marginalisation and exploitation during colonialism.
    • Alternatives: Gall-Peters (1970s) and Equal Earth (2018) projections show continents in correct proportion.
    • AU Stand: Advocates replacing Mercator maps to restore Africa’s rightful global image.
    [UPSC 2024] The longest border between any two countries in the world is between:

    Options: (a) Canada and the USA * (b) Chile and Argentina (c) China and India (d) Kazakhstan and Russian Federation


  • 1950 Assam Earthquake and Future Seismic Risks in the Himalayas

    Why in the News?

    75 years ago on August 15, 1950, a magnitude 8.6 earthquake — the strongest recorded on land — struck Northeast India and surrounding regions.

    1950 Assam Earthquake and Future Seismic Risks in the Himalayas

    About the Earthquake:

    • Magnitude: 8.6, the strongest recorded earthquake on land.
    • Impact Area: Tremors lasted 4–8 minutes, felt over 3 million sq. km in India, Myanmar, Bangladesh, Tibet, and South China.
    • Casualties: Over 1,500 deaths in India and 4,000+ in Tibet; heavy livestock losses and infrastructure destruction.
    • Secondary Disasters: Triggered landslides blocking rivers, followed by devastating flash floods.

    Geological and Tectonic Setting:

    • Epicentre: 40 km west of Rima (Zayu), near India–Tibet border in the Mishmi Hills.
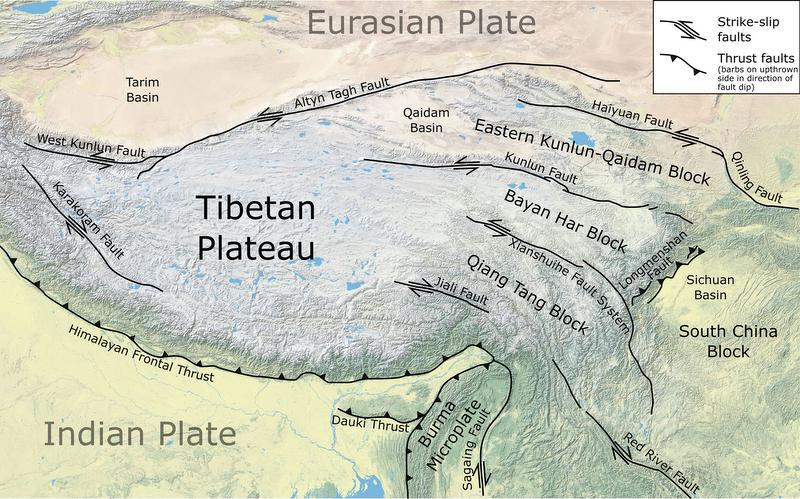
    • Tectonic Context: Located on Indian–Eurasian Plate boundary within Eastern Himalayan Syntaxis (EHS), influenced by the Sunda Plate.
    • Fault Type: Strike-slip motion with thrust faulting — atypical for Himalayan quakes.
    • Plate Convergence: Eastern Himalayas converge at 10–38 mm/year vs. ~20 mm/year elsewhere.
    • Aftershocks: Indicated activation of multiple faults from the Syntaxial bend to Himalayan thrust faults in Arunachal Pradesh.

    Lessons and Future Risks:

    • Magnitude Potential: Confirms Himalayan segments can produce ≥8.6 magnitude events.
    • Central Himalayan Risk: Identified as likely site for similar future quake.
    • Vulnerability Today: Increased due to urbanisation and large infrastructure in seismic zones.
    • Infrastructure Safety: Necessitates strict norms for dams and high-risk projects in Eastern Himalayas.
    • Preparedness: Highlights need for seismic hazard mapping and disaster readiness.
    [UPSC 2024] Consider the following statements:

    1. In a seismograph, P waves are recorded earlier than S waves.

    2. In P waves, the individual particles vibrate to and fro in the direction of waves propogation whereas in S waves, the particles vibrate up and down at right angles to the direction of wave propagation. Which of the statements given above is/are correct?

    Options: (a) 1 only (b) 2 only (c) Both 1 and 2* (d) Neither 1 nor 2


  • In news: Dardanelles Strait

    Why in the News?

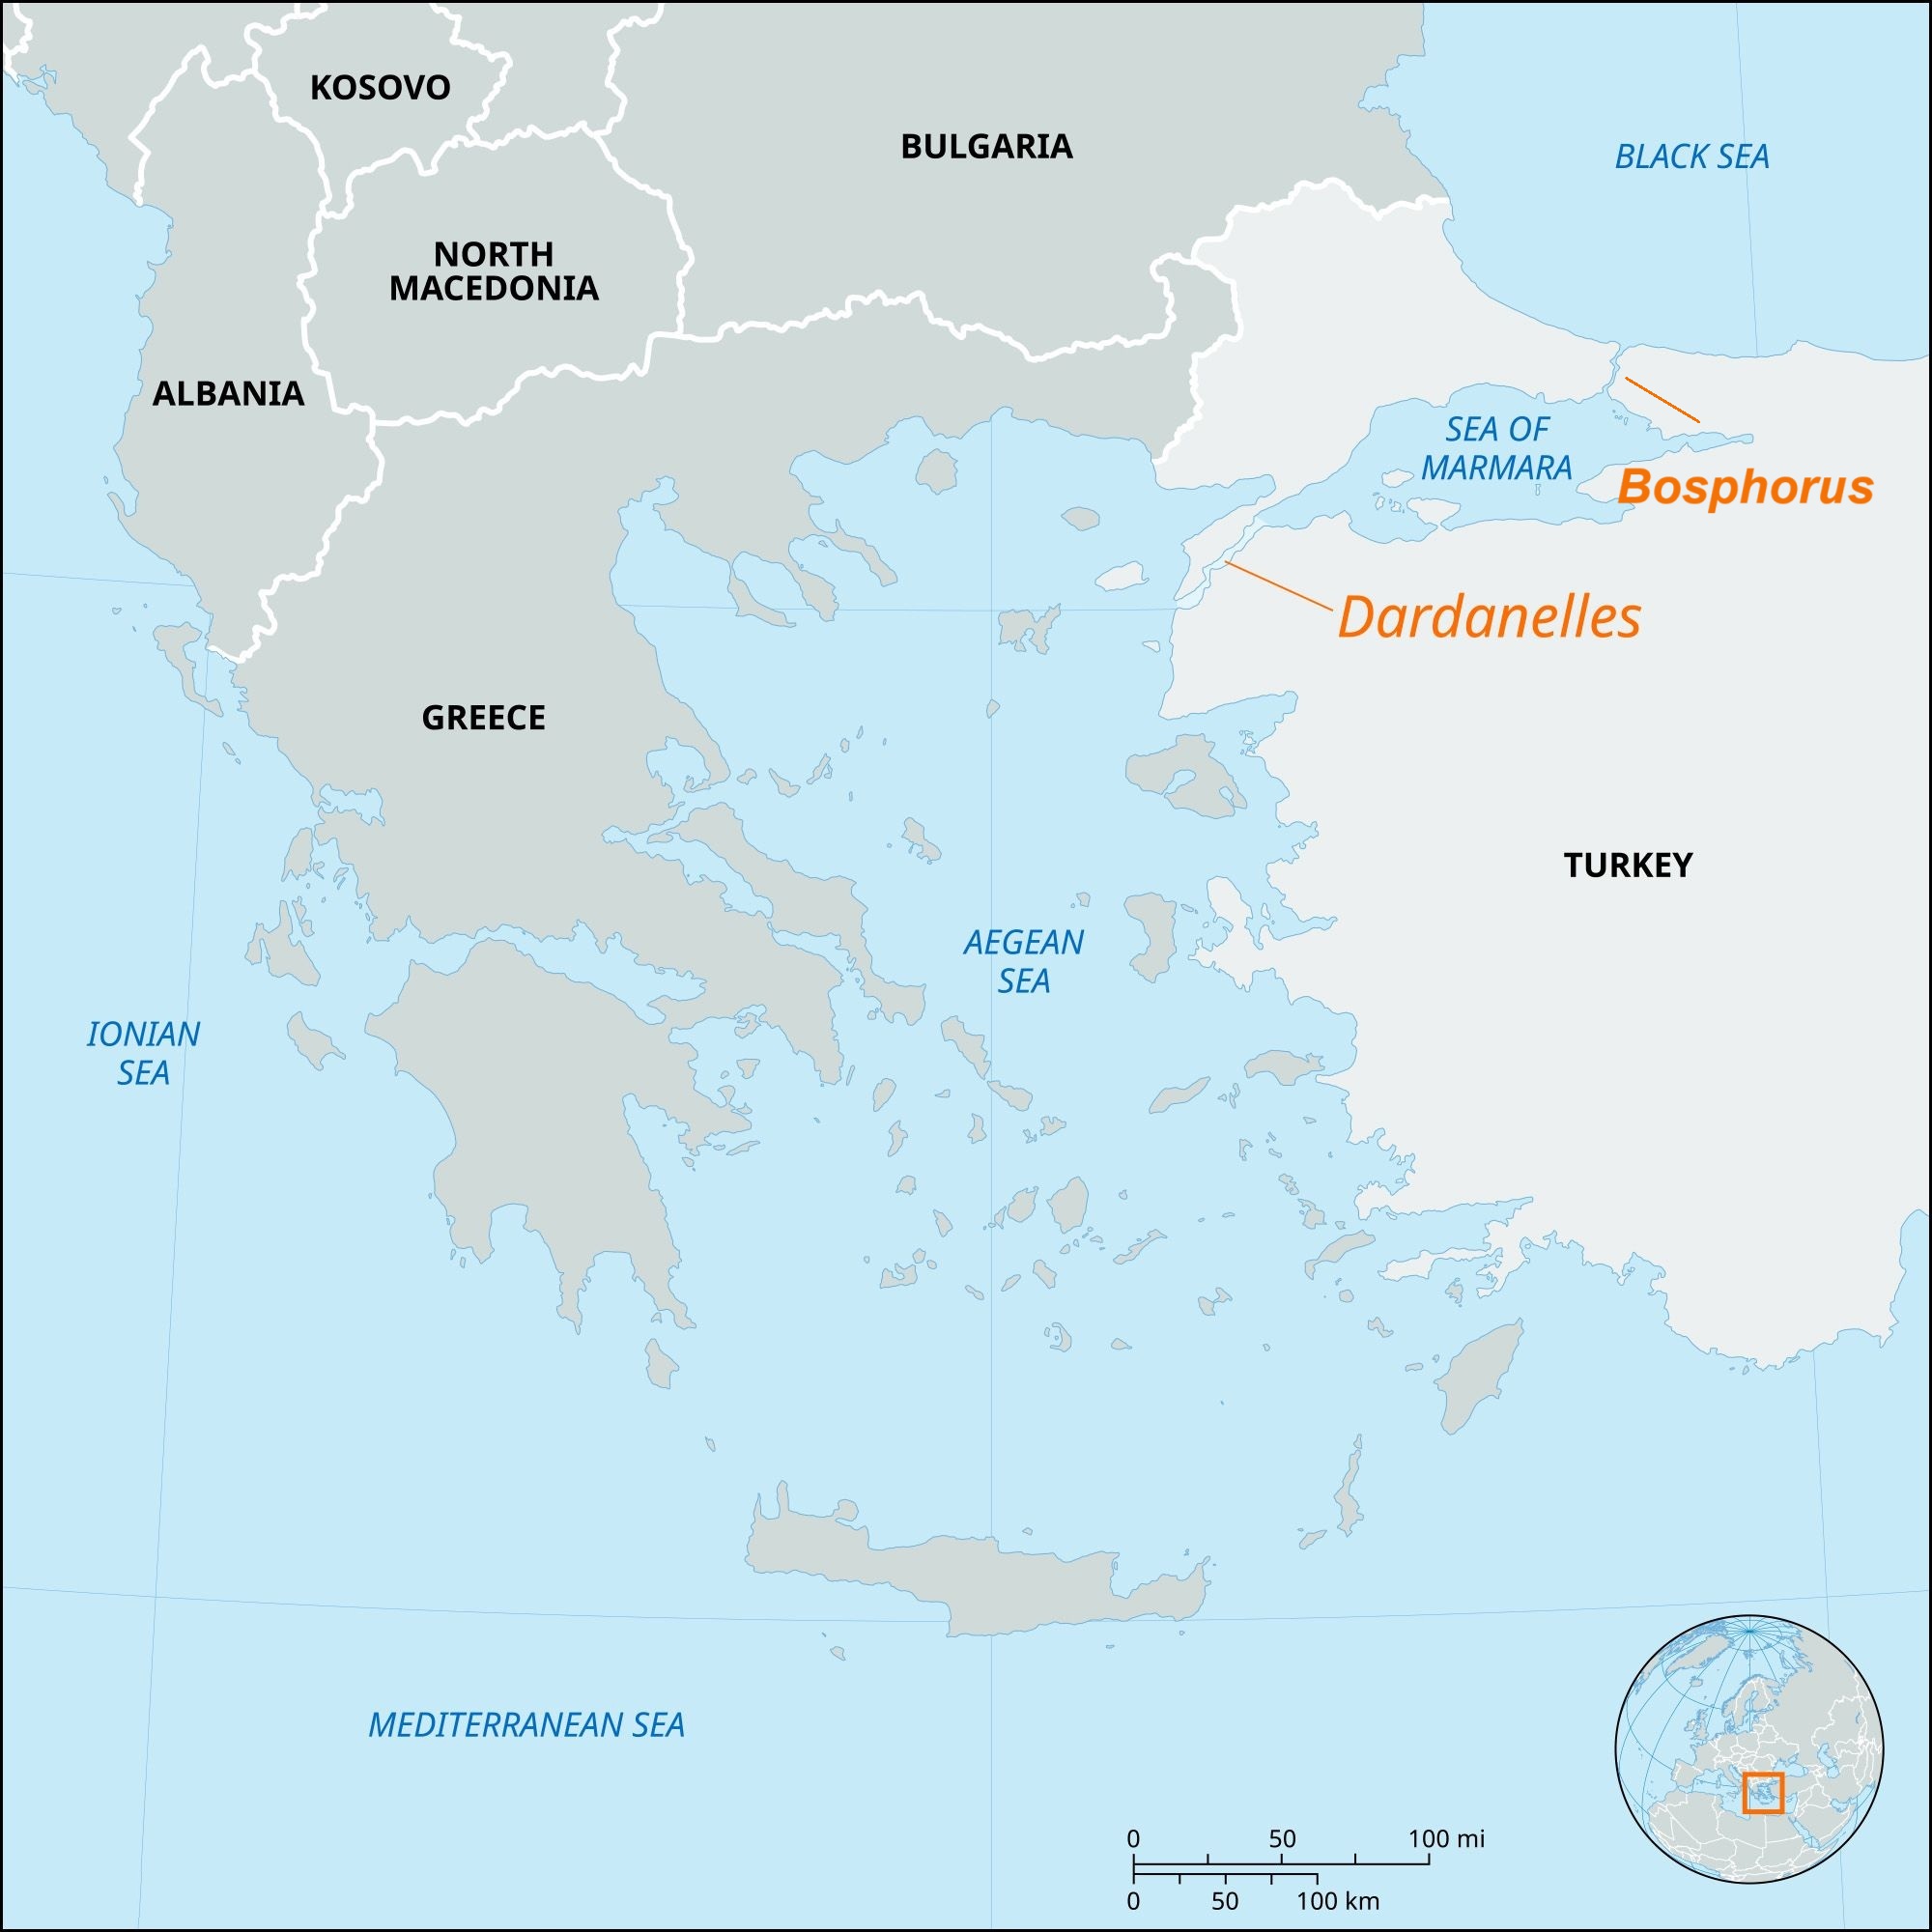
    The Dardanelles Strait in northwestern Turkey has been temporarily closed to maritime traffic due to forest fires near Canakkale, prompting evacuations and firefighting operations.

    About Dardanelles Strait:

    • Location: Northwestern Turkey; separates Gallipoli Peninsula (Europe) from Troad/Biga Peninsula (Asia).
    • Connection: Links Aegean Sea → Sea of Marmara → Bosporus → Black Sea.
    • Dimensions: Length 61 km, width 1.2–6.5 km, average depth 55 m, max depth 103 m.
    • Historical Name: Hellespont, named after mythical princess Helle; current name from ancient city of Dardanus.
    • Currents: Surface current flows from Sea of Marmara to Aegean; saline undercurrent in reverse.
    • Ports: Gallipoli, Eceabat, Çanakkale.

    Strategic & Economic Importance:

    • Part of Turkish Straits system with Bosporus; only maritime link between Black Sea and Mediterranean.
    • Critical for Black Sea nations’ trade (Russia, Ukraine, Bulgaria, etc.).
    • Major route for grain, oil, energy shipments from Black Sea region to global markets.
    • Governed by Montreux Convention (1936) for warship passage.
    • Vital for NATO naval strategy and maritime security.
    [UPSC 2008] Through which one of the following Straits does a tunnel connect the United Kingdom and France?

    Options: (a) Davis Strait (b) Denmark Strait (c) Strait of Dover* (d) Strait of Gibraltar


  • Does Rain make Ocean Water more Buoyant?

    Why in the News?

    New research shows that rain can reduce ocean buoyancy and stabilize tropical waters, challenging the belief that rain always enhances mixing.

    Does Rain make Ocean Water more Buoyant?

    About Buoyancy:

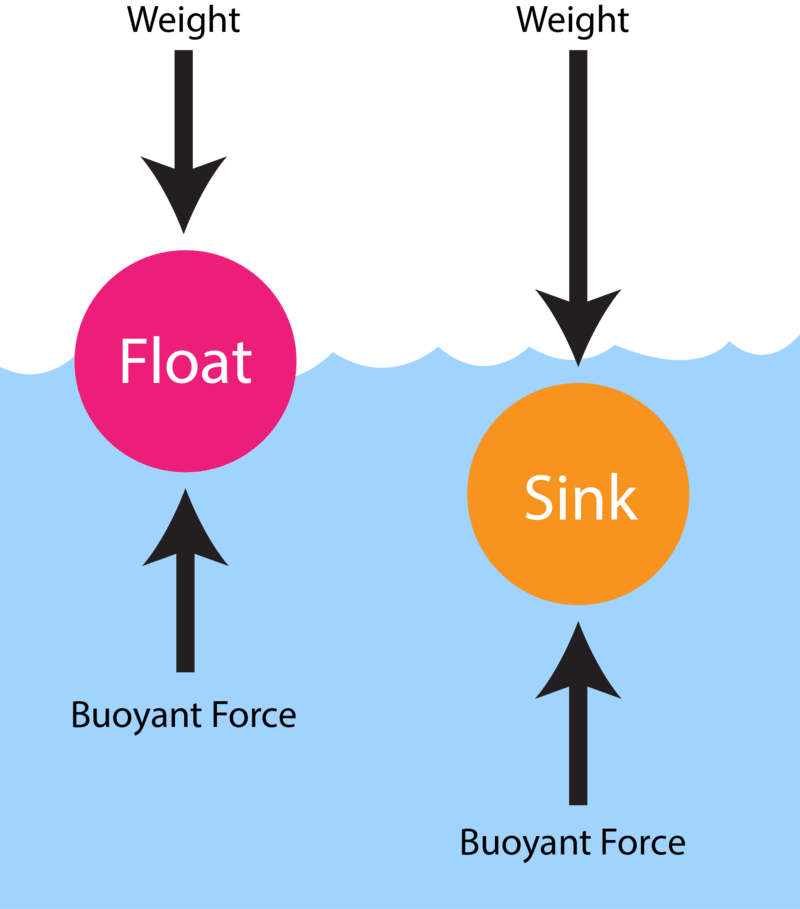
    • What is it: It is the upward force exerted by a fluid (e.g., water) on an object submerged in it.
      • It determines whether an object floats, sinks, or stays suspended.
    • Buoyancy in Oceans: It depends on density differences in water.
      • Lighter water above → unstable → mixing happens.
      • Heavier water above → stable → mixing stops.
    • Buoyancy Flux: Measures changes in buoyancy at the ocean surface over time.
      • Freshwater from rain → makes surface lighter → positive flux → promotes mixing.
      • Heat loss → cools surface → makes water denser → negative flux → resists mixing.

    Key Findings of the Study:

    • Light Rain (0.2–4 mm/hr): Often leads to positive buoyancy flux → supports ocean mixing.
    • Heavy Rain:
      • Usually results in negative buoyancy flux → surface becomes stable.
      • Caused by cold pools that enhance heat loss.
    • Day vs. Night Effect:
      • Night: Rain destabilizes surface → mixing increases.
      • Day: Rain promotes stability → due to added heat loss from sunlight blockage.
    • Geographical Insights:
      • Cold Rain Zones (Western Pacific, Indian Ocean): More stabilization.
      • Hot Rain Zones (Central Pacific): More prone to mixing.

    Significance of the Study

    • Scientific Implications:
      • Refutes the general belief that rain always increases buoyancy.
      • Shows rain can both stabilize or destabilize the ocean surface depending on conditions.
    • Climate Relevance:
      • Ocean mixing is key to heat, carbon, and nutrient cycling.
      • Misreading rainfall’s role can skew climate and weather models.
    • Practical Impact:
      • Improves forecasting accuracy in oceanography and climate science.
      • Aids in understanding the climate-ocean feedback loop more precisely.
    [UPSC 2020] With reference to Ocean Mean Temperature (OMT), which of the following statements is/are correct?

    1. OMT is measured up to a depth of 26°C isotherm which is 129 meters in the southwestern Indian Ocean during January — March.

    2. OMT collected during January — March can be used in assessing whether the amount of rainfall in monsoon will be less or more than a certain long-term mean.

    Select the correct answer using the code given below:

    Options: (a) 1 only (b) 2 only* (c) Both 1 and 2 (d) Neither 1 nor 2


  • Cuvette Centrale: World’s Largest Tropical Peatland Complex

    Why in the News?

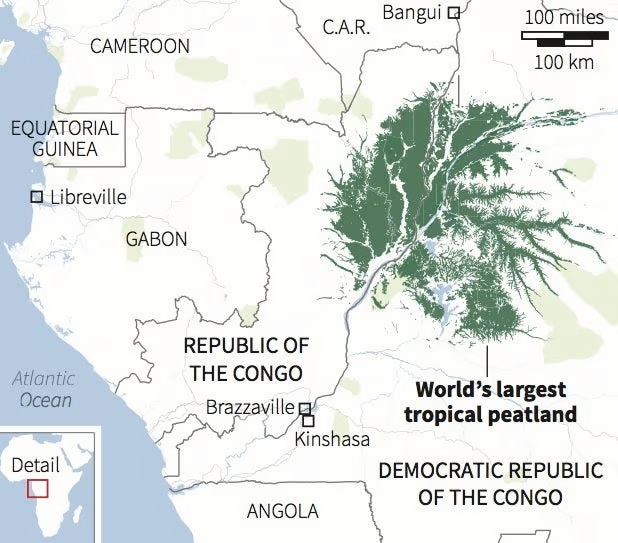
    The Democratic Republic of the Congo (DRC) has launched oil exploration over 124 million hectares of the Cuvette Centrale peatlands raising global ecological risk.

    About the Cuvette Centrale Peatland Complex:

    • Location: Central Congo Basin, spanning the Democratic Republic of the Congo and the Republic of Congo.
    • Size: Covers approximately 145,000–167,600 sq. km—larger than England and about 10% of the Congo Basin.
    • Peat Coverage: Around 40% of the region is underlain by peat—formed over 10,000 years due to flat terrain, rainforest climate, and slow-moving water.
    • Landscape: Features a mosaic of seasonal lakes, floating prairies, swamp forests, rivers, and grasslands.
    • Global Status: The world’s largest near-contiguous tropical peatland complex.

    Ecological Significance:

    • Carbon Storage: Holds about 30–30.6 gigatonnes of carbon—
      • Equal to 3 years of global fossil fuel emissions.
      • Nearly 15 years of U.S. emissions.
      • About 28% of global tropical peat carbon stock.
    • Climate Impact: Acts as a major carbon sink, critical for regulating global temperatures and mitigating climate change.
    • Biodiversity: Habitat for forest elephants, lowland gorillas, and rare plant species.
    • Local Importance: Sustains indigenous livelihoods and maintains regional water cycles.
    • Conservation Status: Recognized as a transnational Ramsar wetland site, highlighting its international ecological value.
    [UPSC 2024] One of the following regions has the world’s largest tropical peatland, which holds about three years’ worth of global carbon emissions from fossil fuels, and the possible destruction of which can exert a detrimental effect on the global climate. Which one of the following denotes that region?

    Options: (a) Amazon Basin (b) Congo Basin* (c) Kikori basin (d) Rio De La Plata Basin