💥Join UPSC 2027,2028 Mentorship (July Batch) + XFactor Notes & Microthemes PDF

Year: 2016

  • 13 Oct 2016 | GS2 | If the goal of a university is not myopically defined to train students only in a particular subject, but is to prepare students for unforeseen and unimagined things that life has to offer, then politics is very important, as a part and parcel of college. Critically comment in the light of recently released TSR Subramanian committee report.

    GS2 (Issues relating to education sector)

    If the goal of a university is not myopically defined to train students only in a particular subject, but is to prepare students for unforeseen and unimagined things that life has to offer, then politics is very important, as a part and parcel of college. Critically comment in the light of recently released TSR Subramanian committee report.

    Best answer

    Aman Chauhan wrote the best answer for this question and got a score of 4.5/10 (if the best answer is an image, it cannot be uploaded here, hence scroll down to see those). The answer is being reproduced below for everyone’s convenience. Of course these answers can always be improved. (Best answer  of a particular only involves those given on that day, later answers may not have been checked)

    Crisis in our education sector hasn’t been a thing of surprise and to realise true potential of education in our society by advising on New education policy TSR Subramaniam committee was appointed which gave some novel recommendations –
    1. Increase spending on education to 6% of GDP (also reiterated by economic survey )
    2. Teacher entrance tests to be made a norm in view of poor quality teachers
    3. Establish Indian education services on line of administrative services
    4. On demand board exam to be introduced
    5. Mid day meal scheme in secondary schools (to ensure health and nutrition )
    6. Restrict political activities on campus
    7. Restrict stay of students overtime to curb disruptive activities
    8. Desirability of non -recognition of student groups based on caste and religion

    While welcoming some much needed suggestions , political restriction advice raises few questions ,because politics can help in –
    A- increasing awareness among students
    B-enforcing accountability among administrators
    C-gives leaders to our society like P.Chidambaram , Arun Jaitley ,etc
    Yet it does have negatives like
    A-increase politicisation brings bad name to universities like JNU case
    B-hampers quality time of students which can be focussed on learning
    C-in a long run may make students disrespectful and arrogant
    There is need to reconsider recommendation on politics in universities because, we should prepare these students to face any crisis in future and political involvement can help in their character building .
    Way forward –
    1.check for suspicious elements in campus by ramping up vigil
    2.promoting newspaper circulation in libraries along with academic books
    3.encourage healthy opinion building among students about various crisis from climate change to refuge deluge
    4.inculcate leadership quality lesson by frequent projects emulating real life situations
    5.constant interaction with students to address their grievances and minimise friction
    Need of the hour is not just preparing a workforce but leaders to guide our nation to prosperous future amid various challenges in the society and a certain amount of political involvement can be of immense help.

  • 13 Oct 2016 | GS1 | Recent reports suggest that deforestation has weakened monsoon rains in the Ganga basin and in North east India. Explain how deforestation affects the monsoon rains. Also discuss the likely consequences of the deforestation and measures needed to prevent deforestation in this region.

    GS1 (Geography)

    Recent reports suggest that deforestation has weakened monsoon rains in the Ganga basin and in North east India. Explain how deforestation affects the monsoon rains. Also discuss the likely consequences of the deforestation and measures needed to prevent deforestation in this region.

    Best answer

    Masala Dosa wrote the best answer for this question and got a score of 4.5/10 (if the best answer is an image, it cannot be uploaded here, hence scroll down to see those). The answer is being reproduced below for everyone’s convenience. Of course these answers can always be improved. (Best answer  of a particular only involves those given on that day, later answers may not have been checked)

    Deforestation affects the monsoonal winds and temporal and spatial distributions by:
    1. Lesser transpiration from stomata of trees.
    2. The microclimate surrounding a tree is has high humidity which means less density and thus vertical movement of air parcel, formatin of clouds.
    3. Cutting of trees means, vast barren land which results in lesset condensational nuclei.

    Apart from these, the undisturbed air and rising temperatures due to deforestation also affect monsoonal rains. Deforestation also affects in following manner:
    1. Loss of sustainable source of timber if deforestation is done without simultaneous plantation.
    2. Loss in fertility of soil due to increased leaching,water and wind erosion. Loss of water retaining capacity.
    3. Amplification of effects of floods and droughts – it has been documented that forests lessen the intensity of such disasters.
    4. Rise in GHG, global temperatures and ascetic loss.
    5. Many livelihoods are dependent on such forests like thosr of tribals.
    6. Destruction of habitats of several animal species. Like Rhino,Squirrels,etc.
    7. It forces animals like tiger,etc out of their habitat -> danger for humans.

    Measures needed to prevent deforestation:
    1. Integrating conservation efforts with people – Joint Forest Management, FRA 2006 implementation, etc.
    2. Checking illegal mining, poaching activities and smuggling of.timber.
    3. Promoting sustainable land use amongst tribals and.preventing sytems like Jhum.
    4. Operatiobalisatiob of CAMPA fund.
    5. Using remote sensing technologies for timely monitoring.
    6. Encouraging eco tourism in non core regions of protected areas to generate awareness amongst the people and meaningful livelihoods -> reduction in dependency on forests.

    Further schemes like Ujjawala, implementation of PESA and inter sectoral coordination among forest officials and people at large should be encouraged.

  • 13 Oct 2016 | Prelims Daily: CA Questions with Tikdams & Tidbits

    Dear students,

    When you submit your answer, if possible, give some reasoning & more info. along with the ABACAA format. Elaborate on what you know. This helps the whole community to know more and learn more!


    Q.1) Consider following statement about Amur Falcons.

    1. Amur falcons flies non-stop from Mongolia to northeast India covering 5600 km.

    2. This migrating bird species is protected under the Environment Protection Act, 1986

    Which of the statements given above is/are correct?  

    a) 1 only

    b) 2 only

    c) Both 1 and 2

    d) Neither 1 nor 2


    Q.2) Consider following statements about ‘Global Hunger index’.

    1. Global Hunger index calculated each year by the Food and Agriculture Organization of the United Nations.

    2. It designed to comprehensively measure and track hunger globally and by country and region.

    Which of the statements given above is/are correct?  

    a) 1 only

    b) 2 only

    c) Both 1 and 2

    d) Neither 1 nor 2


    Q.3) Which of the following state which is considered as Amur Falcon capital of the world?

    a) Manipur

    b) Nagaland

    c) West Bengal

    d) Assam


    Q.4) Consider following statements about ‘World Conference on Disaster Risk Reduction’

    1. It is a series of UN conferences focusing on disaster and climate risk management in the context of sustainable development.

    2. The Third UN World conference adopted the Sendai Framework for Disaster Risk Reduction 2015-2030.

    Which of the statements given above is/are correct?  

    a) 1 only

    b) 2 only

    c) Both 1 and 2

    d) Neither 1 nor 2


    Q.5) Recently, Margarita island was in the news, located in

    a) Indian Ocean

    b) Venezuela

    c) South Africa

    d) South China sea


    IMPORTANT STUFF: 

    1. These questions are mostly derived from our daily newscards. Reading daily news from Civilsdaily’s App (click here) or website + solving these questions will help you reinforce the basics.

    2. For a comprehensive preparation of IAS Prelims 2017 – consider joining one of the three Prelims Modules by CD – prelims.civilsdaily.com

    3. Solutions will be uploaded at 8 p.m. Click here for solutions.

    4. For attempting previous Prelims Daily Questions – Click here

    5. How to apply Tikdams? Read this, this and this

  • Against terroism

    As a citizen,am anger about the activities which terror doing to us, the surgical strike is most important and its shows India’s health,but apart from these attacks on both sides,the government of Pakistan needs a bilateral and smooth talk with the Indian government. I don’t know why they (pak) are not spoke out these issues what is happening in the border and insurgency. Apart from every foregoing measure India and Pakistan needs a bilateral meeting

    As a national security advisor, if there are any insurgency and disturbance over Indian borders and any attacks on the jawans and the vicinities I surely want a surgical strike against militants. the one reason is the jawans are my brothers and they are our citizen as an NSA I want to attack back

  • Flagship Students – Get ready for the Science Test on 21st

    Flagship students,


    – Science and Technology- developments and their applications and effects in everyday life

    – Achievements of Indians in science & technology; indigenization of technology and developing new technology.

    – Awareness in the fields of IT, Space, Computers, robotics, nano-technology, bio-technology and issues relating to intellectual property rights

    Above is the syllabus of the science and technology for UPSC mains. If you see previous years UPSC prelim papers, you will see questions on these lines. Science and technology questions can be divided into two categories –

    • Current affairs related questions – this involves latest developments, such as satellites launched by ISRO, or the latest advancements like LiFi in this years paper. These questions come in the current affairs test.
    • Basic knowledge questions – for these NCERT’s are the best source. The specific NCERT’s are listed below –
      • Science NCERT’s – Class VI and VII, VIII,  IX and X
      • Chemistry NCERT XI Class – Unit 14 (Environmental Chemistry)
      • Chemistry NCERT XII Class – Unit 16 (Chemistry in Everyday Life) – No need to memorise the detailed chemical formulas
      • Biology NCERT XI Class – Unit 4 (Plant Physiology – Chapters 11-15), 5 (Human Physiology – Chapters 16-22)
      • Biology NCERT XII Class – Unit 8 (Biology in Human Welfare – Chapters 8, 9 and 10), 9 (Biotechnology – Chapters 11 and 12), 10 (Ecology – Chapters 13, 14, 15 and 16)

    Read these thoroughly. Questions from these books can also come as environment questions.

    A few sample questions with explanation from the upcoming test

    Q.12) The mode of nutrition in which organisms take in nutrients in solution form from dead and decaying matter is called:

    a) autotrophic nutrition

    b) heterotrophic nutrition

    c) saprotrophic nutrition

    d) Parasitism

    Ans- c

    Explanation: The mode of nutrition in which organisms take in nutrients in solution form from dead and decaying matter is called saprotrophic nutrition. Plants which use saprotrophic mode of nutrition are called saprotrophs.

    Source : NCERT 7th : Science, Chapter 1, Page 6

    Tikdam – Try deciphering meaning of words. Autotrophs, auto means making themselves. Eliminated. Heterotrophs depend on plants but not the dead ones. Eliminated. Parasites need a living host in order to survive. You get the answer now.

    Q.70) The water pollution in a water body is measured by dissolved amount of:

    a) Ozone

    b) Chlorine

    c) Hydrogen

    d) Oxygen

    Ans- d

    Explanation: Amount  of oxygen required by bacteria to breakdown organic matter i.e. Biological Oxygen Demand (BOD) level decides water pollution level of a water body. Clean water would have BOD value of less than 5 ppm whereas highly polluted water could have a BOD value of 17 ppm or more.

    Source : NCERT 11th : Chemistry, Unit 14, Page 407, UPSC Previous year question


    This TS will be available for all our Flagship Students – Click here to secure a spot

  • Poverty: Definitions, Measurement and Controversies | Part 1

    Index

    • Why in news
    • Concept of poverty
    • concept of poverty line
    • Criticism of poverty line
    • Recall Period

    Why in news

    1. The government may soon come out with a new definition of poverty, with the Niti Aayog likely to set up a panel of experts to formulate a new poverty line. The new line, which will be different from the existing Tendulkar line and Rangarajan line, will also be based on the latest consumption expenditure survey.

    2. Reasons: To set a target for poverty reduction while preparing its first 15-year vision document and 7-year strategy paper, which have replaced the 5-year plan Also, to measure the impact of the government’s anti-poverty schemes and other welfare initiatives.

    Concept of poverty

    Poverty refers to a situation when people are deprived of basic necessities of life. It is often characterized by inadequacy of food, shelter and clothes. In other words, poverty refers to a state of privation where there is a lack of essential needs for subsistence. It can be further subdivided into absolute poverty and relative poverty.

    • Absolute poverty includes the lack of biological necessities, such as food, water, clothing, housing, and sanitation, whereas, relative poverty (or extreme poverty) refers to a poverty line, and is a definition of the amount of income a person needs to satisfy basic needs.
    • In basic terms, absolute poverty is a having a lack of basic resources, and relative poverty is more to do with income inequality.
    • Absolute poverty refers to a set condition, which is the same in every country, and does not change over a period of time. Relative poverty, on the other hand, refers to conditions which are subjective to the society in which the person lives, and therefore, does vary between countries, and can change over time e.g. more urban cities will have greater education, energy, and transportation costs, so the poverty line will be higher in this country, compared to poorer countries.

    Concept of poverty line

    1. What is a poverty line – The poverty line defines a threshold income. Households earning below this threshold are considered poor. Different countries have different methods of defining the threshold income depending on local socio-economic needs.

    2. Who brings out the poverty estimates in India – The erstwhile Planning Commission used to release the poverty measures.

    3. How is it measured – Poverty is measured based on consumer expenditure surveys of the National Sample Survey Organisation. A poor household is defined as one with an expenditure level below a specific poverty line.

    4. What’s the Indian poverty line –

    • Earlier, India used to define the poverty line based on a method defined by a task force in 1979. It was based on expenditure for buying food worth 2,400 calories in rural areas, and 2,100 calories in urban areas.
    • In 2011, the Suresh Tendulkar Committee defined the poverty line on the basis of monthly spending on food, education, health, electricity and transport. According to this estimate, a person who spends Rs. 27.2 in rural areas and Rs. 33.3 in urban areas a day are defined as living below the poverty line. For a family of five that spends less than Rs. 4,080 and Rs. 5,000 in rural and urban areas respectively is considered below the poverty line.
    • This has been criticised for fixing the poverty line too low. According to a committee headed by former Reserve Bank governor C Rangarajan, there were 363 million people, or 29.5% of India’s 1.2 billion people, who lived in poverty in 2011-12. The Rangarajan panel considered people living on less than Rs. 32 a day in rural areas and Rs. 47 a day in urban areas as poor.

    5. Why has there been so much criticism about the poverty line in India – According to critics, the government has deliberately kept the poverty line low. A low poverty line has enabled the government to show that millions have moved out of poverty. This, critics say, is factually incorrect as the definition of poverty line is disputed. They also say that the data lacks statistical rigour and has been released to gain political mileage.

    Criticism of poverty line concept

    1. Even though based on calorie approach, the poverty line is not a true indicator of malnourishment because of interpersonal variations in good habits.

    2. The notion of absolute poverty is inadequate because relative poverty is also an equally important.

    3. The poverty line, quantified as a number is reductionist. It does not capture important aspects of poverty — ill health, low educational attainments, geographical isolation, ineffective access to law, powerlessness in civil society, caste and/or gender based disadvantages, etc.

    4. The poverty line provides the conceptual rationalization for looking at the poor as a “category” to be taken care of through targeted ameliorative programmes, ignoring structural inequalities and other factors which generate, sustain, and reproduce poverty.

    5. Poverty line derived from personal consumption patterns and levels do not take into account items of social consumption such as basic education and health, drinking water supply, sanitation, environmental standards, etc. in terms of normative requirements or effective access.

    6. The head-count ratio based on the poverty line does not capture the severity of poverty in terms of the poverty deficit (total shortfall from the poverty line) or additionally the distribution of consumption expenditure among the poor. It is insensitive to mobility within the below poverty line group. It is also invariant to upward and downward mobility across the poverty line so long as such mobility takes place in equal measure.

    7. In a country of India’s continental size and diversity, poverty line based on aggregation at all-India level ignores State-specific variations in consumption patterns and/or prices.

    Recall period – Uniform Reference Period (URP) vs Mixed Reference Period (MRP)

    It is important to understand that a poverty line is essentially a monetary value. The idea is to collect data on people’s consumption expenditure, and to ascertain how many people surveyed fall below that poverty line. In India, there were two main ways of collecting data: Uniform Reference Period (URP) and Mixed Reference Period (MRP). Until 1993-94, consumption information collected by the NSSO was based on the Uniform Reference Period (URP), which measured consumption across a 30-day recall period. That is, survey respondents were asked about their consumption in the previous 30 days. From 1999-2000 onwards, the NSSO switched to a method known as the Mixed Reference Period (MRP). The MRP measures consumption of five low-frequency items (clothing, footwear, durables, education and institutional health expenditure) over the previous year, and all other items over the previous 30 days. That is to say, for the five items, survey respondents are asked about consumption in the previous one year. For the remaining items, they are asked about consumption in the previous 30 days.

    In the next series we write about how poverty is measured starting from Dadabhai Naoroji till present. Read it here.

  • Census 2011 | The basics and summary of important findings

    Index

    • What is the census?
    • When was the first census in India held
    • Why the census is important
    • Key Findings of the Census of India 2011

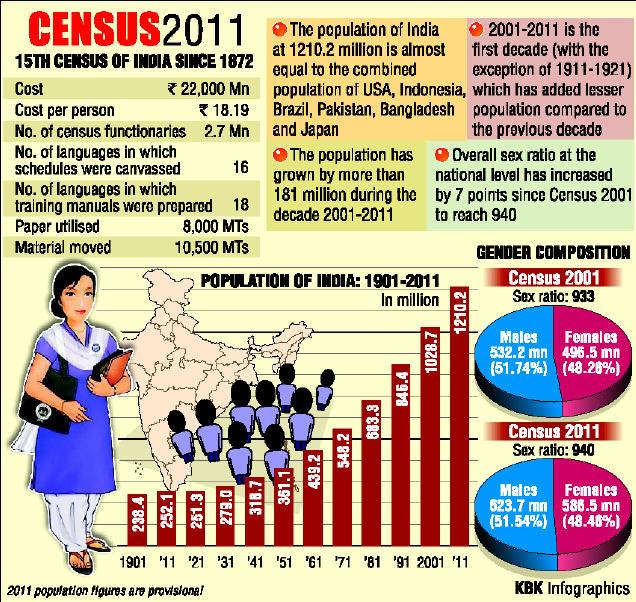
    census_2011_image_1

    What is the census?

    Census is nothing but a process of collecting, compiling, analyzing, evaluating, publishing and disseminating statistical data regarding the population. It covers demographic, social and economic data and are provided as of a particular date.

    When was the first census in India held?

    Census operations started in India long back during the period of the Maurya dynasty. It was systematized during the years 1865 to 1872, though it has been conducted uninterruptedly from the year 1881 being a trustworthy resource of information.

    Why is the census important?

    1. The Indian Census is the most credible source of information on Demography (Population characteristics), Economic Activity, Literacy and Education, Housing & Household Amenities, Urbanisation, Fertility and Mortality, Scheduled Castes and Scheduled Tribes, Language, Religion, Migration, Disability and many other socio-cultural and demographic data since 1872. Census 2011 is the 15th National Census of the Country. This is the only source of primary data in the village , town and ward level, It provides valuable information for planning and formulation policies for Central and the State Governments and is widely used by National and International Agencies, scholars, business people, industrialists, and many more.

    2. The delimitation/reservation of Constituencies – Parliamentary/Assembly/Panchayats and other Local Bodies is also done on the basis of the demographic data thrown up by the Census. Census is the basis for reviewing the country’s progress in the past decade, monitoring the ongoing Schemes of the Government and most importantly, plan for the future.

    Key findings of Census of India 2011 (Summary for UPSC Notes)

    Source
    Key Findings Data & Statistics
    Total Population (2011) 1.21 billion (an increase of 17.7% from the previous decade).
    Male-Female Population Growth Males: Increased by 90.97 million. Females: Increased by 90.99 million. Growth rate: Females (18.3%) higher than Males (17.1%).
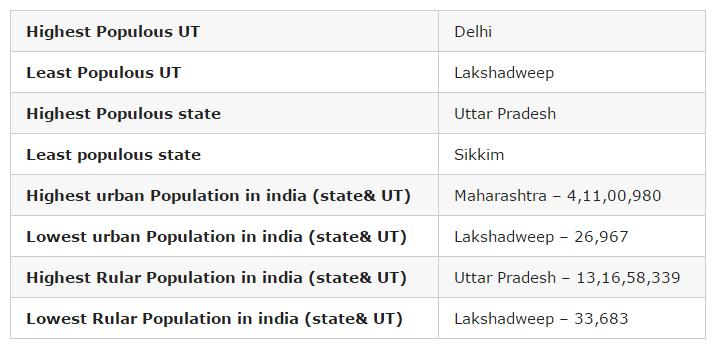
    Rural vs Urban Population Rural: 833.5 million (more than two-thirds). Urban: 377.1 million (urban proportion increased to 31.2% from 17.3% in 1951). Highest urban population in Delhi (97.5%).
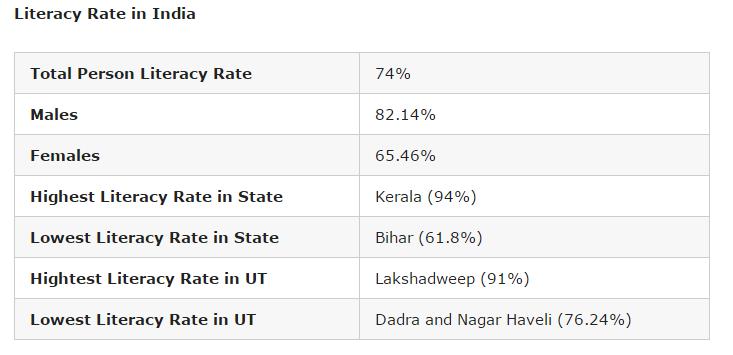
    Literacy Rate 73% (up from 64.8% in 2001). Male literacy: 80.9%, Female literacy: 64.6%. Highest literacy rates: Kerala (94%), Lakshadweep (91.8%), Mizoram (91.3%).
    Population Density Increased from 325 (2001) to 382 (2011) per sq. km. Highest density: Delhi (11,320 per sq. km). Lowest: Arunachal Pradesh (17 per sq. km).
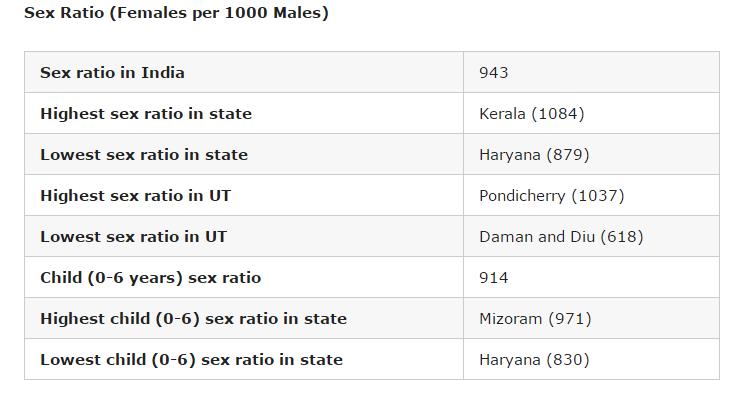
    Sex Ratio 940 females per 1000 males (an increase from 933 in 2001). Highest: Kerala (1,084 females per 1000 males). Lowest: Haryana (879 females per 1000 males).
    Child Population (0-6 years) 164.5 million (0.4% increase from 2001). Child sex ratio: 919 females per 1000 males (a decline from 927 in 2001).
    SC/ST Population SC: 201.4 million (20% increase from 2001). ST: 104.3 million (23.7% increase from 2001).
    Religious Demographics Hindus: 79.8%, Muslims: 14.23%, “No Religion” category: 2.87 million (0.24%).
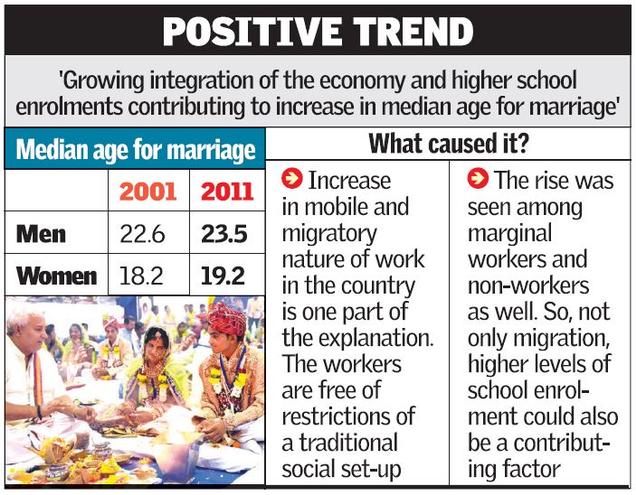
    Median Marriage Age Men: 23.5 years (up from 22.6 in 2001). Women: 19.2 years (up from 18.2 in 2001).

    1. Population of India as per 2011 Census

    • India’s total population stands at 1.21 billion, which is 17.7 per cent more than the last decade, and growth of females was higher than that of males.
    • There was an increase of 90.97 million males and increase of 90.99 million females. The growth rate of females was 18.3 per cent which is higher than males — 17.1 per cent. India’s population grew by 17.7 per cent during 2001-11, against 21.5 per cent in the previous decade.
    • Among the major states, highest decadal growth in population has been recorded in Bihar (25.4 per cent) while 14 states and Union Territories have recorded population growth above 20 per cent.

    2. Rural and urban population as per 2011 Census Data

    • Altogether, 833.5 million persons live in rural area as per Census 2011, which was more than two-third of the total population, while 377.1 million persons live in urban areas. Urban proportion has gone up from 17.3 per cent in 1951 to 31.2 per cent in 2011. Empowered Action Group (EAG) states have lower urban proportion (21.1 per cent) in comparison to non-EAG states (39.7 per cent).
    • Highest proportion of urban population is in NCT Delhi (97.5 per cent). Top five states in share of urban population are Goa (62.2 per cent), Mizoram (52.1 per cent), Tamil Nadu (48.4 per cent), Kerala (47.7 per cent) and Maharashtra (45.2 per cent).

    3. Literacy Rate as per Census of India 2011

    • Literacy rate in India in 2011 has increased by 8 per cent to 73 per cent in comparison to 64.8 per cent in 2001.
    • While male literacy rate stands at 80.9 per cent – which is 5.6 per cent more than the previous census, the female literacy rate stands at 64.6 per cent — an increase of 10.9 per cent than 2001.
    • The highest increase took place in Dadra and Nagar Haveli by 18.6 points (from 57.6 per cent to 76.2 per cent), Bihar by 14.8 points (from 47.0 per cent to 61.8 per cent), Tripura by 14.0 points (from 73.2 per cent to 87.2 per cent)
    • Improvement in female literacy is higher than males in all states and UTs, except Mizoram (where it is same in both males and females) during 2001-11.
    • The gap between literacy rate in urban and rural areas is steadily declining in every census. Gender gap in literacy rate is steadily declining in every census. In Census 2011, the gap stands at 16.3 points.
    • Top five states and UTs, where literacy rate is the highest, are Kerala (94 per cent), Lakshadweep (91.8 per cent), Mizoram (91.3 per cent), Goa (88.7 per cent) and Tripura (87.2).
    • The bottom five states and UTs are Bihar (61.8 per cent), Arunachal Pradesh (65.4 per cent), Rajasthan (66.1 per cent), Jharkhand (66.4 per cent) and Andhra Pradesh (67 per cent).

    4. Census 2011 Population Density Data

    • The density of population in the country has also increased from 325 in 2001 to 382 in 2011 in per sq km. Among the major states, Bihar occupies the first position with a density of 1106, surpassing West Bengal which occupied the first position during 2001.
    • Delhi (11,320) turns out to be the most densely inhabited followed by Chandigarh (9,258), among all states and UT’s, both in 2001 and 2011 Census. The minimum population density works out in Arunachal Pradesh (17) for both 2001 and 2011 Census.

    5. India’s Sex ratio as per 2011 Census

    • The sex ratio of population in the country in 2011 stands at 940 female against 1000 males, which is 10 per cent more than the last census when the number female per thousand male stood at 933. Haryana has the dubious distinction of having the worst male-female ratio among all states while Kerala fares the best.
    • The number of females per 1000 males in Haryana in 2011 stands at 879 followed by Jammu and Kashmir (889 female) and Punjab (895 females).
    • The other two worst-performing states in terms of skewed sex ration are Uttar Pradesh (912 females) and Bihar (918 females).
    • Five top performing states in terms of sex ratio were Kerala (1,084 females), Tamil Nadu (996), Andhra Pradesh (993), Chhattisgarh (991), Odisha (979).

    6. Child population in India as per Census of India 2011

    • Child population in the age of 0 to 6 years has seen an increase of 0.4 per cent to 164.5 million in 2011 from 163.8 million in 2001.
    • The child population (0-6) is almost stationary. In 17 states and UTs, the child population has declined in 2011 compared to 2001.
    • With the declaration of sex ratio in the age group 0-6, the Census authorities tried to bring out the recent changes in the society in its attitude and outlook towards the girl child. It was also an indicator of the likely future trends of sex ratio in the population.
    • There has been a decline of 8 per cent in the sex ratio of 0-6 age group. In 2011, the child sex ratio (0-6) stands at 919 female against 1000 male in comparison to 927 females in 2001.
    • Male child (0-6) population has increased whereas female child population has decreased during 2001-11. Eight states, Jammu and Kashmir, Rajasthan, Uttar Pradesh, Bihar, Jharkhand, Arunachal Pradesh, Mizoram, and Meghalaya have proportion of child population more than 15 per cent.
    • The worst performing states in regard to sex ration in the age group of 0 to 6 years are Haryana (834 females), Punjab (846), Jammu and Kashmir (862), Rajasthan (888) and Gujarat (890).
    • The best performing states are Chhattisgarh (969), Kerala (964), Assam (962), West Bengal (956) Jharkhand (948) and Karnataka (948).

    7. SC/ST data as per 2011 Census Data

    • According to the Census, Scheduled Castes are notified in 31 states and UTs and Scheduled Tribes in 30 states. There are altogether 1,241 individual ethnic groups, etc. notified as SC’s in different states and UT’s.
    • The number of individual ethnic groups, etc. notified as ST’s is 705. There has been some changes in the list of SC’s/ST’s in states and UT’s during the last decade.
    • The SC population in India now stands at 201.4 million, which is 20 per cent more than the last census. The ST population stands at 104.3 million in 2011 – 23.7 per cent more than 2001.

    8. Religious demographics as per Census of India 2011

    The religious data on India Census 2011 was released by the Government of India on 25 August 2015. Hindus are 79.8% (966.3 million), while Muslims are 14.23% (172.2 million) in India. For the first time, a “No religion” category was added in the 2011 census. 2.87 million Were classified as people belonging to “No Religion” in India in the 2011 census. – 0.24% of India’s population of 1.21 billion. Given below is the decade-by-decade religious composition of India till the 2011 census. There are six religions in India that have been awarded “National Minority” status – Muslims, Christians, Sikhs, Jains, Buddhists and Parsis.

    9. Median marriage age as per Census 2011

    The median age increased for men – from 22.6 (2001) to 23.5 (2011) and for women – from 18.2 (2001) to 19.2 (2011)

    Source

    The next part of the series will cover the 2011 Socio Economic Caste Census (SECC). You must have read about it many times in the news, reading it on Civils Daily will make you clear as to what it’s actually about!

    FAQs

    1. What is the percentage of the child population in India according to Census 2011?

    According to the Census 2011, children aged 0-6 years constituted 13.12% of India’s total population.

    2. What are the important facts from Census 2011?

    • Total Population: 1.21 billion.
    • Male-Female Ratio: 940 females per 1000 males.
    • Literacy Rate: 74.04% (Male: 82.14%, Female: 65.46%).
    • Decadal Growth Rate: 17.64%.
    • Child Sex Ratio: 919 females per 1000 males.

    3. What is the caste-wise population distribution in India as per Census 2011?

    • The caste-based population data is not published as part of Census 2011. However, estimates suggest that Scheduled Castes (SCs) and Scheduled Tribes (STs) constitute around 16.6% and 8.6% of the total population, respectively.

    4. Where can I get a summary of the 2011 Census for UPSC?

    Various summaries and detailed PDF documents on Census 2011 tailored for UPSC preparation are available on government and educational platforms. You can find them by searching “Census 2011 UPSC PDF” or referring to sources like Civilsdaily and NCERT resources

    5. When is the latest Census of India conducted?

    The latest census was planned for 2021, but it has been delayed due to the COVID-19 pandemic. The data collection is still pending as of the last update.

  • 12 Oct 2016 | Debate | Should we go for more surgical strikes?

    Despite the recent surgical strikes there have been more attacks on army installations and increased infiltration attempts. The Pampore operation is still going on. See here for a brief update – http://indianexpress.com/article/india/india-news-india/pampore-security-operation-to-flush-out-militants-enters-third-day-3078056/

    Today’s debate is – If you were the National Security Advisor and were given the responsibility of deciding, by the PM, whether to go for more surgical strikes or not, what would be your decision? Keep in mind that the Pakistani Army is now more alert and future surgical strikes could result in Indian casualties.

  • 12 Oct 2016 | GS4 | The public will only trust the government when it delivers its services efficiently. What are the challenges in delivering services efficiently? How will you improve the delivery?

    GS4 (Quality of service delivery)

    The public will only trust the government when it delivers its services efficiently. What are the challenges in delivering services efficiently? How will you improve the delivery?

    Best answer

    Srishty Srivastava wrote the best answer for this question and got a score of 4.5/10 (if the best answer is an image, it cannot be uploaded here, hence scroll down to see those). The answer is being reproduced below for everyone’s convenience. Of course these answers can always be improved. (Best answer  of a particular only involves those given on that day, later answers may not have been checked)

    The public’s faith and trust in the government depends on its ability to perform its duties in an proper manner. Service delivery is an important duty of the government and so, failure in providing public services tarnishes the credibility of the establishment.
    Challenges in delivering service are manifold:-
    1. Citizen Charter:- Lack of uniformity in standards at state level, ambitious standards that are difficult achieve.
    2. Poor targetting and leakages resulting in exclusion and inclusion errors
    2. Ineffective monitoring and review mechanism in order to flag off inefficiencies in processes
    3. Lack of an effective grievance redressal mechanism
    4. Bureaucratic Apathy
    5. Corruption, Nepotism, conflict of interest starting from the lower rungs to the top of hierarchy
    6. Lack of active disclosures under RTI due to problems with handling and storing data resulting in lack accountability and transparency

    The solution would lie in:
    1. embracing e-governance and ICT solutions to solve the problems of lack of accountability and transparency. Only digitisation of processes would not solve the problem. Revamping of the entire process is needed in application of ICT.
    2. Citizen Charter Bill may help in streamlining and homogenising the service standards, quality control, redressal mechanism.
    3. Active transparency under RTI must be encouraged and incentivised.
    4. Grievance redressal must be made more user-friendly and time-bound with better UI, information placement, system of escalation in case of dissatisfaction with remedial measures.
    5. Bureaucracy must be empathetic to the needs of citizens and ensure that laws are not used to exploit the citizens but to aid them.

    Servitude, sense of social justice, empathic responses to the needs of citizens and accountability in duty are the essence of a successful public service delivery paradigm. Therefore, an attitudinal change is required on part of the government. The rest will follow.

  • 12 Oct 2016 | GS3 | In order to curb the level of vehicular pollution and not to be left behind than the developed nations, India has decided to meet the implementation of BS VI norms by 2020 skipping BS V implementation. What are Bharat Stage (BS) norms? What are the benefits of these norms and what are the challenges automobile manufacturers and the consumers face if India skip BS V and directly implements BS VI?

    GS3 (Science and Technology- developments and their applications and effects in everyday life Achievements of Indians in science & technology; indigenization of technology and developing new technology)

    In order to curb the level of vehicular pollution and not to be left behind than the developed nations, India has decided to meet the implementation of BS VI norms by 2020 skipping BS V implementation. What are Bharat Stage (BS) norms? What are the benefits of these norms and what are the challenges automobile manufacturers and the consumers face if India skip BS V and directly implements BS VI?

    Best answer

    Akshay Bansode wrote the best answer for this question and got a score of 4/10 (if the best answer is an image, it cannot be uploaded here, hence scroll down to see those). The answer is being reproduced below for everyone’s convenience. Of course these answers can always be improved. (Best answer  of a particular only involves those given on that day, later answers may not have been checked)

    Bharat Stage is Indian Standard of Pollution control norms.Its applicable on Oil Manufacturing Company and Automobile Manufacturer. With successive upgradation Pollution control norms become more strict like,
    — Lesser content of so2/no2 released.
    — proper filtration of PM level and other toxic particle.
    With 2020 Country aims to implement BS-6 fully.

    Benefits:
    1) BS is in sync with european standard thus No question on India’s Standard of Pollution control.
    2) Will contribute more to India’s INDC efforts as BS triggered Pollution control norms with successive upgradation.
    3) BS-6 will filter low PM level from air along with no2 and so2 hence will benefit in fight against astham and lungs problem.
    4) will be in line with Article 21 right to Pollution free environment.

    Challenge faced on direct jump to BS-6 skipping BS-5 norms:

    A) Automobile Mfg:
    1) Adaptation of Technology may take some time hence can harm Market since Foreign Firms already has advanced technology.
    2) Finance needed for upgradation of Technology.
    3) Added Mfg cost will increase Market prices of Automobile hence dwarfing of consumer base.

    B) Consumer:
    1) As Oil Manufacturing Company also need to upgrade fuel hence added petroleum cost will effect transportation cost.
    2)It may lead to inflation too
    3) Interest on car loan too may change.

    Way Forward:
    — Govt should subsidize OMC and Automobile Mfg for Adaptation to fuel standard.
    — Govt can Consider for MoU with developed country for transfer of Technology.