💥Join UPSC 2027,2028 Mentorship (July Batch) + XFactor Notes & Microthemes PDF

Distribution: yearly

  •  [op-ed snap] How to protect trade in a tug of war between nations

    Context

    Developing countries have argued for decades that the rules governing international trade are profoundly unfair. But similar complaints are now emanating from the developed countries that established most of those rules.

    Why are developed countries complaining now?

    • Competition: A simple but inadequate explanation is “competition.”
      • Turning tide: In the 1960s and 1970s, industrialized countries focused on opening foreign markets for their goods and set the rules accordingly.
      • Since then, the tide has turned.
    • Left behind communities in developed countries
      • Cheap labour-an advantage: One reason why emerging-market producers are competitive is that they pay workers less.
      • Job creation in services by developed countries: To replace lost manufacturing jobs, developed economies have been creating jobs in services.
      • Not everyone has moved to the service sector job: Unfortunately, not everyone in developed countries has been able to move to good service jobs.
      • Efforts by the left-behind bring back the manufacturing job: The left-behind former manufacturing communities have a voice in the capital city now, and it wants to bring back manufacturing.
      • Yet this explanation, too, is incomplete. The ongoing US-China trade war is not about manufacturing, it is about services.
    • Services a reason behind US-China dispute: Much of the US dispute with China is not about manufacturing. It is about services.
    • Emerging market competition increasing in services: Although eight of the top ten service exporters are developed countries, emerging-market competition is increasing.
      • New services related rules: This increased competition from emerging markets is prompting a major push by advanced-economy firms to enact new service-related trade rules.
      • An opportunity to protect the developed country producers: The new rules will ensure continued open borders for services. But it will also be an opportunity to protect the advantages of dominant developed-country producers.

    Trade disputes- The combined effects of the two factors

    • There are no easy trade deals anymore.
      • Two conflicting factors: In sum, two factors have increased the uneasiness over international trade and investment arrangements.
      • First-Left behind community: Ordinary people in left-behind communities in developed countries are no longer willing to accept existing arrangements.
      • They want to be heard, and they want their interests protected
      • Second-emerging economy demanding access to service sector: At the same time, emerging-economy elites want a share of the global market for services and are no longer willing to cede ground there. So, there is no easy trade deal anymore.
    • Trade disputes-exercise in power politics
      • High tariffs and ram tactics: Threats of sky-high tariffs to close off markets, for example, and battering-ram tactics to force “fairer” rules on the weaker party.
      • The important difference from the past: One important difference is that the public in emerging markets is more democratically engaged than in the past.
      • Short timed victory: Any success that rich countries have in setting onerous rules for others today could prove pyrrhic.
      • No consensus on the rules: For one thing, it is unclear that there is a consensus on those rules even within developed countries. For example- rules to regulate social media.

    Way forward

    How should developed countries respond to domestic pressures to make trade fairer?

    • Demand lower tariffs from developed countries: For starters, it is reasonable to demand that developing countries lower tariffs steadily to an internationally acceptable norm.
    • Challenge the discriminatory barriers: Discriminatory non-tariff barriers or subsidies that favour their producers excessively should be challenged at the World Trade Organization.
    • Go for less intrusive treaties: To go much beyond these measures—to attempt to impose one’s preferences on unions, regulation of online platforms, and duration of patents on other countries—will further undermine the consensus for trade.
      • Less intrusive trade agreements today may do more for the trade tomorrow
  • [op-ed snap] Examining the slowdown

    Context

    Setting aside the gloomy projections based on short-term economic trends, the long-term and comparative evidence reveal interesting trends about the health of the Indian economy.

    Performance of the Indian economy after 1991

    • Higher growth plateau reached after 1991: After the 1991 economic reforms, the Indian economy reached a higher growth plateau of 7% compared to a prior rate of 3. 85%.
      • The high growth rate during 2003-2011: India witnessed a high growth momentum during 2003-04 and 2010-11 with a period average of 8.45% (GDP with base 2004-05) or 7% (base 2011-12).
      • Ups and downs after 2012: The momentum lost steam in 2011-12 and 2012-13, gradually picked up again gradually to reach the 8% mark in 2015-16, and then started falling consistently to reach 6.63% in 2018-19.
      • Structural dimension? This trend suggests that India’s current growth challenge has a structural dimension as it began in 2011-12.
    • Comparison with China and the world
      • Average at 7.07% after 2011-12: Despite these fluctuations from 2011-12, on average, India clocked a growth rate of  7.07% from 2011 to 2019, a decent figure compared to China’s and the world’s economic growth rates.
      • Whereas like India, the growth of the world economy was fluctuating since 2011, China’s growth declined consistently from 10.64% in 2010 to 6.60% in 2018.

    Why couldn’t India’s growth momentum be sustained after 2010-11?

    • Analysis of five variables: To answer the above question, an in-depth analysis of trends in five key macroeconomic variables was done for two different periods: 2003-04 to 2010-11 and 2011-12 to 2018-19.
      • Consumption.
      • Investment.
      • Savings.
      • Exports.
      • Net foreign direct investment (NFDI) inflows.
    • What emerged from the analysis: The results reveal that compared to 2003-2011, investment and savings rates and exports-GDP ratio declined in the 2011-2019 period.
      • How much the investment declined? The investment rate declined from 34.31% of GDP in 2011-12 to 29.30% in 2018-19.
      • Household vs. corporate sector decline: The investment decline was caused mainly by the household sector and to some extent by the public sector, but not the corporate sector.
      • The decline in investment compensated by NFDI: The slump in the domestic investment rate in the 2011-2019 period was compensated by increased NFDI inflows.
      • On average, NFDI inflow was 1.31% of GDP during 2011-2019 compared to 0.89% during 2003-2011.

    Why tax-cut not help the economy

    • The justified policy of reviving the housing sector: The decline in household sector investment justifies the package of measures introduced by the Central government to revive the housing sector.
    • Why corporate tax cut won’t help much? The questionable policy, however, is the steep cut in the corporate income tax rate from 30% to 22%, aimed at boosting private investment.
      • Given that the corporate investment rate has not eroded severely during 2011-2019, the tax cut would help economic revival.
      • Lost opportunity to spur rural consumption: A part of the largesse offered to Corporate India could have been used to spur rural consumption.

    What the decline in saving rate mean?

    • Importance of savings: The savings rate declined almost consistently from 27% of GDP to 30.51% between 2011 and 2018.
      • This was also caused by a significant fall in the savings of the household sector in financial assets. Corporate savings did not fall.
      • Why the fall in household financial savings needs to be increased? The fall in household financial savings is alarming and needs to be arrested.
      • Savings are required to meet the requirements of those who want to borrow for their investment needs.
      • Saving-investment relation: Lower household savings imply lesser funds available in the domestic market for investment spending.
    • Economic growth powered by consumption: The decline in household savings has pushed up private final consumption expenditure consistently
      • Private final consumption rose from 56.21% of GDP in 2011-12 to 59.39% in 2018-19.
      • Consumption driven economic growth in 2011-19: The increase in private consumption suggests that economic growth during 2011-2019 was powered by consumption, not investment.
      • Investment driven growth during 2003-2011: In contrast, during 2003-2011, growth was powered by investments.
    • So, declining saving rate means a slowdown in the economy may not be due to structural issues.
      • Re-examination of popular view: Thus, the popular view that economic slowdown was caused due to a slowdown in consumption demand needs to be re-examined.
      • There is no concrete evidence to suggest that the economy is facing a structural consumption slowdown.

    Export-GDP ratio decline and what it means

    • Export-GDP decline from 24.54% to 19.74%: India’s exports-GDP ratio declined from 24.54% to 19.74% during 2011-2019.
    • A trend similar to the rest of the world: The decline started from 2014-15, coinciding with a similar trend in the world export-GDP ratio.
      • However, the drop in India’s exports was significantly larger than the world, a cause for concern.
      • The exports- and NFDI-GDP ratio has deteriorated sharply and consistently in China after 2006.
    • Indian economy doing better than China: Sharp decline in China’s export-GDP and NFDI-GDP, together with the consistent fall in China’s GDP growth after 2010, proves that the Indian economy is doing better than China.

    Conclusion

    The popular view that the slowdown in the Indian economy is due to the structural problems needs a re-examination in the view of the decline in investment in tandem with the world.


  • Explained: Fiscal Marksmanship

    Over the past few years, many have questioned the government’s fiscal marksmanship.

    What is fiscal marksmanship?

    • Fiscal marksmanship essentially refers to the accuracy of the government’s forecast of fiscal parameters such as revenues, expenditures and deficits etc.
    • In other words, if the difference between what the government projected as the likely tax revenues in the Budget and the actual figures a year later is large then it reflects poor fiscal marksmanship.
    • In the Indian context, this term gained popularity after Raghuram Rajan, then India’s Chief Economic Advisor stressed on fiscal marksmanship in the Economic Survey for the year 2012-13.
    • He had defined fiscal marksmanship as “the difference between actual outcomes and budgetary estimates as a proportion of GDP”.

    Why does fiscal marksmanship matter?

    • The salience of Budget numbers lies in their credibility.
    • The central purpose of publicly disclosing the Budget or the annual financial statement in a democracy and seeking approval from the legislature is to make the policymaking and governance transparent and participatory.
    • Everyone knows that Budget numbers are forecasts and estimates, and as such, unlikely to tally exactly with the actual numbers a year later.
    • But there is an underlying belief among people that when the government states, say, that its revenues will grow by 12% or that its fiscal deficit will remain within the FRBM Act’s mandate as it is based on genuine calculations.
    • However, if these fiscal forecasts turn out to be way off the mark repeatedly, it will undermine the credibility of the Budget numbers and indeed the Budget presentation itself.

    Why is India’s fiscal marksmanship being questioned?

    Typically, the fiscal marksmanship tends to get dented every time the economy faces a bump during the financial year.

    • For instance, as a result of the extent of the Global Financial Crisis in 2008, budget forecasts in the ensuing years did take a hit.
    • The latest trigger has been the wide discrepancy between what the last couple of budgets — first the interim budget for 2019-20 (presented in February 2019) and then the full budget for 2019-20 (presented in July 2019).
    • It expected the nominal GDP growth to be in 2019-20 and what the First Advance Estimates (FAE), released by the Ministry of Statistics and Programme Implementation in January 2020.
    • For instance, the July 2019 Budget expected nominal GDP to grow by 12% in 2019-20 but the FAE expect the nominal GDP to grow by just 7.5% (which by the way is a 42-year low).
    • Since all budget calculations are based on the nominal GDP, it is expected that this wide variance in nominal GDP will reflect across the board in the coming Budget.

    Impact on revenue

    • The government’s revenues are unlikely to grow anywhere close to the last Budget’s expectation.
    • Indeed, the revenue shortfall is expected to be anywhere between Rs 2 lakh crore to Rs 5 lakh crore.
    • As a result, either the fiscal deficit will overshoot from the budgeted number or the expenditure numbers will be much lower than promised.

    Why has fiscal marksmanship worsened?

    • As mentioned earlier, when an economy’s growth slows down (or picks up) sharply within a year, it is possible that the fiscal forecasts for that year go down (or up) substantially.
    • However, such changes do not happen too often.
    • In the recent past, however, there is one structural change that appears to be contributing to poor fiscal forecasts by the government.
    • This structural change was the government’s decision in January 2017 to advance the presentation of the Union Budget by a whole month.
    • Accordingly, the Union Budget for 2017-18 was presented on February 1 instead of the last working day of February (28th or 29th), as was the norm till then.
    • It meant that the First Advance Estimates, which used to come by January end (after taking into account the economic activity of the first three quarters of the financial year), had to be brought out by the start of January.
    • This, in turn, essentially meant that the estimate of the key nominal GDP data for the current year — on the base of which next year’s nominal GDP and other estimates were to be made — had to be made using the first two quarters of the current fiscal year.

    Why didn’t the government course-correct and project slower economic growth in July 2019 when it presented the full Budget for 2019-20?

    • It is unclear why this was not done. But could be two or three possible reasons.
    • One, the FM may have favoured continuity over the Interim Budget estimates instead of providing a starkly different set of estimates.
    • Two, and a related reason, could be that the government did not have enough time to make the adjustment because it may have required redoing the whole Budget afresh.
    • Or third, because perhaps the government did not recognise the severity of the economic slowdown that has been underway.
  • Reintroduction of African Cheetahs in Indian forests


    The Supreme Court lifted its seven-year stay on a proposal to introduce African cheetahs from Namibia into the Indian habitat on an experimental basis. The plan was to revive the Indian cheetah population.

    Asiatic cheetahs in India

    • In 1947, Maharaja Ramanuj Pratap Singh of Deoghar of Koriya, Chhattisgarh — who was infamous for shooting over 1,150 tigers — reportedly killed the last known Asiatic cheetah in India.
    • In that year, a few miles from Ramgarh village in the state, the Maharaja killed three of the animals — brothers — during a night drive.
    • After that, the Maharaja’s kin continued to report the presence of a few stragglers in the forests of Surguja district, including a pregnant female, up until the late 1960s.
    • Some more unconfirmed sightings were reported in 1951 and 1952, from the Orissa-Andhra Pradesh border and Chittoor district.
    • The latter sighting is generally accepted to be the final credible sighting of a cheetah in India. In 1952, the cheetah was officially declared extinct from India.

    African cheetah and Asiatic cheetah

    • Before Namibia, India had approached Iran for Asiatic cheetahs, but had been refused.
    • The Asiatic cheetah is classified as a “critically endangered” species by the IUCN Red List, and is believed to survive only in Iran.
    • From 400 in the 1990s, their numbers are estimated to have plummetted to 50-70 today, because of poaching, hunting of their main prey (gazelles) and encroachment on their habitat.
    • ‘Critically endangered’ means that the species faces an extremely high risk of extinction in the wild.

    Why does NTCA want to reintroduce cheetahs?

    • A section of conservationists has long advocated the reintroduction of the species in the country.
    • Reintroductions of large carnivores have increasingly been recognised as a strategy to conserve threatened species and restore ecosystem functions.
    • The cheetah is the only large carnivore that has been extirpated, mainly by over-hunting in India in historical times.
    • India now has the economic ability to consider restoring its lost natural heritage for ethical as well as ecological reasons.

    Why was the project halted?

    • The court was also worried whether the African cheetahs would find the sanctuary a favourable clime as far as abundance of prey is concerned.
    • Those who challenged the plan argued that the habitat of cheetahs needed to support a genetically viable population.

    What did court say?

    • The Supreme Court made it clear that a proper survey should be done to identify the best possible habitat for the cheetahs.
    • Every effort should be taken to ensure that they adapt to the Indian conditions.
    • The committee would help, advice and monitor the NTCA on these issues. The action of the introduction of the animal would be left to the NTCA’s discretion.
  • 10 more wetlands from India get the Ramsar site tag

    Ramsar has declared 10 more wetland sites from India as sites of international importance.

    News Ramsar Wetlands

    With this, the numbers of Ramsar sites in India are now 37 and the surface area covered by these sites is now 1,067,939 hectares.

    1. Maharashtra gets its first Ramsar site (Nandur Madhameshwar) ,
    2. Punjab which already had 3 Ramsar sites adds 3 more (Keshopur-Miani, Beas Conservation Reserve, Nangal) and
    3. UP with 1 Ramsar site has added 6 more (Nawabganj, Parvati Agra, Saman, Samaspur, Sandi and Sarsai Nawar).

    Why conserve wetlands?

    • Wetlands provide a wide range of important resources and ecosystem services such as food, water, fibre, groundwater recharge, water purification, flood moderation, erosion control and climate regulation.
    • They are, in fact, are a major source of water and our main supply of freshwater comes from an array of wetlands which help soak rainfall and recharge groundwater.

    Back2Basics

    Ramsar Convention

    • The Convention on Wetlands of International Importance (better known as the Ramsar Convention) is an international agreement promoting the conservation and wise use of wetlands.
    • It is the only global treaty to focus on a single ecosystem.
    • The convention was adopted in the Iranian city of Ramsar in 1971 and came into force in 1975.
    • Traditionally viewed as a wasteland or breeding ground of disease, wetlands actually provide freshwater and food, and serve as nature’s shock absorber.
    • Wetlands, critical for biodiversity, are disappearing rapidly, with recent estimates showing that 64% or more of the world’s wetlands have vanished since 1900.
    • Major changes in land use for agriculture and grazing, water diversion for dams and canals and infrastructure development are considered to be some of the main causes of loss and degradation of wetlands.
  • [pib] Bhuvan Panchayat V 3.0

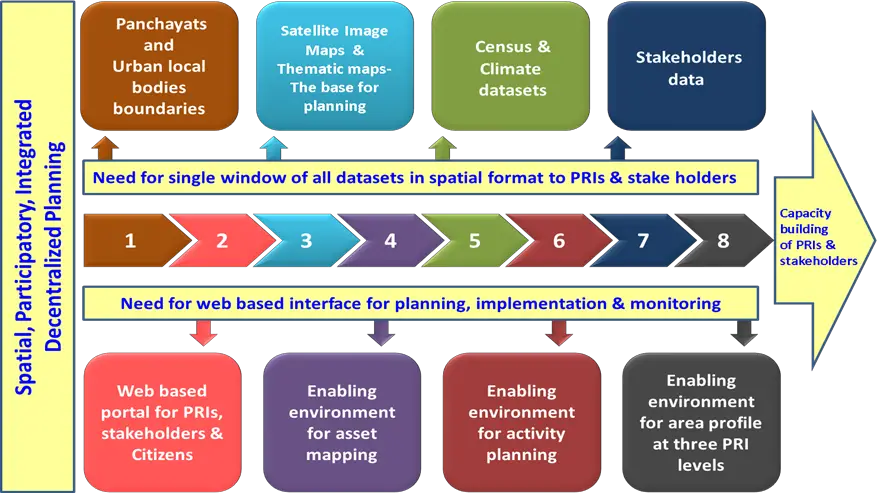
    The Bhuvan Panchayat V 3.0 web portal was recently launched.

    Bhuvan Panchayat Version 3.0

    • For better planning and monitoring of government projects, the ISRO has launched the Bhuvan Panchayat web portal’s version 3.0.
    • For the first time, a thematic data base on a 1:1000 scale for the entire country is available with integrated high resolution satellite data for planning.
    • In the project that will last for at least two years, ISRO will collaborate with the gram panchayat members and stakeholders to understand their data requirements.
    • The third version of the portal will provide database visualisation and services for the benefit of panchayat members, among others.
    • The project is meant to provide geo-spatial services to aid gram panchayat development planning process of the Ministry of Panchayati Raj.
    • The targeted audiences for this portal are Public, PRIs and different stakeholders belonging to the gram panchayats.

    About SISDP Project

    • Space based Information Support for Decentralised Planning at Panchyayat level (SIS-DP) is a national initiative of preparing basic spatial layers useful in planning process for local self governance.
    • ISRO launched SISDP project to assist Gram Panchayats at grassroot level with basic planning inputs derived from satellite data for preparing developmental plans, its implementation and monitoring the activities.
    • The National Remote Sensing Centre (NRSC) is the lead centre to execute the project in collaboration with various State Remote Sensing Centres.
    • SISDP phase I Project was successfully concluded in the year 2016-17.
    • Under Phase II, this project shall be implemented shortly with a enhanced scope of updating geodatabase with latest high resolution remote sensing data and spatial data analytics.
    • For the first time, thematic database on 1:10,000 scale for the entire country is available with high integrated High Resolution satellite data for planning.
  • [op-ed snap] The stress in state finances

    Context

    Lower tax devolution, delays in GST compensation are potential risks to the states.

    Trends in the finances of the state

    • The unaudited fiscal data of 21 states:
      • These states account for around 90 per cent of India’s GDP in 2017-18. The data reveal some trends.
    • First Trend: Revenue receipt sliding down
      • From 15.6 to 4.6 %: At the aggregate level, revenue receipts of these 21 states have grown by a mere 4.6 per cent, sliding down from 15.3 per cent over the same period last year.
      • Decrease in Central tax devolution: The analysis shows that the states’ share in Central tax devolution has slowed the most, contracting by 2.3 per cent during this period, after having grown by 12.1 per cent over the same period last year.
    • Second trend: The Centre’s gross tax revenues are expected to fall short of the budgeted target by a considerable Rs 3- 3.5 trillion this fiscal year.
      • The aggregate tax devolution to all states may be as much as Rs 1.7 – 2.2 trillion lower in the current fiscal year than what was budgeted.
      • This is a key revenue risk staring at the state governments this year.
    • Third trend: States own tax and non-tax revenue contracting.
      • The states’ own non-tax revenues have contracted by 5 per cent during the first eight months of this fiscal year, after an expansion of 15.3 per cent over the same period last year.
      • Decreasing tax revenue: Growth of states’ own tax revenues, the largest source of their revenue receipts, eased to a tepid 2.2 per cent during this period from a healthy 16 per cent over the same period last year.
      • This is in part by the modest rise in collections of the State Goods and Services Tax (SGST).
    • Fourth trend: Increase in the grants from the Centre
      • The primary factor boosting the GST compensation seems to be the low growth in states’ GST revenues relative to the mandated 14 per cent annual growth for the five-year transition period.

    Delay in receipt of the GST collection and the risk

    • Some state has voiced concerns over the delays in receipt of the compensation amount in recent months.
      • The delay has complicated their fiscal position and cash flow management.
      • Risk for the states: The timing of receipt of the compensation is the second major revenue risk facing state governments.
      • If compensation gets delayed to the next fiscal year, we may well find some traditionally revenue surplus states staring at a revenue deficit
      • Case of no GST compensation: But it seems states will have to start gearing up for life without the GST compensation.

    The Rise in State Development Loans or Market borrowing by states

    • SDL rising in first three quarters: According to ICRA’s estimates, net SDL issuance of all states and UTs rose by 15.5 per cent to Rs 2,806 billion in the first three quarters of this fiscal year, up from Rs 2,429 billion last year.
      • The combined gross SDL issuance has expanded by a significant 34.9 per cent to Rs 3,874 billion this fiscal year (April-December), up from Rs 2,872 billion last year.
      • The calendar for state government market borrowings for the fourth quarter indicates tentative gross SDL issuances of Rs 2,086 billion in the quarter, implying a moderate 9.1 per cent growth.
      • But, this conceals a large dip in redemptions.
      • Net SDL issuances will expand by a staggering 55.7 per cent to Rs 1,766 billion in Q4FY20, up from Rs 1,134 billion last year, underlining the stress in state government finances this year.
    • About 25 % rise in borrowing this fiscal: If market borrowings in the fourth quarter are in line with the amounts indicated, total gross borrowing this fiscal year would rise by 24.6 per cent to nearly Rs 6 trillion, up from Rs 4.8 trillion last year.
    • Net borrowing by states as large as Central govt. borrowing: Net borrowings by states would rise by an even sharper 28.3 per cent to Rs 4.6 trillion this year, becoming nearly as large as the Central government’s net market borrowings of Rs 4.7 trillion that have been announced so far for this year.

    Conclusion

    The figure and the trends indicated the financial risk the states are staring at. The government must take measure to revive the economy in order to address the problems faced by the states and ensure that the states are not left in lurch while SGT compensation receipts get delayed.


  • Comprehensive Bodo Settlement Agreement


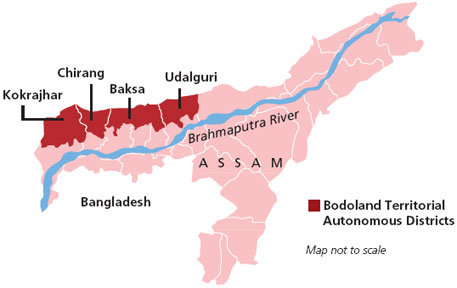
    • The MHA, the Assam government and the Bodo groups have signed an agreement to redraw and rename the Bodoland Territorial Area District (BTAD) in Assam, currently spread over four districts of Kokrajhar, Chirang, Baksa and Udalguri.
    • Several Bodo groups led have been demanding a separate land for the ethnic community since 1972, a movement that has claimed nearly 4,000 lives.

    Background

    • The first Bodo accord was signed with the ABSU in 1993, leading to the creation of a Bodoland Autonomous Council with limited political powers.
    • The BTC was created in 2003 with some more financial and other powers.
    • The BTAD and other areas mentioned under the Sixth Schedule of the Constitution have been exempted from the Citizenship (Amendment) Act, 2019.

    Highlights of the Agreement

    • As per the agreement, villages dominated by Bodos that were presently outside the BTAD would be included and those with non-Bodo population would be excluded.
    • Bodos living in the hills would be conferred a Scheduled Hill Tribe status.
    • The BTAD is to be renamed as the Bodoland Territorial Region (BTR).

    Rehabilitation and relief

    • The criminal cases registered against members of the NDFB factions for “non-heinous” crimes shall be withdrawn by the Assam government and in cases of heinous crimes it will be reviewed.
    • A Special Development Package of Rs. 1500 Crore would be given by the Centre to undertake specific projects for the development of Bodo areas.

    A separate Commission

    • It proposes to set up a commission under Section 14 of the Sixth Schedule to the Constitution which will recommend the inclusion or exclusion of tribal population residing in villages adjoining BTAD areas.
    • In this commission, besides State government, there will be representatives from ABSU and BTC. It will submit its recommendation within six months.

    Changes in Legislature

    • The total number of Assembly seats will go up to 60, from the existing 40.
    • The present settlement has a proposal to give more legislative, executive, administrative and financial powers to BTC.

    Bodo as an official language

    • The Assam government will also notify Bodo language as an associate official language in the state and will set up a separate directorate for Bodo medium schools.
    • Bodo with Devnagri script would be the associate official language for the entire Assam.

    Significance of the agreement

    • The signing of the agreement would “end the 50-year-old Bodo crisis.”
    • Around 1500 cadres of BODO militant factions will be rehabilitated by Centre and Assam Government.
  • Legislative Councils and its abolition

    The Andhra Pradesh Assembly recently passed a resolution to abolish the state’s Legislative Council (LC).

    Legislative Councils

    • The LC or Vidhan Parishad is the upper house in those states that have a bicameral legislature; the lower house being the State Legislative Assembly.
    • Its establishment is defined in Article 169 of the Constitution of India.
    • Each Member of the State LC serves for a six-year term, with terms staggered so that the terms of one third of a State Legislative Council’s membership expire every two years.
    • This arrangement parallels that for the Rajya Sabha, the upper house of the Parliament of India.
    • Q member of LC must be a citizen of India, at least 30 years old, mentally sound, not an insolvent, and must be enrolled on the voters’ list of the state for which he or she is contesting an election.
    • Under Article 171, a Council cannot have more than a third of the number of MLAs in the state, and not less than 40 members.

    Representation in an LC

    MLCs are chosen in the following manner:

    • One third are elected by the members of local bodies such as municipalities, Gram panchayats, Panchayat samitis and district councils.
    • One third are elected by the members of Legislative Assembly of the State from among the persons who are not members of the State Legislative Assembly.
    • One sixth are nominated by the governor from persons having knowledge or practical experience in fields such as literature, science, arts, the co-operative movement and social service.
    • One twelfth are elected by persons who are graduates of three years’ standing residing in that state.
    • One twelfth are elected by persons engaged for at least three years in teaching in educational institutions within the state not lower than secondary schools, including colleges and universities.

    Abolition of LC

    • Article 169(1) of the Constitution allows Parliament to either create or abolish a Council in a state “if the Legislative Assembly of the State passes a resolution to that effect.
    • The resolution must by a majority of the total membership of the Assembly and by a majority of not less than two-thirds of the members of the Assembly present and voting.

    Councils in the Constitution

    • Under Article 168, states can have either one or two Houses of legislature. Article 169 leaves the choice of having a Vidhan Parishad to individual states.
    • The Constituent Assembly was divided on having a second chamber in the states.
    • It was argued that a second House can help check hasty actions by the directly elected House, and also enable non-elected persons to contribute to the legislative process.
    • However, it was also felt that some of the poorer states could ill afford the extravagance of two Houses.
    • It has been pointed out that the Councils can be used to delay important legislation, and to park leaders who have not been able to win an election.

    Councils in other states

    • Besides Andhra Pradesh, five other states have Vidhan Parishads — Bihar (58 members), Karnataka (75), Maharashtra (78), Telangana (40), UP (100).
    • Jammu and Kashmir had a Council until the state was bifurcated into the Union Territories of J&K and Ladakh.
    • In 1986, the M G Ramachandran government in Tamil Nadu abolished the Council.
    • The DMK government passed a law revives it, but the subsequent J Jayalalithaa-led government withdrew it after coming to power in 2010.
    • The Odisha Assembly has passed a resolution for a Legislative Council. Proposals to create Councils in Rajasthan and Assam are pending in Rajya Sabha.
  •  [op-ed of the day] The convergence of rich nations with the rest has gone off track

    Context

    Sound policies are needed to put emerging economies back on a higher growth path and ameliorate regional inequalities.

    The theory of convergence

    • The theory of convergence is one of the most powerful and noblest ideas in economics.
      • What is it? It is the concept that other things being equal, poorer economies should catch up with richer ones so that inequality between the rich and the poor attenuates, and conceivably even disappears over time.
    • Capital is more productive in poor economies: The premise driving convergence is that capital (whether physical or human) is more productive in poor economies than rich ones due to what economists call “diminishing marginal productivity”.
      • In layman’s terms, a small amount of investment yields a greater increase in output where there is less capital than where there is more.
      • Lesser the development more the development: Even more simply, the rate of return on investment is inversely related to the level of economic development.
    • Experience of Japan and Germany after WW 2: The experience of advanced economies gave economists reason to be optimistic that convergence occurs according to the script.
      • Thus, the devastated economies of Europe, along with Japan, quickly caught up with the advanced economies that had not been ravaged by World War II, most notably, the US.
      • Germany and Japan closing the gap: At the end of the war, with their capital stocks destroyed, Germany and Japan were much poorer than the US; by the 1960s, they had closed the gap.

    Globalisation and the unfulfilled hopes of convergence

    • Replication of the rise of Japan and Germany? At one time, it appeared that the same play was at work between emerging economies and advanced economies.
      • Rise of India and China: Economies such as China and India, as well as others, were far outstripping the growth rates of the US and other rich economies,
      • Hope of closing gap: India and China gave hope that at least the more rapidly growing of the emerging economies would close the gap with the rich world within decades rather than centuries.
    • Adoption of technology at low cost: There was presumed to be an additional powerful force working toward convergence.
      • Poorer economies are, almost by definition, far away from the technological frontier at which the richest economies operate.
      • There is thus ample room to absorb newer technologies at relatively low cost and in a relatively short span of time, without encountering slowing growth like the rich economies,
      • In simpler terms, it is difficult and costly to innovate the latest Apple iPhone, but relatively easy to reverse engineers at least some of Apple’s technology.

    Reality: Convergence is faltering

    • Recent evidence suggests that convergence is faltering.
    • World Bank report of retarding convergence: A recent World Bank report documents a worrying slowdown in productivity growth in emerging economies, significantly retarding convergence.
      • Lower productivity: The report’s calculations suggest that emerging economies have 14% lower productivity than they would have had if previous trends of high productivity growth were maintained.
      • Lower commodity exports: For commodity exporters, this is a whopping 19%.
    • The silver lining for faltering economies: According to the World Bank, the main driver of falling productivity are-
      • Insufficient investment in physical and human capital.
      • Insufficient mobility of machines and workers from less productive to more productive sectors of the economy.
    • India’s case: The Indian case clearly bears this out, with languishing investment and unfinished productivity-enhancing reforms, especially in the country’s labour market, being the key culprits behind the sharp slowdown in growth.

    Way forward

    • Repair financial systems: Governments, including India’s, need to do the heavy lifting of repairing damaged financial systems overladen with bad debt.
    • Restore fiscal rectitude.
    • Inflation focused monetary policy: Ensure that monetary policy remains focused on stable inflation rather than being excessively loose as a risky substitute for structural reforms.
    • Reforms: Press ahead with unfinished reforms to capital, land and labour markets.
    • Address the regional disparities: There is a further critical dimension in the case of large multi-region economies such as India.
      • Not only has convergence been faltering between nations, but it has also been faltering between the richer and poorer regions of large nations such as India.

    Conclusion

    The data does not present an epistle of despair, but of hope. The pursuit of sensible and conventional sound economic policies ought to put emerging economies as a group back on a higher growth trajectory. Convergence may yet end up being a parable of promise rather than a fable of folly.