Context
- The recent release of the National family health survey (NFHS) data for 2019-21 allows for a detailed analysis of the progress in the reduction of absolute poverty and related determinants like nutrition.
Poverty estimation in India
- Planning Commission Expert Group (1962): It formulated the separate poverty lines for rural and urban areas at ₹20 and ₹25 per capita per year respectively.
- VM Dandekar and N Rath (1971): They made the first systematic assessment, based on National Sample Survey (NSS) data. They suggested providing 2250 calories per day in both rural and urban areas.
- YK Alagh Committee (1979): It constructed a poverty line for rural and urban areas on the basis of nutritional requirements and related consumption expenditure.
- Lakdawala Committee (1993): It suggested that consumption expenditure should be calculated based on calorie consumption as earlier. State specific poverty lines should be constructed. It asked for discontinuation of scaling of poverty estimates based on National Accounts Statistics.
- Tendulkar Committee (2009): The current official measures of poverty are based on the Tendulkar poverty line, fixed at daily expenditure of ₹27.2 in rural areas and ₹33.3 in urban areas is criticized by many for being too low.
How poverty is estimated under NFHS?
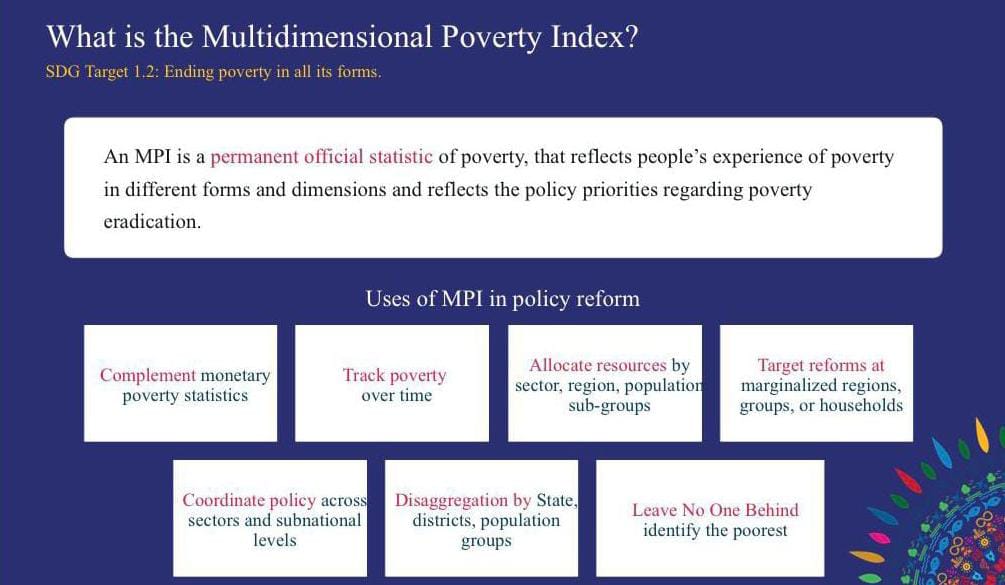
- Multidimensional poverty index: The NFHS surveys are part of a multinational attempt to provide estimates of a multidimensional poverty index. Its computation rests on estimates of poverty according to 10 different indicators:
- Nutrition
- Child mortality
- Years of schooling
- School attendance
- Cooking fuel
- Sanitation
- Drinking water
- Electricity
- Housing
- Assets
- The deprivation index: the deprivation index for each indicator is the per cent poor (deprived) according to that indicator. The aggregation of the 10 indicators into one index involves legitimate issues of weighting, but individual components do not suffer from this drawback.
What are the findings of NFHS?
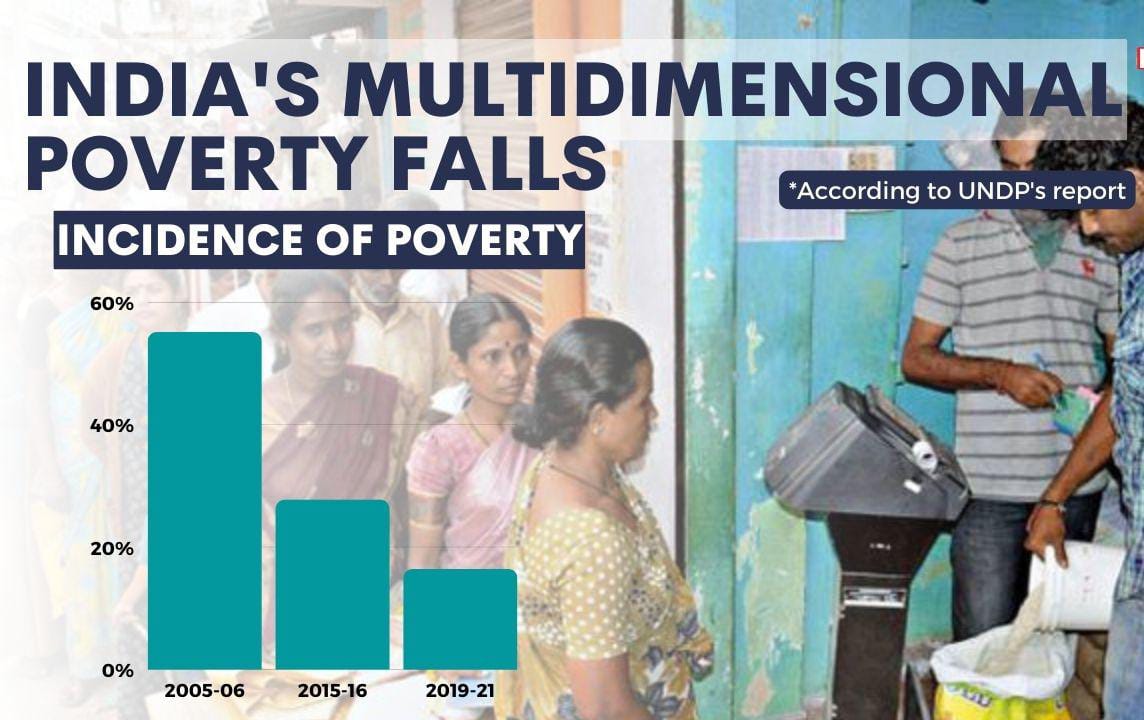
- Multidimensional poverty declined: at a compounded annual average rate of 4.8 per cent per year in 2005-2011 and more than double that pace at 10.3 per cent a year during 2011-2021.
- Declining child mortality: There are some issues with the 2011 child-mortality data, but for each of the 10 components of the MPI index, the rate of decline in 2011-2021 is considerably faster than in 2005-2011.
- Average decline in overall indicators: The average equally weighted decline for nine indicators was 1.9 per cent per annum in 2005-2011 and a rate of 16.6 per cent per annum, more than eight times higher in 2011-2021.
- Consumption inequality decline: Every single household survey or analysis has shown that consumption inequality declined during 2011-2021. This is consistent with the above finding of highly inclusive growth during 2011-2021.
What are the efforts behind inclusive growth and reduced poverty?
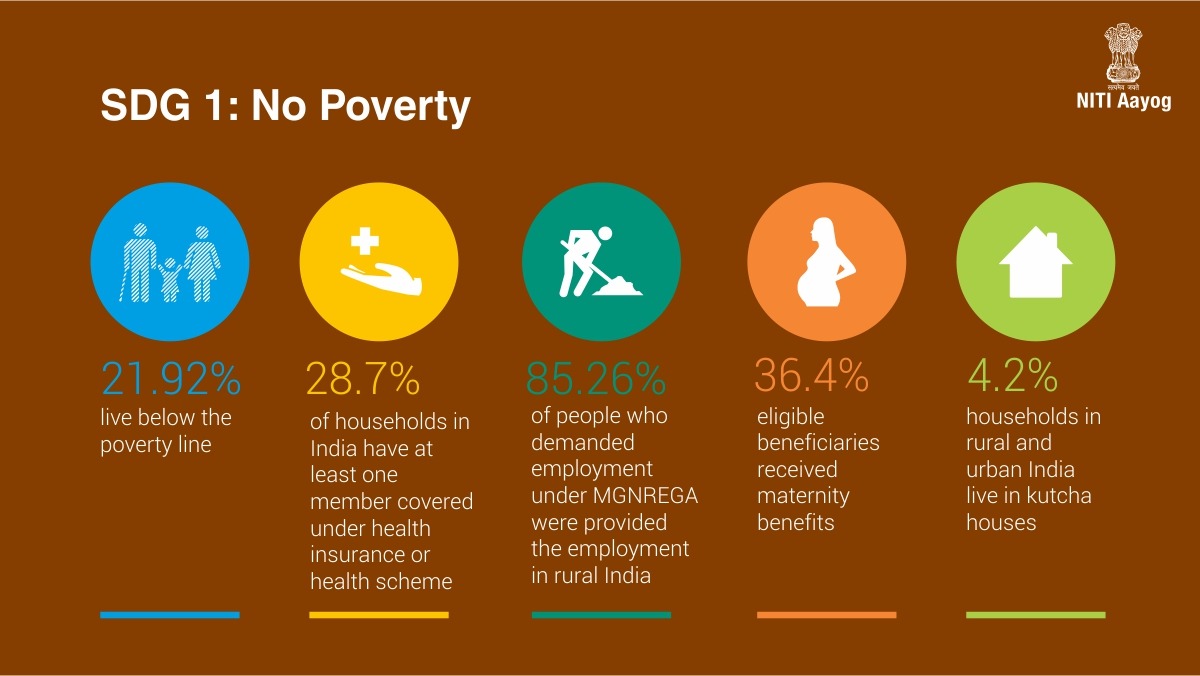
- A major factor behind the inclusive nature of growth during 2011-2021 is the focus of government policies on each of the individual indicator’s indicative of a dignified standard of living. A direct impact of this dedicated fiscal push is that slow-moving variables such as housing, access to cooking fuel, sanitation, etc, have witnessed a remarkable increase.
- Swachh Bharat Mission: The government’s Swachh Bharat mission in 2014-2021 constructed over 110 million toilets even if some were without easy access to water, many were.
- Saubhagya Yojana: Similarly, close to one-third of Indians were deprived of electricity till as recently as 2014. It was only after a dedicated push (Saubhagya Yojana) that India managed to electrify every village, and eventually households. Electricity deprivation declined by a 28.2 per cent rate post-2014; between 2005 and 2011, the rate of decline was close to zero.
- Jan Dhan Yojana: Another example is the Jan Dhan Yojana which made financial inclusion a reality in India, especially for women.
- Ujjwala Yojana: On access to modern cooking fuel (through the Ujjwala Yojana), deprivation was nearly halved from 26 per cent to 14 per cent in just five years. The previous halving (2005/6 to 2015/16) took 10 years.
- Awas Yojana: The affordable housing scheme (Awas Yojana) has meant that less than 14 per cent are now deprived, compared to thrice that number in 2011/12.
- Jal Jeevan Mission: More recently, government has embarked on an ambitious project of ensuring universal access to piped water under the Jal Jeevan Mission. Rural piped water coverage was a little less than 17 per cent in 2019, but is now well above 54 per cent and expected to at least be near, if not meet, the 100 per cent target by 2024.
Conclusion
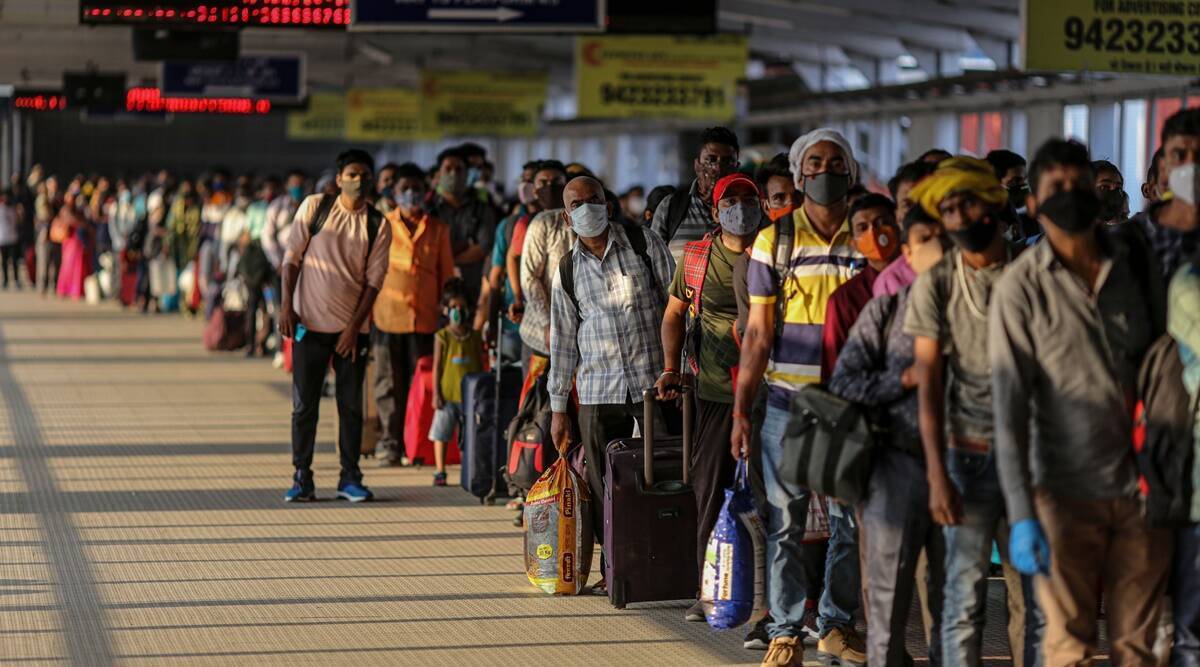
- Extreme poverty in India is surely on decline but pandemic have pushed people again back to the poverty. Pandemic have put the break on inclusive growth of people. Government must realize these and plan accordingly.
Mains Question
Q. Analyze the data of NFHS for poverty estimation in India? How government policies have helped to reduce the extreme poverty in India?