💥Mains Ready By December. Smash Mains & Smash PYQ Admissions Open

Subject: Environment

  • Global Study on Biomass Movement

    Why in the News?

    A new study published in Nature Ecology & Evolution highlights how species mobility, measured as biomass movement, shapes ecosystems and reflects human ecological dominance.

    About the Concept of Biomass Movement:

    • Overview: Biomass movement is the product of a species’ total biomass and the distance it travels annually, representing the mass of living matter displaced across ecosystems each year.
      • Biomass movement = (Total biomass of a species) × (Distance it travels annually).
    • Purpose: Quantifies how living organisms contribute to nutrient transport, seed dispersal, and energy flow through movement.
    • Comparative Metric: Enables cross-species comparison of ecological influence via mobility, bridging animal ecology and global biogeography.
    • Analytical Value: Provides a standardised ecological indicator to study both natural migrations and human-induced mobility patterns.
    • Anthropocene Context: Serves as a unified measure of ecological and energetic impact in a human-dominated epoch.
    • Scientific Basis: Concept explored in Nature Ecology & Evolution (2025) to assess species-level and anthropogenic movement on a global scale.

    Key Highlights with Example:

    • Arctic Tern: Weighing ~100 g, travels ~90,000 km annually (Arctic–Antarctica circuit), the longest animal migration known.
    • Collective Biomass Movement: Two million terns contribute only 0.016 gt/km/yr, due to low body mass despite vast distances.
    • Grey Wolf: Records 0.03 gt/km/yr, higher due to larger body size and wider terrestrial range.
    • Serengeti Migration: Over a million wildebeests, gazelles, and zebras generate biomass movement 20× greater than wolves.
    • Human Parallel: The total biomass moved in the FIFA World Cup equals that of major animal migrations, highlighting scale disparity between species.

    Human Biomass Movement and Its Consequences:

    • Magnitude: Humans move an estimated ~4,000 gt/km/yr, the largest on Earth, 40× greater than all wild land mammals combined.
    • Mobility Patterns: Average human travels 30 km/day, mostly motorised, 65% by cars/motorcycles, 10% by air, 5% by rail.
    • Economic Disparity: Two-thirds of total human mobility occurs in high- and upper-middle-income countries, reflecting global inequality.
    • Ecological Effects: Drives carbon emissions, urban sprawl, resource depletion, and land fragmentation.
    • Marine Decline: Marine animal mobility has halved since 1850 due to industrial fishing and whaling.
    • Livestock Factor: Domesticated cattle show biomass movement comparable to humans, indicating the ecological weight of livestock farming.
    • Wildlife Contrast: Combined biomass movement of all wild land mammals (excluding bats) is only 30 gt/km/yr, underscoring human dominance.
    • Anthropocene Insight: Demonstrates that human and domesticated animal mobility now defines Earth’s biogeochemical and ecological motion.
  • Bihar’s Gogabeel Lake declared India’s 94th Ramsar Site

    Why in the News?

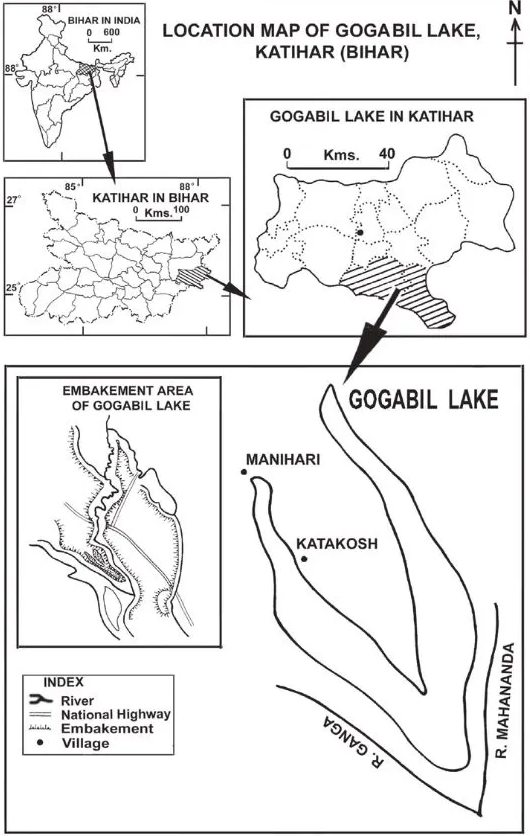
    Gogabeel Lake, located in Katihar district, Bihar, has been officially designated as India’s 94th Ramsar Site and sixth from Bihar.

    Bihar's Gogabeel Lake declared India's 94th Ramsar Site

    About Gogabeel Lake:

    • Overview: An oxbow lake situated in Katihar district, Bihar, within the Trans-Gangetic Plains, formed between the Ganga and Mahananda rivers.
    • Hydrological Nature: Connects to both rivers during monsoon floods, functioning as a dynamic floodplain wetland.
    • Legal Status: Declared Bihar’s first community reserve, co-managed by local communities and forest authorities.
    • Ecological Significance: Serves as a key habitat for migratory birds and a breeding site for vulnerable species such as the Lesser Adjutant Stork, Black-necked Stork, and Smooth-coated Otter.
    • Biodiversity: Hosts 90+ bird species (including 30 migratory), wetland flora, and fish species like Helicopter Catfish (Wallago attu).
    • Ecosystem Services: Provides flood mitigation, groundwater recharge, carbon storage, and climate regulation, contributing to the Gangetic ecosystem’s stability.
    • Cultural Linkages: Integral to local festivals like Sirva, Adra, and Chhath, symbolising people–nature harmony in rural Bihar.
  • [5th November 2025] The Hindu Op-ed: India’s forests hold the future

    PYQ Relevance

    [UPSC 2024] Environmental pollution is a major environmental issue in India. Discuss the various mitigation measures to deal with this problem and also the government’s initiatives in this regard.

    Linkage: Even though no direct linking PYQ is found. But here forest restoration and carbon sink creation are key mitigation measures in controlling pollution and ensuring ecosystem resilience.

    Mentor’s Comment

    India’s revised Green India Mission (GIM) signals a decisive shift in the nation’s ecological vision from expanding forest area to restoring ecosystem resilience. The article examines the ambitious plan to restore 25 million hectares by 2030, challenges in afforestation design, and how India can convert green cover into genuine carbon and community assets.

    Introduction

    India stands at the crossroads of economic growth and ecological sustainability. The recent revision of the Green India Mission (GIM) underscores the goal of restoring 25 million hectares of degraded forest and non-forest land by 2030, directly linked to India’s climate pledge of creating a carbon sink of 3.39 billion tonnes of CO₂ equivalent. The central question now is not just how much land India restores, but how well it does so.

    Why in the News

    The release of the revised Green India Mission blueprint (2025) marks a crucial development in India’s environmental policy. For the first time, the emphasis shifts from mere tree planting to ecological restoration and community participation. With India’s forests showing a 12% decline in photosynthetic efficiency (IIT Kharagpur-BITS Pilani, 2025), the focus on quality over quantity becomes imperative. The GIM’s success or failure will significantly impact India’s climate commitments and rural livelihoods dependent on forests.

    Afforestation in India: From Quantity to Quality

    1. New Scientific Evidence: A 2025 IIT Kharagpur study found a 12% decline in photosynthetic efficiency of dense forests due to rising temperatures and soil drying.
    2. Beyond Canopy Cover: The discovery challenges the old assumption that “more trees mean more carbon sinks” and instead emphasizes ecological resilience.
    3. Shift in Mission Focus: Between 2015-2021, ₹575 crore was disbursed for afforestation; forest and tree cover rose from 21.16% to 25.17% by 2023 yet qualitative degradation persists.

    What Are the Core Gaps in India’s Afforestation Strategy?

    1. Community Participation: Despite the Forest Rights Act (2006) empowering local communities, many plantation drives bypass their consent, eroding trust and legitimacy.
    2. Ecological Design: Monoculture plantations of eucalyptus and acacia reduce biodiversity, leaving forests vulnerable to drought and pests.
    3. Financing and Implementation: The Compensatory Afforestation Fund Management and Planning Authority (CAMPA) holds ₹95,000 crore, but fund utilization remains inconsistent. Delhi, for instance, used only 23% of funds between 2019-2024.

    What Are the Emerging Success Stories?

    1. Odisha: Joint Forest Management Committees are now part of revenue-sharing and planning processes.
    2. Chhattisgarh: Forest departments are experimenting with biodiversity-sensitive plantations and promoting village carbon markets.
    3. Himachal Pradesh: Launched biochar programmes to reduce fire risk and generate carbon credits.
    4. Tamil Nadu: Nearly doubled mangrove cover in three years, advancing coastal carbon storage.

    How Can India Finance and Implement Effective Restoration?

    1. Utilizing CAMPA Funds: Efficient allocation and transparent dashboards can ensure accountability.
    2. Innovative Tools: Integration of carbon markets, adaptive management, and public dashboards can align national and state-level efforts.
    3. Technical Training: Expanding institutes like IIFM Bhopal or the upcoming Byrnihat Ecological Institute to train field staff in ecological design.
    4. Public-Community Collaboration: Linking local monitoring with national reporting systems will enhance ground-level legitimacy and data reliability.

    What Lies Ahead for India’s Forest Future?

    1. Smarter Restoration: Focus must shift from planting to ecological engineering using native species and local hydrology.
    2. Inclusive Climate Action: Empowering communities ensures climate justice and sustainable forest governance.
    3. National Movement Approach: Collaboration between civil society, research institutions, and local communities can transform GIM from a government scheme to a people’s mission.

    Conclusion

    India’s forests are more than carbon sinks, they are the nation’s ecological infrastructure. The revised Green India Mission represents a shift from greenwashing metrics to resilient ecosystems. With rigorous monitoring, community inclusion, and scientific restoration, India can make its forests not only a tool for carbon sequestration but a foundation for climate-resilient growth.

  • [4th November 2025] The Hindu Op-ed: The case for energy efficiency

    PYQ Relevance

    [UPSC 2022] Do you think India will meet 50 percent of its energy needs from renewable energy by 2030? Justify your answer. How will the shift of subsidies from fossil fuels to renewables help achieve the above objective? Explain.

    Linkage: The question relates to India’s renewable energy transition and the feasibility of meeting its 2030 targets. The article links by emphasizing that without efficiency and subsidy realignment, rising renewable capacity alone cannot ensure a cleaner grid.

    Mentor’s Comment

    India’s clean energy transition faces a paradox: even as renewable capacity doubles, the electricity flowing into homes is becoming dirtier. The rise in India’s grid emission factor despite record renewable expansion reveals deep systemic challenges, capacity-generation mismatch, demand peaks, and underutilization of renewables. This editorial decodes why energy efficiency, the “first fuel”, must become central to India’s decarbonisation strategy.

    Introduction

    India’s non-fossil fuel sources now account for about 50% of total installed capacity, yet its grid emission factor (GEF) has worsened from 0.703 tCO₂/MWh in 2020-21 to 0.727 tCO₂/MWh in 2023-24 (Central Electricity Authority). This anomaly highlights that while renewable capacity has expanded, fossil-fuel-based generation still dominates. To make India’s grid cleaner and more reliable, scaling up energy efficiency and flexibility is essential.

    Why Is India’s Grid Getting Dirtier Despite More Renewables?

    1. Grid Emission Factor (GEF): This measure of carbon intensity has increased instead of falling, reflecting rising dependence on coal during peak demand hours.
    2. Installed capacity doesn’t always equate to generation: Renewables deliver less electricity annually compared to thermal or nuclear sources.
    3. Coal’s dominance: Fossil fuels continue to meet the marginal demand, making India’s grid more emission-intensive even with rising renewable capacity.

    What Explains the Capacity-Generation Mismatch?

    1. Low capacity utilisation: Solar and wind plants run at only 15-25% utilisation, versus 65-90% for coal and nuclear.
    2. Temporal mismatch: Solar peaks during afternoon hours, while demand peaks at night, requiring fossil backup.
    3. System inflexibility: Lack of energy storage, flexible grids, and responsive pricing structures forces reliance on coal during non-solar hours.
    4. Data point: In 2023-24, renewables (including hydro) supplied only 22% of total electricity; the rest came from fossil fuels.

    How Can Energy Efficiency Bridge the Gap?

    1. First fuel approach: Efficiency reduces demand before generation, lowering peak load, reducing reliance on coal during evening peaks.
    2. Economic benefit: Bureau of Energy Efficiency (BEE) reports savings of 200 million tonnes of oil equivalent (MTOE) between FY2017-FY2023. This is equivalent to 1.29 GT of CO₂ and savings of ₹76,000 crore.
    3. Enabler of renewables: Efficiency flattens demand peaks, preventing renewable curtailment and enhancing integration of solar and wind.
    4. Preventing lock-in: Replacing old, inefficient technologies avoids long-term carbon lock-ins.

    What Policy and Structural Changes Are Needed?

    1. Battery integration: Enabling homes and offices to connect storage systems for balancing demand.
    2. Appliance efficiency: Transition to 4-star and 5-star appliances with updated standards.
    3. Market mechanisms: Incentives for consumers to shift electricity usage to periods of high renewable availability.
    4. Scrappage policy: Phasing out inefficient fans, motors, and air conditioners through targeted rebates.
    5. RTC renewable procurement: Promote Round-the-Clock (RTC) renewable electricity, currently costing less than ₹5/kWh, to replace coal power.

    Why Energy Efficiency Must Be at the Core of Decarbonisation Strategy

    1. Invisible yet indispensable: Efficiency is distributed and diffuse, but without it, India’s energy transition remains incomplete.
    2. Global comparison: Nations like France, Norway, and Sweden have achieved GEFs of 0.1-0.2 tCO₂/MWh via high efficiency and nuclear-hydro mix.
    3. India’s targets: National Electricity Plan (2023) projects India’s GEF to fall to 0.548 by 2026-27 and 0.430 by 2031-32.
    4. Integrated approach: A balance of renewable expansion, storage, and efficiency measures is key to achieving India’s Net Zero by 2070 target.

    Conclusion

    India’s clean energy paradox underscores that generation capacity alone cannot drive decarbonisation. Efficiency, flexibility, and policy coherence must shape the next phase of transition. Making energy efficiency the “first fuel” and embedding it across homes, industries, and infrastructure will determine how India powers its future while keeping its grid truly green.

  • Pampadum Shola National Park

    Why in the News?

    At Pampadum Shola National Park, invasive Australian wattles are being removed and native grasslands restored naturally leading streams to flow again and biodiversity to rejuvenate.

    About Pampadum Shola National Park:

    • Location: Situated in Idukki district, Kerala, near the Tamil Nadu border, about 35 km from Munnar.
    • Area & Status: Smallest NP in Kerala (11.753 sq km); declared in 2003 to protect the shola–grassland ecosystem.
    • Landscape: Lies at 1,600–2,400 m elevation within the Anamalai–High Range landscape, part of the Anamudi Sub-cluster (UNESCO World Heritage Site).
    • Hydrology: Serves as a watershed for the Pambar and Vaigai Rivers, vital to Tamil Nadu’s plains.
    • Flora & Fauna: Features evergreen forests, moist deciduous patches, and montane grasslands; key species include Nilgiri Marten, Kerala Laughing Thrush, Nilgiri Tahr, and Indian Giant Squirrel.
    • Restoration Efforts: Ecological restoration (2020–2024) underway, removal of invasive Australian wattles (Acacia mearnsii) has revived native grasslands and streams.
    • Climate & Tourism: Experiences cool, misty weather (6°C–30°C) with dual monsoons; regulated trekking under Forest Department supervision.

    What are Shola Forests?

    • Overview: Tropical montane evergreen forests found above 1,600 m in the Western Ghats across Kerala, Tamil Nadu, and Karnataka.
    • Etymology: Derived from Tamil word “solai”, meaning sacred grove or thicket.
    • Structure: Occur as a mosaic of stunted evergreen forests and grasslands, forming the shola–grassland ecosystem.
    • Floral Composition: Dominated by Michelia nilagirica, Rhododendron, Eurya, Schefflera, and Elaeocarpus species with rich epiphyte growth.
    • Ecological Role: Act as natural sponges, absorbing rain, recharging aquifers, and feeding perennial rivers like Cauvery, Bhavani, Vaigai, and Thamirabarani.
    • Biodiversity: Support high endemism, harbouring Nilgiri Tahr, Lion-tailed Macaque, Nilgiri Pipit, and other rare fauna.


    [UPSC 2020] Which of the following Protected Areas are located in Cauvery basin?

    1. Nagarhole National Park

    2. Papikonda National Park

    3. Sathyamangalam Tiger Reserve

    4. Wayanad Wildlife Sanctuary

    Select the correct answer using the code given below:

    (a) 1 and 2 only (b) 3 and 4 only (c) 1, 3 and 4 only * (d) 1, 2, 3 and 4


  • Heavy metals found in Cauvery fishes

    Why in the News?

    Researchers from Bharathidasan University, Tiruchirappalli, reported alarming levels of heavy metal pollution in the Cauvery River and its fish species, warning against excessive consumption.

    Key Findings of the Study:

    • Scope & Period: Conducted August 2023–February 2024, covering 18 sediment and 10 fish-sampling sites, analysing chromium (Cr), cadmium (Cd), copper (Cu), lead (Pb), and zinc (Zn).
    • Contamination Levels: Several rivers stretches showed cadmium and lead concentrations exceeding international safety limits in both sediments and fish tissues.
    • Pollution Hotspots: The Erode stretch emerged as the most polluted, influenced by textile dyeing, electroplating, tannery effluents, urban sewage, and agricultural runoff.
    • Bioaccumulation Pattern: Metal concentration followed the trend, liver > gills > muscle, reflecting tissue-specific accumulation in aquatic species.
    • Toxic Metal Dominance: Cadmium and lead were identified as the most toxic, persistent, and bioaccumulative, posing long-term ecological and health hazards.

    Risks Associated:

    • Ecological Impact:
      • Heavy metals disrupt fish reproduction, growth, and survival, destabilising aquatic food webs.
      • Sediment toxicity alters microbial and plankton communities, reducing biodiversity and ecosystem resilience.
    • Human Health Risks:
      • Consumption of contaminated fish can cause carcinogenic and non-carcinogenic effects, particularly from cadmium and lead.
      • Cadmium affects kidneys and bones, while lead impairs nervous and cognitive functions, especially in children.
      • Chronic exposure linked to liver dysfunction, hypertension, and cancer.
    • Safe Consumption Limit:
      • Researchers recommend ≤2 fish servings/week (250 g each) to minimise health risk.
      • Continuous intake leads to cumulative toxicity and higher disease risk.

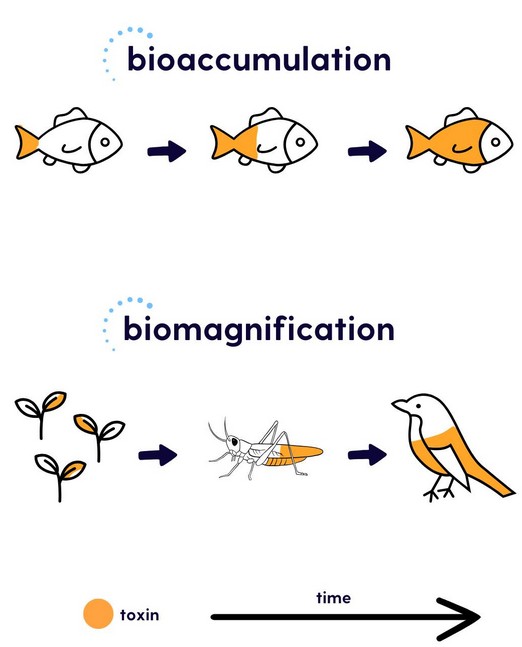
    Back2Basics: Bioaccumulation and Biomagnification

    What is Bioaccumulation?

    • Overview: It is the gradual buildup of toxic substances, such as heavy metals or pesticides, in the tissues of living organisms over time.
    • Mechanism: When uptake (from food, water, or sediment) exceeds the rate of excretion, contaminants accumulate within the organism’s body.
    • Example: Fish in the Cauvery absorb cadmium and lead from contaminated sediments and water faster than they can eliminate them, leading to higher internal concentrations than in their environment.

    What is Biomagnification?

    • Overview: It refers to the progressive increase in the concentration of toxins as they move up the food chain.
    • Process: Smaller aquatic organisms ingest pollutants → fish eat these organisms → humans consume contaminated fish, resulting in magnified exposure.
    • Consequence: Top predators, including humans, end up with the highest toxin concentrations, making biomagnification a significant public health hazard in contaminated ecosystems.


    [UPSC 2024] With reference to perfluoroalkyl and polyfluoroalkyl substances (PFAS) that are used in making many consumer products, consider the following statements:

    1. PFAS are found to be widespread in drinking water, food, and food packaging materials.

    2. PFAS are not easily degraded in the environment.

    3. Persistent exposure to PFAS can lead to bioaccumulation in animal bodies.

    Which of the statements given above are correct?

    Options: (a) 1 and 2 only (b) 2 and 3 only (c) 1 and 3 only (d) 1,2 and 3*


  • Rowmari- Donduwa Wetland Complex

    Why in the News?

    Environmentalists in Assam have proposed the Rowmari–Donduwa Wetland Complex for designation as a Ramsar Site, citing its exceptional biodiversity and ecological services.

    Assam’s Wetland Context:

    • Current Scenario: Assam has 3,500+ wetlands (≈1.01 lakh ha), but only Deepor Beel (2002) is a Ramsar Site.
    • Conservation Importance: Designating Rowmari–Donduwa would fill a 20-year conservation gap and enhance Assam’s global wetland profile.
    • Regional Context: North-East India’s Ramsar Sites-  Deepor Beel (Assam), Loktak (Manipur), Rudrasagar (Tripura), Pala (Mizoram).

    About Rowmari–Donduwa Wetland Complex:

    • Overview: Situated within the Laokhowa–Burhachapori Wildlife Sanctuary, Nagaon district, Assam, forming part of the Kaziranga–Orang landscape.
    • Ecological Role: An interconnected floodplain–marsh system acting as an ecological corridor between Kaziranga and Orang National Parks, supporting wildlife movement and genetic diversity.
    • Biodiversity Significance: The 6th Kaziranga Wetland Bird Census (2025) recorded 47,000+ birds of 120 species, exceeding counts from Deepor Beel and Loktak Lake.
    • Key Species: Hosts globally threatened birds, Knob-billed Duck, Lesser Adjutant Stork, Black-necked Stork, Ferruginous Pochard, and Common Pochard.
    • Ecosystem Services: Provides flood control, groundwater recharge, carbon storage, and supports fisheries and ecotourism-based livelihoods.
    • Ramsar Eligibility: Fulfils 8 of 9 Ramsar criteria, qualifying as a Wetland of International Importance.

    Back2Basics: Ramsar Convention

    • Establishment: Signed on 2 February 1971 in Ramsar, Iran.
    • Objective: Provide a framework for conservation and wise use of wetlands and their resources.
    • Functions:
      • Identify and designate wetlands of international importance.
      • Promote effective management of wetlands.
      • Foster international cooperation for conservation.
    • Members: 173 countries (as of 2025).
    • India and Ramsar:
      • India joined in 1982.
      • First Ramsar site: Chilika Lake, Odisha (1981).
      • Current total: 93 sites (Sept 2025), covering 13,60,718 hectares.
      • Growth: From 26 sites in 2012 to 93 in 2025 (51 added since 2020).
      • State-wise: Tamil Nadu has the highest (20), followed by Uttar Pradesh (10).
      • About 10% of India’s total wetland area is under Ramsar listing.
    • Montreux Record: List of Ramsar sites under threat of ecological change.
      • 48 sites globally (2025).
      • 2 Indian sites included: Keoladeo National Park (Rajasthan) and Loktak Lake (Manipur).
    • World Wetlands Day: Celebrated on February 2nd every year.
      • 2025 Theme: “Protecting Wetlands for Our Common Future”.

    Criteria for Declaration (9 Criteria):

    A wetland can be declared a Ramsar site if it meets at least one of these:

    1. Has unique, rare, or representative wetland types.
    2. Supports vulnerable, endangered, or endemic species.
    3. Provides critical habitat for waterfowl, especially during migration.
    4. Contains significant ecological, botanical, zoological, limnological, or hydrological features.
    5. Supports biodiversity conservation and scientific research.
    6. Provides ecosystem services like flood control, groundwater recharge, and water purification.
    7. Has cultural, spiritual, or recreational importance.
    8. Ensures sustainable livelihoods for local communities.
    9. Faces threats requiring international cooperation for conservation.


    [UPSC 2022] Consider the following pairs:

    Wetland/Lake Location

    1. Hokera Wetland- Punjab

    2. Renuka Wetland- Himachal Pradesh

    3. Rudrasagar Lake- Tripura

    4. Sasthamkotta Lake- Tamil Nadu

    How many pairs given above are correctly matched?

    Options: (a) Only one pair (b) Only two pairs* (c) Only three pairs (d) All four pairs


  • Nauradehi WLS to become 3rd home for Cheetahs in Madhya Pradesh

    Why in the News?

    Madhya Pradesh CM has announced that Nauradehi Wildlife Sanctuary will soon become the third home for cheetahs in the State, after Kuno National Park and Gandhi Sagar Sanctuary.

    About Nauradehi Wildlife Sanctuary:

    • Overview: Largest wildlife sanctuary in Madhya Pradesh, covering 1,197 sq km across Sagar, Damoh, and Narsinghpur districts; located between the Narmada and Ganga river basins, forming a key ecological transition zone.
    • Establishment: Declared in 1975 to conserve the Indian wolf (Canis lupus pallipes), the flagship species. Habitat includes dry deciduous forests, scrublands, and grasslands supporting leopard, sloth bear, blackbuck, nilgai, chital, and hyena populations.
    • Upgradation (2024): Elevated to a Tiger Reserve to strengthen protection and become eligible for Project Cheetah under the National Tiger Conservation Authority (NTCA).
    • Connectivity: Linked with Panna Tiger Reserve and Satpura Tiger Reserve through the Nauradehi–Panna corridor, ensuring gene flow across Central India’s forest landscapes.
    • Habitat Characteristics: Open woodlands, scrub forests, and wide grass patches with undulating terrain ideal for high-speed pursuit predators like cheetahs.
    • Prey Base: Rich in blackbuck (Antilope cervicapra), chital (Axis axis), nilgai (Boselaphus tragocamelus), and wild boar.
    • Environmental Setting: Moderate rainfall, tributaries of the Narmada River, and dry tropical climate create a balanced hydrological regime.
    • Scientific Endorsement: Recognised by Wildlife Institute of India (WII) and NTCA as among India’s most feasible future cheetah habitats.

    Nauradehi WLS to become 3rd home for Cheetahs in Madhya Pradesh

    Cheetahs and their Reintroduction in India:

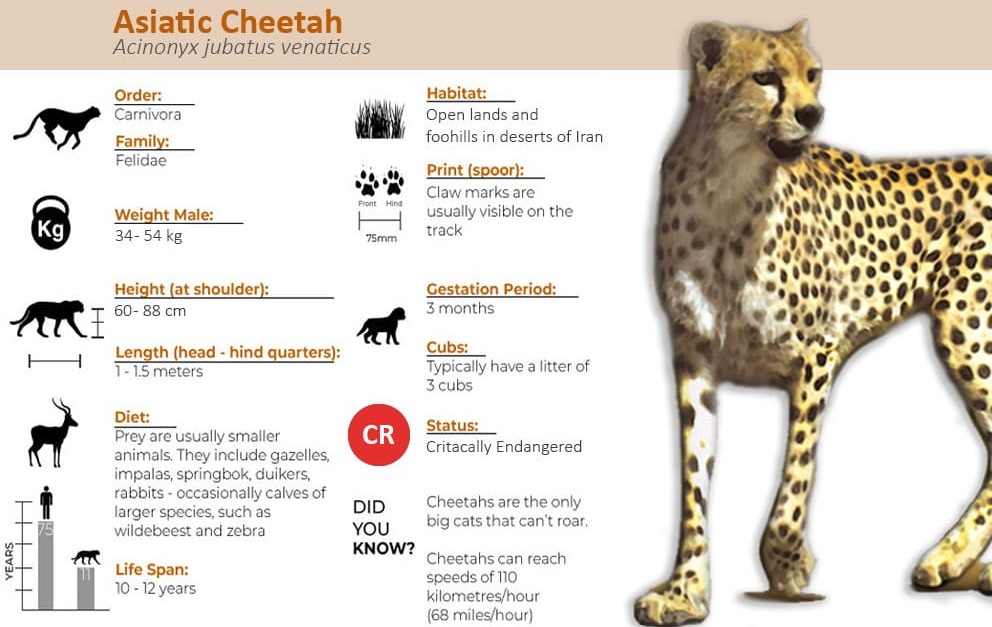
    • Overview: The cheetah (Acinonyx jubatus) is the world’s fastest land mammal (80–128 km/h). Two subspecies: African cheetah (A.j. jubatus) across Africa and Asiatic cheetah (A.j. venaticus) confined to Iran (< 30 individuals).
    • Conservation Status: Asiatic subspecies Critically Endangered by the IUCN; global population ≈ 6,500 mature individuals.
    • Extinction in India: Last recorded in Koriya (Chhattisgarh) in 1947; officially declared extinct in 1952 due to hunting and grassland degradation.
    • Project Cheetah (2022): Implemented by Ministry of Environment, Forest and Climate Change (MoEFCC) and NTCA with WII support; aims to restore cheetahs in India’s grasslands and revive lost ecological roles.
    • Translocation Phases: Eight cheetahs from Namibia (Sept 2022) and twelve from South Africa (Feb 2023) released at Kuno National Park (Madhya Pradesh).
    • Meta-Population Plan: To establish a connected population across Kuno, Gandhi Sagar, Nauradehi, and Mukundra Hills (Rajasthan) ensuring genetic diversity and landscape-level connectivity.
    • Long-Term Goal: Create a self-sustaining population of 35–40 individuals within 15 years through science-based, landscape-driven restoration.
    • Current Phase: Majority under semi-captive adaptation at Kuno; expansion to Nauradehi and Gandhi Sagar Tiger Reserves planned to reduce crowding and enhance resilience.


    [UPSC 2012] Consider the following:
    1. Black-necked crane 2. Cheetah 3. Flying squirrel 4. Snow leopardWhich of the above are naturally found in India?(a) 1, 2 and 3 only  (b) 1, 3 and 4 only*  (c) 2 and 4 only (d) 1, 2, 3 and 4


  • Kunming Biodiversity Fund (KBF)

    Why in the News?

    In October 2025, seven countries, Cook Islands, Madagascar, Mexico, Nepal, Sri Lanka, Turkey, and Uganda, secured $5.8 million in grants from the Kunming Biodiversity Fund (KBF) to promote nature-friendly agriculture.

    What is Kunming Biodiversity Fund (KBF)?

    • Objective: To assist developing nations in implementing the Kunming–Montreal Global Biodiversity Framework (KMGBF), aimed at halting biodiversity loss by 2030 and restoring ecosystems by 2050.
    • Overview: Established in 2021 during Part 1 of COP-15 at Kunming, China, under China’s presidency of the UN Convention on Biological Diversity (CBD).
    • Initial Contribution: China pledged 1.5 billion yuan (~USD 200 million) as seed funding.
    • Administration: Managed by China’s Ministry of Ecology & Environment, UN Environment Programme (UNEP), and the CBD Secretariat; functions as a Multi-Partner Trust Fund with UNDP and others.
    • Focus Areas:
      • Support for National Biodiversity Strategies and Action Plans (NBSAPs).
      • Ecosystem restoration, invasive-species control, and sustainable agriculture.
      • Empowerment of Indigenous Peoples and local communities in conservation.
    • 2025 Allocation: Released USD 5.8 million via FAO to Cook Islands, Madagascar, Mexico, Nepal, Sri Lanka, Türkiye, and Uganda for biodiversity-linked agriculture and resilience projects.
    • Alignment: Advances KMGBF Target 19 (mobilising USD 200 billion per year by 2030) and helps bridge the USD 700 billion annual global biodiversity finance gap.
    • Global Significance: Serves as a cornerstone of biodiversity finance, complementing the GEF, Green Climate Fund, and Cali Fund (2025) to mobilise global conservation resources.

    India and the KBF:

    • Funding Status: As of 2025, India has not yet received direct KBF funding but remains eligible as a biodiversity-rich developing country and active CBD Party.
    • National Alignment: India’s National Biodiversity Action Plan (NBAP), National Biodiversity Mission, and Green India Mission align with KBF priorities, especially ecosystem restoration, biodiversity mainstreaming, and community participation.
    [UPSC 2023] Consider the following statements:

    1. In India, the Biodiversity Management Committees are key to the realization of the objectives of the Nagoya Protocol.

    2. The Biodiversity Management Committees have important functions in determining acces and benefit sharing, including the power to levy collection fees on the access of biological resources within its jurisdiction.

    Which of the statements given above is/are correct?

    Options: (a) 1 only (b) 2 only (c) Both 1 and 2* (d) Neither 1 nor 2


  • [30th October 2025] The Hindu Op-ed: A decade after Paris Accord, an unstoppable transition

    PYQ Relevance

    [UPSC 2024] Write a review on India’s climate commitments under the Paris Agreement (2015) and mention how these have been further strengthened in COP26 (2021). In this direction, how has the first Nationally Determined Contribution intended by India been updated in 2022? (Answer in 250 words)

    Linkage: The question builds directly on the Paris Agreement’s decade-long progress and India’s evolving role from commitment at Paris (2015) to enhanced ambition at COP26 and updated NDCs in 2022. This reflects the ongoing Paris to post-Paris transition architecture discussed in the article.

    Mentor’s Comment

    Ten years after the Paris Agreement, the world stands at a pivotal juncture. Despite unprecedented challenges, rising global temperatures, extreme weather, and persistent dependence on fossil fuels, the Paris framework has redefined multilateral climate cooperation. This article examines how the Paris Agreement has evolved into a transformative global instrument, its tangible outcomes, India’s role, and the emerging roadmap for climate justice and transition.

    Introduction

    Adopted at COP21 in 2015, the Paris Agreement marked a watershed in global climate diplomacy. It sought to limit global warming well below 2°C and ideally to 1.5°C above pre-industrial levels. A decade later, while emissions continue to rise and devastating consequences are visible, from floods in Uttarakhand and Punjab to glacial melt in Jammu & Kashmir. The Agreement has managed to bend the trajectory of warming from a catastrophic 4°C-5°C to approximately 2°C-3°C by the century’s end. This course correction, though insufficient, underscores that collective climate action works, and that multilateralism remains the only viable path to sustainable futures.

    Why in the News

    The year 2025 marks a decade of the Paris Agreement, a milestone being commemorated at COP30 in Belém, Brazil, where nations are reviewing global progress toward climate neutrality by 2050.

    What makes the Paris Agreement a Turning Point?

    1. Low Carbon Transition Catalyst: The Agreement has been instrumental in shifting the global economy from fossil fuels to renewable and efficient energy systems.
      • Example: Solar, wind, and hydroelectricity now anchor new job creation and green industries worldwide.
    2. End of Fossil Dominance: Ten years ago, fossil fuel use dominated energy production. Today, clean energy is mainstream, driven by technological and policy innovation.
    3. Global Policy Integration: The Paris framework integrates differentiated responsibilities, ensuring fairness for developing countries while enabling ambition from industrialised economies.

    How Has International Collaboration Strengthened Climate Action?

    1. International Solar Alliance (ISA): A joint initiative by India and France, launched at COP21, represents a symbol of cooperative multilateralism in climate governance.
      • Impact: Expanded to 120+ member countries, delivering results through capacity building, training, and renewable energy transitions.
      • Example: The 8th Assembly of the ISA in 2025 reaffirmed its mission of universal solar access and climate resilience.
    2. France-India Climate Partnership: Reinforced at the COP30 session, this partnership embodies shared leadership in sustainable energy and adaptation.

    How Has Climate Finance Evolved in the Last Decade?

    1. Predictable and Inclusive Finance: France and other EU members advocate for innovative, predictable climate finance through instruments like the Green Climate Fund and Loss and Damage Fund.
      • Example: One-third of France’s climate finance supports adaptation and early warning systems (CREWS).
    2. Global Solidarity Vision: At COP30, France emphasized “Global Solidarity Levers” ahead of 2030, urging equity in climate transition financing.
    3. Bridging the North-South Divide: The Paris framework institutionalized common but differentiated responsibilities (CBDR), making financial and technological flows more equitable.

    What Are the Emerging Priorities in the Climate Transition?

    1. Natural Carbon Sinks: Ecosystems like forests, mangroves, and oceans, from the Amazon to the Sundarbans, are recognized as vital allies in carbon sequestration.
      • Policy Implication: Strengthening biodiversity conservation underpins adaptation and mitigation goals.
    2. Empowerment of Non-State Actors: Climate progress now depends on the collective efforts of local governments, businesses, and citizens to translate ambition into implementation.
      • Example: Broad-based agreements post-COP21 enable tangible, community-level results.
    3. Science and Disinformation: The IPCC’s evidence-based advocacy remains central to the fight against climate misinformation, ensuring that policy aligns with scientific truth.

    What Lies Ahead?

    • Irreversibility of the Transition: The Paris transition cannot be reversed, it is now a necessity, not a choice.
    • Challenges Ahead: While adaptation and mitigation face obstacles, technological innovation, renewable investment, and inclusive policy frameworks are defining the next decade.
    • Global Cooperation Imperative: The next phase must focus on accelerating collective ambition, ensuring climate justice, and empowering vulnerable communities.

    Conclusion

    The Paris Agreement, despite its limitations, symbolizes the enduring power of collective resolve. The decade-long experience affirms that sustained multilateral action, grounded in fairness and scientific integrity, can bend the arc of climate destiny. The transition is not just unstoppable, it is the blueprint for humanity’s survival in the Anthropocene.