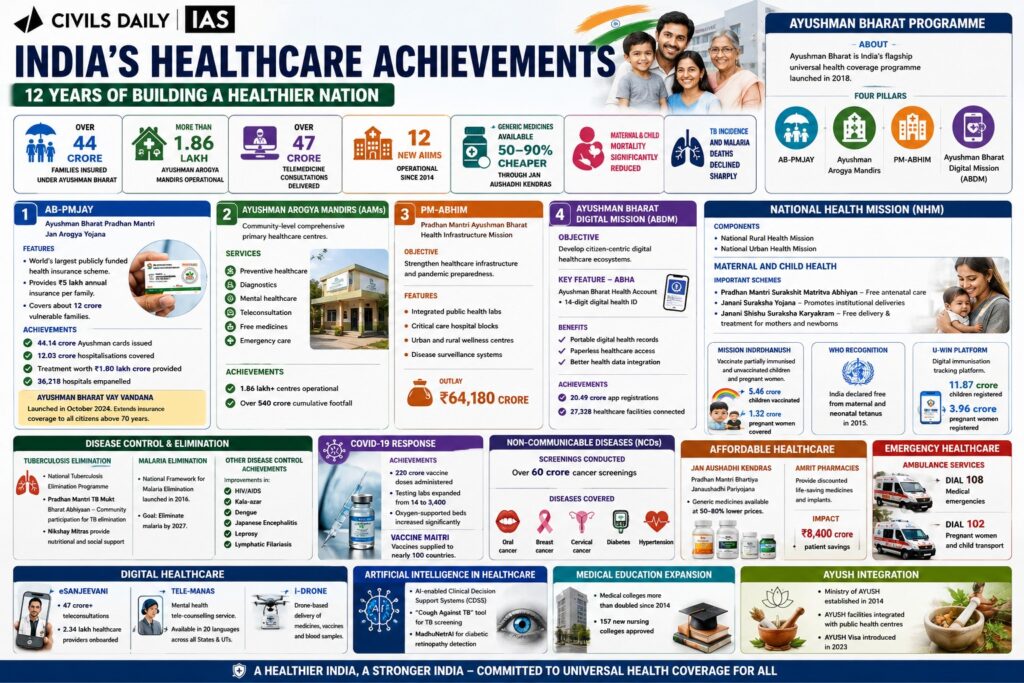
India highlighted major achievements in healthcare over the past 12 years, focusing on universal health coverage, affordable healthcare, digital health, disease control, and healthcare infrastructure expansion.
Key Highlights
Over 44 crore families are insured under Ayushman Bharat.
More than 1.86 lakh Ayushman Arogya Mandirs are operational.
Janani Shishu Suraksha Karyakram: Free delivery and treatment for mothers and newborns.
Mission Indradhanush: Vaccinate partially immunised and unvaccinated children and pregnant women.
5.46 crore children vaccinated.
1.32 crore pregnant women covered.
WHO Recognition: India declared free from maternal and neonatal tetanus in 2015.
U-WIN Platform
Purpose: Digital immunisation tracking platform.
11.87 crore children registered.
3.96 crore pregnant women registered.
Tuberculosis Elimination
Programme: National Tuberculosis Elimination Programme
Pradhan Mantri TB Mukt Bharat Abhiyaan: Community participation for TB elimination.
Support System: Nikshay Mitras provide nutritional and social support.
Malaria Elimination
National Framework for Malaria Elimination launched in 2016.
Goal: Eliminate malaria by 2027.
Other Disease Control Achievements Improvements in: HIV/AIDS, Kala-azar, Dengue, Japanese Encephalitis, Leprosy, and Lymphatic Filariasis.
COVID-19 Response
220 crore vaccine doses administered.
Testing labs expanded: From 14 to 3,400.
Oxygen-supported beds increased significantly.
Vaccine Maitri: Vaccines supplied to nearly 100 countries.
Non-Communicable Diseases (NCDs)
Screenings Conducted Over: 60 crore cancer screenings.
Diseases Covered: Oral cancer, Breast cancer, Cervical cancer, Diabetes, Hypertension.
Affordable Healthcare
Jan Aushadhi Kendras: Pradhan Mantri Bhartiya Janaushadhi Pariyojana
Benefits: Generic medicines available at 50–80% lower prices.
AMRIT Pharmacies
Objective: Provide discounted life-saving medicines and implants.
Impact: ₹8,400 crore patient savings.
Emergency Healthcare
Ambulance Services
Dial 108: Medical emergencies.
Dial 102: Pregnant women and child transport.
Digital Healthcare
eSanjeevani
47 crore+ teleconsultations.
2.34 lakh healthcare providers onboarded.
Tele-MANAS
Purpose: Mental health tele-counselling service.
Coverage: Available in 20 languages across all States and UTs.
i-DRONE: Drone-based delivery of: Medicines, Vaccines, and Blood samples.
AI-enabled Clinical Decision Support Systems (CDSS).
“Cough Against TB” tool for TB screening.
MadhuNetrAI for diabetic retinopathy detection.
Medical Education Expansion
Medical colleges more than doubled since 2014.
157 new nursing colleges approved.
AYUSH Integration: Ministry of AYUSH established in 2014.
AYUSH facilities integrated with public health centres.
AYUSH Visa introduced in 2023.
[2022] With reference to Ayushman Bharat Digital Mission, consider the following statements: 1. Private and public hospitals must adopt it. 2. As it aims to achieve universal health coverage, every citizen of India should be part of it ultimately. 3. It has seamless portability across the country. .Which of the statements given above is/are correct?
PYQ Relevance[UPSC 2022] What is the basic principle behind vaccine development? How do vaccines work? What approaches were adopted by the Indian vaccine manufacturers to produce COVID-19 vaccines?Linkage: The PYQ tests understanding of vaccine science, indigenous vaccine development, and the role of biotechnology in addressing public health challenges. The PreVenTB Trial evaluates indigenous vaccines (VPM1002 and Immuvac) for TB prevention, highlighting India’s growing capabilities in vaccine research and the use of biotechnology to combat infectious diseases.
Mentor’s Comment
India’s fight against tuberculosis (TB) has received a major boost with the publication of the ICMR-led PreVenTB Trial. The trial found that the indigenous vaccine candidates VPM1002 and Immuvac provide protection against both pulmonary TB and the difficult-to-diagnose extrapulmonary TB (EPTB). The findings are significant as they offer new evidence from a large real-world Indian population at a time when India continues to bear one of the world’s highest TB burdens. They also strengthen hopes for achieving TB elimination, even as TB remains the leading infectious disease killer globally.
Why has a “one-size-fits-all” vaccine approach failed in TB control?
Diverse Disease Pathways: TB infection can remain latent for years, progress to subclinical disease, or develop into active pulmonary or extrapulmonary TB.
Biological Complexity: Individuals differ in infection status, age, comorbidities, and immune responses.
Vaccine Limitations: Previous TB vaccine development largely focused on preventing pulmonary TB.
Unrealistic Expectations: Search for a single vaccine capable of preventing all forms of TB has repeatedly disappointed global TB control efforts.
How severe is the TB burden and why does it demand urgent action?
Global Mortality: TB continues to kill more people annually than any other infectious disease.
Burden in LMICs: Incidence in many low- and middle-income countries remains between 200-300 cases per 100,000 population.
Elimination Threshold: TB incidence must decline to 10-20 cases per 100,000 population to approach elimination.
Indian Context: India carries one of the world’s highest TB burdens, requiring sustained public health investments.
Long-Term Challenge: Elimination demands decades of coordinated interventions rather than a single technological solution.
What are the key pillars of a layered TB elimination strategy?
Better Detection
Advanced Diagnostics: Enables identification of subclinical TB before progression to active disease.
Risk-Based Screening: Supports early detection among vulnerable populations.
Public Health Impact: Reduces transmission and disease progression.
Preventive Therapy
Latent TB Treatment: Prevents inactive infection from progressing to active disease.
Targeted Intervention: Particularly relevant for household contacts and high-risk populations.
Vaccination
Critical Tool: Complements diagnostics and preventive therapy.
Population Protection: Reduces progression from infection to disease.
Integrated Strategy: Most effective when combined with nutrition and case management.
What are the major findings of the PreVenTB Trial?
Institution: Conducted by the Indian Council of Medical Research (ICMR).
Scale: Conducted at multiple sites across India.
Participants: More than 12,700 household contacts of TB patients.
Target Group: Individuals aged six years and above, including those with comorbidities and varying infection status.
Vaccines Evaluated: VPM1002 and Immuvac.
Efficacy of VPM1002
Extrapulmonary TB Protection:50.4% efficacy against EPTB.
Pulmonary TB Protection:21.4% efficacy against pulmonary TB overall.
Efficacy of Immuvac
Overall Protection:64.6% efficacy against all forms of TB.
Children Protection: More than 60% efficacy among children aged 6–10 years.
Progression Prevention: More than 60% efficacy against progression to disease among individuals with latent infection.
Significance
First-of-Its-Kind Evidence: Demonstrates efficacy against both pulmonary and extrapulmonary TB.
Real-World Conditions: Large Phase III trial conducted in an Indian population.
Broad Coverage: Includes multiple age groups and disease forms.
Why is extrapulmonary TB an important policy concern?
Extrapulmonary tuberculosis (TB) is an active Mycobacterium tuberculosis infection occurring in organs other than the lungs. It accounts for 15% to 40% of all TB cases and primarily affects lymph nodes, pleura, the spine, and the central nervous system.
Hidden Burden: Harder to diagnose than pulmonary TB.
Missed Cases: Frequently underreported and undetected.
Higher Morbidity: Associated with severe complications and mortality.
Clinical Impact: A reduction of over 50% in EPTB cases would significantly lower patient suffering and healthcare costs.
Novel Evidence: Current findings provide rare vaccine efficacy data against EPTB.
What opportunities do the findings create for children and adolescents?
Strong Signal: Vaccine efficacy exceeded 60% among school-age children and adolescents.
Policy Gap: India currently lacks a structured TB vaccination strategy beyond infancy.
Booster Potential: Findings may support future booster-dose vaccination programmes.
Disease Prevention: Offers protection before transition to adulthood, when disease burden increases.
Why is nutrition emerging as a critical component of TB control?
Low BMI Impact: Reduced vaccine efficacy observed among individuals with low Body Mass Index.
Immune Function: Nutritional status influences vaccine effectiveness and disease resistance.
Integrated Approach: Vaccination must be aligned with nutritional interventions.
Modified BCG Platform: Uses an established vaccine platform.
Manufacturing Ease: Can be produced at scale.
Cost Effectiveness: Suitable for large population programmes.
LMIC Relevance: Practical for resource-constrained settings.
What lessons can India draw from previous vaccine decisions?
TrueNat Example: Indigenous molecular test adopted by the National TB Elimination Programme before WHO qualification.
COVID-19 Response: Covaxin received approval under a “clinical trial mode” during the pandemic to accelerate access while evidence accumulated.
Rotavirus Vaccine: Indigenous vaccines were introduced despite early uncertainty and later demonstrated significant reductions in severe disease and child mortality.
Policy Lesson: Timely deployment based on credible evidence can yield substantial public health gains.
What should India’s future TB strategy look like?
Targeted Vaccination: Deployment of VPM1002 and Immuvac among household contacts and high-risk groups.
School-Based Vaccination: Focus on adolescents and school-going children.
Preventive Therapy: Integration with latent TB treatment programmes.
Nutritional Support: Strengthening nutrition interventions for vulnerable populations.
Case-Based Management: Improved diagnosis and treatment adherence.
Public Health Investment: Sustained funding and surveillance systems.
Combination Approach: Multiple interventions rather than reliance on a single vaccine breakthrough.
Conclusion
The PreVenTB Trial offers a promising pathway for strengthening India’s TB elimination efforts through indigenous vaccines and targeted interventions. Achieving the goal of a TB-Mukt Bharat by 2025 and contributing to SDG 3’s target of ending the TB epidemic by 2030 will require a combination of vaccination, nutrition, early detection, and sustained public health action.
Value Addition
Tuberculosis (TB): Key Facts
Causative Agent:Mycobacterium tuberculosis
Transmission: Airborne droplets
Types: Pulmonary TB and Extrapulmonary TB
Latent TB: Infection without symptoms; can later progress to active disease
SDG Target: End TB epidemic by 2030
National TB Elimination Programme (NTEP)
Formerly Revised National TB Control Programme (RNTCP)
Based on National Strategic Plan for TB Elimination
Uses molecular diagnostics and universal drug susceptibility testing
Provides free diagnosis and treatment
Major Government Initiatives
Ni-kshay Portal: Facilitates digital tracking of TB patients.
Ni-kshay Poshan Yojana: Provides nutritional support to TB patients.
TB Mukt Bharat Abhiyan: Supports community participation in TB elimination.
PM TB Mukt Bharat Abhiyan: Encourages adoption of TB patients through Ni-kshay Mitras.
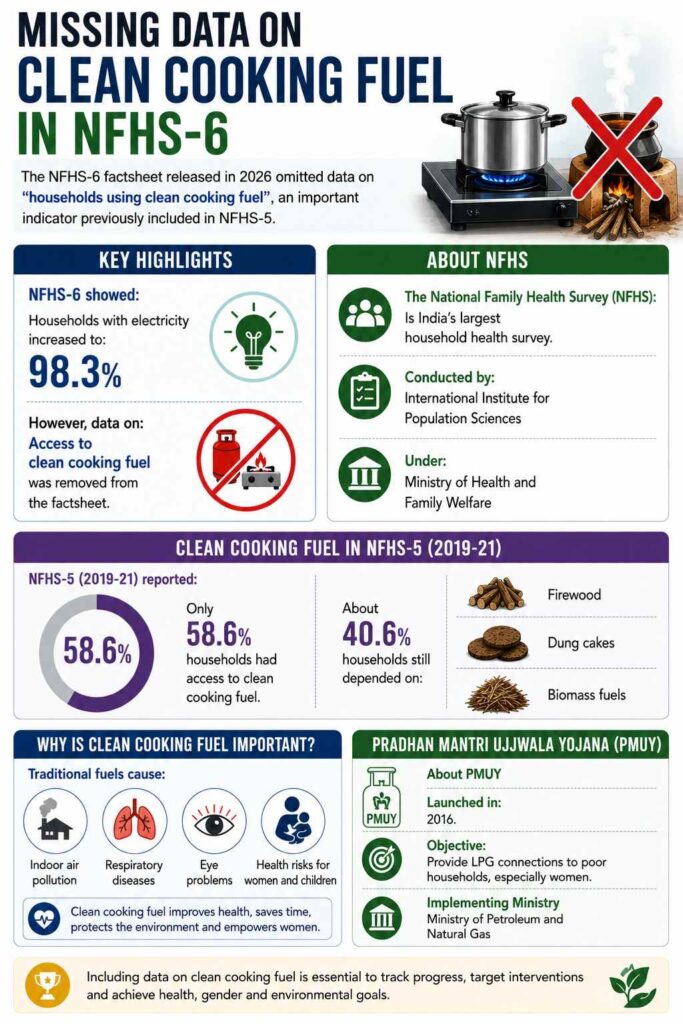
The NFHS-6 factsheet released in 2026 omitted data on “households using clean cooking fuel”, an important indicator previously included in NFHS-5.
Key Highlights
NFHS-6 showed: Households with electricity increased to: 98.3%.
However, data on: Access to clean cooking fuel was removed from the factsheet.
About NFHS
The National Family Health Survey (NFHS):
Is India’s largest household health survey.
Conducted by: International Institute for Population Sciences
Under: Ministry of Health and Family Welfare
Clean Cooking Fuel in NFHS-5
NFHS-5 (2019-21) reported:
Only 58.6% households had access to clean cooking fuel.
About 40.6% households still depended on Firewood, Dung cakes, and Biomass fuels.
[2019] Consider the following: 1. Carbon monoxide 2. Methane 3. Ozone 4. Sulphur dioxide Which of the above are released into the atmosphere due to the burning of crop/biomass residue?
The Ministry of Health and Family Welfare released the National Family Health Survey-6 (NFHS-6), showing major improvements in maternal health, child nutrition, immunisation, and financial protection.
About NFHS
Conducted by the International Institute for Population Sciences (IIPS), Mumbai
Covers population, health, nutrition, and family welfare indicators
NFHS-6 surveyed about 6.79 lakh households across 715 districts
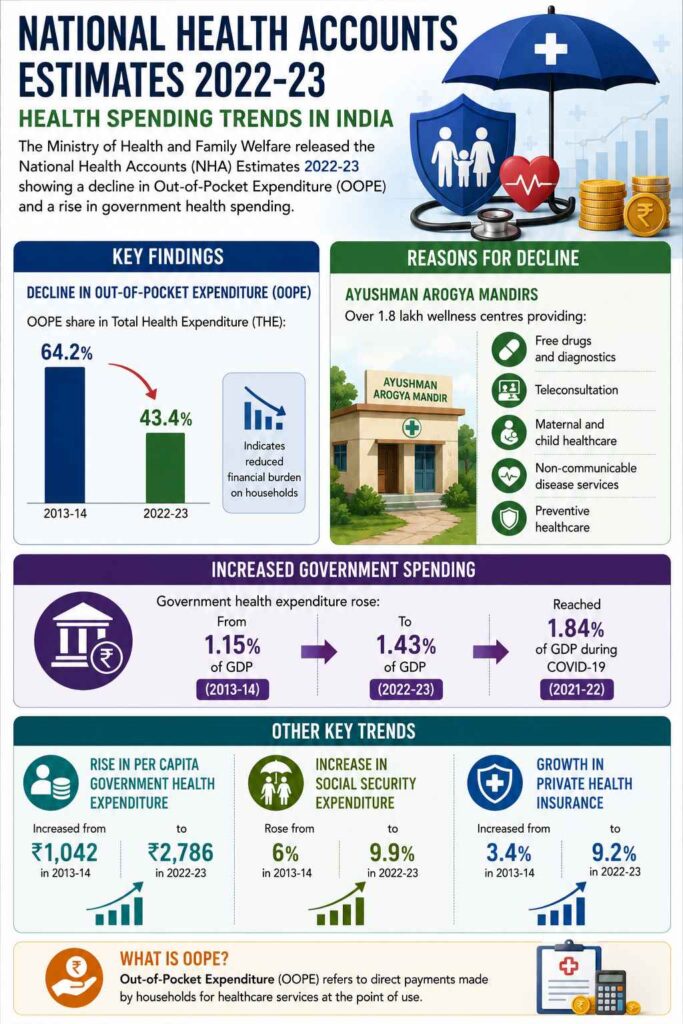
The Ministry of Health and Family Welfare released the National Health Accounts (NHA) Estimates 2022-23 showing a decline in Out-of-Pocket Expenditure (OOPE) and a rise in government health spending.
Key Findings
Decline in Out-of-Pocket Expenditure (OOPE)
OOPE share in Total Health Expenditure (THE):
64.2% in 2013-14
43.4% in 2022-23
Indicates reduced financial burden on households
Reasons for Decline
Ayushman Arogya Mandirs
Over 1.8 lakh wellness centres providing:
Free drugs and diagnostics
Teleconsultation
Maternal and child healthcare
Non-communicable disease services
Preventive healthcare
Increased Government Spending
Government health expenditure rose:
From 1.15% of GDP (2013-14)
To 1.43% of GDP (2022-23)
Reached 1.84% during COVID-19 in 2021-22
Other Key Trends
Rise in Per Capita Government Health Expenditure: Increased from ₹1,042 to ₹2,786 between 2013-14 and 2022-23
Increase in Social Security Expenditure: Rose from 6% to 9.9%
Growth in Private Health Insurance: Increased from 3.4% to 9.2%
What is OOPE?
Out-of-Pocket Expenditure refers to direct payments made by households for healthcare services at the point of use.
Significance
Better healthcare access
Reduced catastrophic health expenditure
Progress toward Universal Health Coverage (UHC)
Strengthening preventive healthcare
Challenges
OOPE still remains high at 43.4%
Pharmaceutical expenses continue to drive household spending
Rural and regional disparities persist
[2023] Consider the following statements: Statement-I: India’s public sector health care system largely focuses on curative care with limited preventive, promotive and rehabilitative care. Statement-II: Under India’s decentralized approach to health care delivery, the States are primarily responsible for organizing health services. Which one of the following is correct in respect of the above statements?
[A] Both Statement-I and Statement-l are correct and Statement-II is the correct explanation for Statement-I.
[B] Both Statement-I and Statement-II are correct and Statement-is not the correct explanation for Statement-l.
[C] Statement-l is correct but Statement-II is incorrect.
[D] Statement-I is incorrect but Statement-Il is correct.
The recent Ebola outbreak in Uganda has revived concerns over whether repeated animal-to-human spillovers could trigger a future pandemic. The concern is significant because Ebola outbreaks are increasingly occurring in urban areas, unlike earlier outbreaks largely confined to remote forests. However, experts argue that despite rising spillover risks, Ebola still lacks the sustained human-to-human transmission needed for a pandemic.
What is Ebola disease?
Ebola disease, or Ebola virus disease (EVD), is a rare but severe and highly fatal illness caused by a group of viruses in the genus Orthoebolavirus. It is characterized by viral hemorrhagic fever, causing widespread inflammation, internal bleeding, and organ failure.
Transmission & Origins
Animal to Human: It is a zoonotic disease originating in wildlife. Fruit bats are considered the natural host, and the virus can spread to humans via contact with infected animals or consumption of “bushmeat”.
Human to Human: Spread requires direct contact with bodily fluids (blood, saliva, sweat, vomit, feces, urine, etc.) of an infected person. It is not an airborne disease.
Contaminated Objects: It can also be contracted by touching surfaces, needles, or clothing contaminated with these fluids.
Are Climate Change and Ecological Disruptions Increasing Ebola Spillover Risk?
Spillover risk refers to the possibility of a disease-causing pathogen (virus, bacteria, etc.) jumping from animals to humans.
Habitat Disruption: Deforestation, mining, and agricultural expansion increase human interaction with fruit bats, considered natural reservoirs of Ebola, raising spillover chances.
Changing Disease Ecology: Altered rainfall and temperature patterns affect wildlife movement and feeding behaviour, increasing contact between animals and humans.
Human Encroachment: Expansion of settlements into forest ecosystems exposes communities to infected wildlife through hunting, farming, and bushmeat consumption.
Urbanisation Effect: Ecological stress combined with migration increases the possibility of outbreaks emerging closer to densely populated areas.
One Health Imperative: Rising spillover risk strengthens the need for an integrated human-animal-environment health approach for surveillance and prevention.
Why Does Spillover Risk Not Automatically Translate into Pandemic Potential?
Pandemic Requirement: Pandemic-capable viruses require efficient and sustained human-to-human transmission, particularly across large populations and geographies.
Transmission Constraint: Ebola spreads primarily through direct contact with infected bodily fluids, unlike airborne respiratory viruses.
Biological Limitation: Not all viruses possess the evolutionary capacity to adapt for sustained human transmission.
Urban Presence is not equal to Pandemic: Mere entry into urban centres does not ensure global spread unless the pathogen sustains continuous chains of transmission.
Comparative Insight: Respiratory viruses such as COVID-19 spread rapidly due to aerosol transmission, unlike Ebola’s contact-based spread.
How Has Ebola’s Epidemiological Pattern Changed Over Time?
Uganda Outbreak: The current outbreak has renewed attention to changing disease geography and regional vulnerability.
Increased Frequency: WHO has highlighted growing concerns over the frequency and scale of Ebola outbreaks.
Cross-Border Risk: Urbanisation and increased mobility raise possibilities of international exportation of isolated cases, though sustained spread remains unlikely.
What Makes Ebola Different from Pandemic Viruses?
Transmission Mode: Ebola spreads through blood, saliva, sweat, tears, vomit, faeces, breast milk, semen, and contaminated surfaces, requiring close contact.
Incubation Period: Symptoms generally emerge after 2-21 days, allowing surveillance and containment opportunities.
Symptom Visibility: Severe symptoms such as fever, headache, sore throat, vomiting, diarrhoea, bleeding, and organ dysfunction enable faster case identification.
Lack of Airborne Spread: Ebola fundamentally differs from influenza or coronaviruses due to the absence of efficient airborne transmission.
Geographic Containment: Major outbreaks have historically remained regionally concentrated, despite occasional international spread.
How Serious Is the Threat of Repeated Ebola Outbreaks Despite Low Pandemic Risk?
The threat of repeated Ebola outbreaks remains severe and critical, because even though the virus is highly unlikely to trigger a global pandemic, its localized impact completely devastates the regions it strikes.
Health System Fragility: Repeated outbreaks expose weaknesses in infrastructure, surveillance, and healthcare delivery systems, particularly in vulnerable countries.
Economic Burden: Outbreaks strain already fragile economies through healthcare expenditure, movement restrictions, and productivity loss.
Public Health Disruption: Healthcare systems divert resources from routine immunisation and essential services.
Humanitarian Impact: Fear, stigma, and mortality affect social cohesion and trust in institutions.
Can Existing Public Health Systems Handle Repeated Ebola Outbreaks?
Infrastructure Constraint: Countries facing outbreaks often suffer from fragile healthcare infrastructure, low laboratory capacity, and shortages of trained personnel.
Example: In the May 2026 Bundibugyo virus outbreak affecting the Democratic Republic of the Congo (DRC) and Uganda, inadequate isolation systems and unsafe medical environments immediately caused a severe cluster of infections among the healthcare workers themselves.
In the 2025 Ebola outbreak in Kasai Province, healthcare teams had to track down and manually monitor 572 unique contacts across massive, hard-to-reach rural zones to successfully stop the transmission chain
Preparedness Gap: Pandemic preparedness systems remain uneven across regions.
The global vaccine emergency stockpile sits at a healthy target of 500,000 doses. But because funding drops between crises, roughly 42,000 precious doses simply expired unused on shelves due to sluggish preventive distribution pipelines
Reliance on WHO & International Coordination: Local governments cannot foot the bill or logistics alone, leaving them dependent on global emergency bodies for basic survival.
In May 2026, the WHO had to declare the central African outbreak a Public Health Emergency of International Concern (PHEIC) and use UNICEF’s ultra-cold chain supply network to rush specialized resources to the area within a 7-day window
Community Engagement: Local trust-building improves compliance with containment measures.
How Effective Are Existing Ebola Vaccines and Treatments?
Vaccine Success: Two approved vaccines, Ervebo and Zabdeno/Mvabea, offer strong protection against the Zaire strain.
Strain Limitation: Vaccines currently have limited cross-strain effectiveness, leaving gaps for other Ebola variants.
Bundibugyo Challenge: Vaccines for the Bundibugyo strain remain under development.
Medical Countermeasures: Expanded therapeutic options improve survival prospects during outbreaks.
Research Need: Viral evolution necessitates continued investment in strain-specific vaccines.
Can Artificial Intelligence Improve Ebola Preparedness and Surveillance?
Data Analytics: AI supports rapid analysis of large epidemiological datasets.
Outbreak Prediction: Machine learning models improve early warning systems and hotspot prediction.
Medical Countermeasures: AI accelerates drug discovery and vaccine development.
Surveillance Support: Real-time analytics improve disease tracking and response coordination.
Resource Allocation: Predictive tools facilitate targeted deployment of healthcare resources.
How Important Is Public Trust in Ebola Outbreak Management?
Behavioural Compliance: Trust improves adherence to isolation, contact tracing, and safe burial practices.
Institutional Legitimacy: Effective communication reduces misinformation and panic.
Community Participation: Local cooperation determines outbreak containment success.
Past Lessons: Distrust during previous outbreaks undermined surveillance and treatment efforts.
Conclusion
Repeated Ebola outbreaks underscore that spillover risk and pandemic risk are not synonymous. While urban outbreaks, ecological disruption, and global mobility elevate concern, Ebola’s limited transmission biology constrains sustained worldwide spread. Rising zoonotic threats necessitate stronger surveillance, resilient health infrastructure, vaccine innovation, and trust-based governance to prevent local outbreaks from escalating into larger crises.
PYQ RelevanceIs Spillover Risk the Same as Pandemic Risk?Spillover Risk: Refers to the likelihood of a pathogen jumping from animals to humans, causing isolated infections or local outbreaks. Pandemic Risk: Refers to the ability of a disease to achieve efficient and sustained human-to-human transmission across countries and continents. Ebola Example: Ebola has high spillover risk due to repeated zoonotic transmission from wildlife, but low pandemic risk because it spreads mainly through close bodily contact. COVID-19 Contrast: COVID-19 transformed from a spillover event into a pandemic because of rapid respiratory transmission among humans. Policy Significance: Distinguishing the two helps governments avoid panic while strengthening surveillance, containment, and preparedness systems. What Determines Pandemic Potential? Sustained Transmission: Efficient human-to-human spread.Reproduction Rate (R0): Ability to generate secondary infections. Mutation Capacity: Viral adaptation for new transmission pathways.Global Connectivity: International mobility patterns.Global Examples of Zoonotic Spillovers Nipah Virus (India/Bangladesh): Bat-to-human transmission with limited spread.COVID-19: Example of spillover evolving into pandemic due to respiratory transmission. Avian Influenza (H5N1): High mortality but limited human transmission.Governance Lessons for India Integrated Surveillance: Strengthens disease detection through the Integrated Disease Surveillance Programme (IDSP). One Health Approach: Enhances coordination between human, animal, and environmental health systems. Preparedness Systems: Improves laboratory networks, genomic surveillance, and emergency response capacity.
PYQ Relevance
[UPSC 2020] COVID-19 pandemic has caused unprecedented devastation worldwide. However, technological advancements are being availed readily to win over the crisis. Give an account of how technology was sought to aid management of the pandemic
Linkage: The Ebola outbreak re-opens debate about pandemic preparedness, disease surveillance, vaccines, and outbreak management, similar to the COVID-19 experience. The article also helps in understanding the distinction between spillover risk and pandemic risk in zoonotic diseases like Ebola.
India’s heat crisis is increasingly becoming a night-time public health emergency, as evidence shows that night temperatures are rising faster than daytime temperatures. This reduces the body’s ability to recover from daytime heat. The concern is significant because mortality sharply increases when night temperatures remain above 28-30°C, while existing heat action plans remain largely focused on daytime heatwaves.
Why Are Rising Night-Time Temperatures Emerging as a Major Public Health Threat?
Physiological Recovery: Cooler nights allow the human body to recover from daytime heat. Persistently warm nights prevent recovery, resulting in prolonged heat exposure and cumulative stress.
Sustained Heat Burden: Continuous exposure transforms heat stress from a daytime phenomenon into a prolonged condition, increasing health risks without adequate relief.
Vulnerable Populations: Low-income groups living in densely packed houses without natural ventilation or cooling systems face disproportionate exposure.
Public Health Blind Spot: Heat action plans largely focus on daytime heatwaves, while night-time thermal stress remains under-recognised.
Extreme Night Heat: Climate Trends data across 200 Indian cities (1986-2018) found that in cities such as Delhi, minimum night temperatures frequently exceeded 32°C and sometimes crossed 35°C. This indicates that nights are increasingly failing to provide thermal relief.
How Are Night-Time Temperatures Rising Faster Than Daytime Temperatures in India?
Urban Heat Retention: Concrete, asphalt, and built surfaces absorb heat during the day and slowly release it at night, preventing cooling.
Urban Heat Island Effect: Dense urban settlements trap heat and restrict airflow, keeping cities warmer after sunset.
Anthropogenic Heat Emissions: Air conditioners, vehicles, industries, and energy use release residual heat into urban environments.
Climate Change: Rising baseline temperatures are increasing both daytime and night-time heat, with warmer nights showing faster escalation in several regions.
What Trends Indicate the Rise of Night-Time Temperatures in India?
Long-Term Trend: A Climate Trends analysis using IMD data found that night-time temperatures increased faster than daytime temperatures between 1986 and 2015.
Temperature Rise: Mean annual temperatures increased by ~0.63°C, while coldest night temperatures increased by ~0.4°C, indicating warming even during recovery periods.
Future Projection: By the 2070s, night temperatures during the warmest day may rise by 4.7°C, alongside a 5.5°C rise in daytime maximum temperatures.
Regional Variation: Metropolitan cities are projected to witness stronger warming due to urbanisation and dense built-up surfaces.
Why Does Urbanisation Intensify Night-Time Heat Exposure?
Urban Heat Island Effect: Urban surfaces such as concrete, roads, bricks, and metal infrastructure absorb heat during the day and radiate it at night, preventing cooling.
Loss of Green Spaces: Reduced vegetation lowers natural cooling and evapotranspiration, increasing retained heat.
Water Body Degradation: Shrinking lakes and wetlands reduce local cooling capacity.
Built Environment: Dense construction blocks airflow and traps heat in residential clusters.
Air Conditioner Heat Emissions: Cooling devices release waste heat outdoors, increasing ambient night-time temperatures in urban neighbourhoods.
What Evidence Links Night-Time Heat with Mortality Risks?
Ahmedabad Case Study: The Indian Institute of Public Health, Gandhinagar analysed mortality data in Ahmedabad and found a strong correlation between night-time heat and all-cause mortality.
Critical Threshold: Mortality rises sharply when maximum night-time temperature exceeds 28°C.
Mortality Spike: If night-time temperature remains below 28°C, all-cause mortality averages around 145 deaths/day. When temperatures rise above 30°C, mortality increases to approximately 265 deaths/day.
Significance: Findings indicate that night temperatures may be as important as daytime heat in determining heat-related deaths.
Why Are Existing Heat Action Plans Inadequate in Addressing Night-Time Heat?
Daytime Bias: Most heat action plans focus on extreme daytime temperature warnings, overlooking night-time risks.
Intermittent Heatwave Focus: Current interventions primarily target short-duration heatwaves rather than persistent elevated temperatures throughout summer.
Housing Deficit: Existing policies inadequately address thermal discomfort in informal settlements and overcrowded housing.
Inclusive Heat Governance: Heat Action Plans must incorporate night-time temperature indicators and vulnerable settlements.
Conclusion
India’s heat crisis can no longer be assessed through daytime temperatures alone. Recognising night-time heat as a major climate-health risk is essential for building effective Heat Action Plans, resilient cities, and equitable protection for vulnerable populations.
PYQ Relevance
[UPSC 2017] “Climate change” is a global problem. How India will be affected by climate change? How Himalayan and coastal states of India will be affected by climate change?
Linkage: The PYQ examines impacts of climate change on ecosystems, economy, disasters, and human systems including health. The article provides a specific case study of climate change impact in India, rising night-time heat causing increased mortality and urban heat stress.
PYQ Relevance[UPSC 2015] “Besides being a moral imperative of a Welfare State, primary health structure is a necessary precondition for sustainable development.” Analyse.Linkage: This PYQ is important for understanding GS-2 health governance and social sector issues. The PYQ links with the theme of preventive healthcare and helps analyse the transition from a curative healthcare model to a preventive and wellness-oriented approach in India.
Mentor’s Comment
India’s healthcare discourse is increasingly shifting toward preventive healthcare. This is driven by a rapid rise in non-communicable diseases (NCDs), mounting healthcare costs, and evidence from large-scale health assessments such as the Apollo Hospitals Health of the Nation Report 2026.
Why is India’s healthcare success insufficient without preventive health culture?
Curative Bias: India has built strong institutions for treatment, trained clinicians, and advanced medical infrastructure. However, the system responds more effectively to illness than preserving wellness.
Health Perception Gap: Society often treats health as something to recover after illness rather than protect daily through preventive practices.
Preventive Deficit: National health outcomes remain constrained because healthcare systems predominantly intervene after disease onset. This reduces opportunities for reversal.
Civilisational Shift: Preventive healthcare requires moving from episodic treatment to continuous self-care, involving individuals, families, and communities.
How serious is India’s burden of chronic diseases?
NCD Burden:Non-communicable diseases (NCDs) such as heart attacks, strokes, cancer, and diabetes have emerged as the leading causes of death in India, surpassing infectious diseases.
Scale of Crisis:270 million Indians live with chronic disease, while many remain unaware of their condition until the disease significantly progresses.
Silent Disease Burden: Many chronic conditions remain asymptomatic in early stages, leading to delayed diagnosis and higher treatment costs.
Economic Consequences: Preventable illness reduces workforce productivity and diminishes the contribution of individuals during their economically productive years.
Why is the age group of 30-40 years a critical intervention window?
Turning Point: The Apollo Hospitals Health of the Nation Report 2026 identifies the decade between 30 and 40 years as a critical phase where metabolic and cardiovascular risks begin to emerge.
High Vulnerability: Individuals in this age group are typically engaged in career-building and family responsibilities. This makes health deterioration economically costly.
Disease Progression: By the age of 40, a significant proportion of people cease to be disease-free.
Awareness Deficit: Most individuals avoid preventive healthcare because symptoms are absent, despite underlying risk accumulation.
Missed Opportunity: Delayed action often closes the possibility of early reversal of lifestyle diseases.
Can preventive healthcare reverse India’s disease burden?
Early Detection: Timely diagnosis through screening facilitates identification of diseases before complications emerge.
Lifestyle Correction: Behavioural modifications involving diet, physical activity, stress management, sleep, and substance reduction can delay or reverse many chronic conditions.
Sustained Monitoring: Periodic check-ups support risk identification and disease management before advanced progression.
Biological Resilience: The human body demonstrates significant recovery potential when intervention occurs at early stages.
Limited Opportunity Window: The editorial stresses that the “window of prevention” does not remain permanently open, necessitating early action.
Why must preventive healthcare become a national philosophy rather than a medical programme?
Self-Stewardship: Prevention requires citizens to treat health as a personal responsibility rather than solely a medical issue.
Behavioural Transformation: Sustainable outcomes require routine practices rather than one-time interventions.
Family-Level Impact: Health choices affect not only individuals but also dependents and future generations.
National Productivity: Economic growth depends on a healthy and productive population.
Human Capital Formation: Preventive health strengthens longevity, vitality, workforce participation, and social well-being.
What structural barriers prevent India from adopting preventive healthcare?
Treatment-Oriented System: Healthcare financing prioritises hospitals and treatment over wellness and prevention.
Low Health Awareness: Citizens often seek care only after symptom manifestation.
Limited Screening Culture: Routine annual health assessments remain uncommon.
Out-of-Pocket Expenditure: High medical costs discourage early diagnosis.
How can India build a preventive healthcare ecosystem?
Routine Screening: Institutionalise annual health assessments, particularly for adults above 30 years.
Primary Healthcare Strengthening: Expand screening and wellness through Ayushman Bharat Health and Wellness Centres (HWCs).
Health Literacy: Promote awareness regarding lifestyle diseases, nutrition, exercise, and mental health.
Digital Health Infrastructure: Use digital records and AI-enabled diagnostics for early risk detection.
Workplace Wellness: Encourage preventive screening in workplaces and institutions.
School-Based Prevention: Embed nutrition, exercise, and health awareness in school education.
Community Participation: Strengthen local wellness campaigns through panchayats and urban local bodies.
Conclusion
India’s healthcare journey must move beyond excellence in curing disease toward excellence in preventing it. A healthy nation depends not only on hospitals and doctors but also on everyday choices shaped by awareness, early intervention, and institutional support. Preventive healthcare is not merely a medical strategy; it is an economic necessity, a social responsibility, and a national developmental imperative.
The President of India conferred the National Florence Nightingale Awards 2026 on outstanding nursing professionals.
About the Award
Instituted in 1973.
Established by the Ministry of Health and Family Welfare, Government of India.
Recognises exceptional nursing services and contributions to public health.
Who Receives the Award?
The award is presented to:
Registered Nurses
Midwives
Auxiliary Nurse Midwives (ANMs)
Lady Health Visitors (LHVs)
Serving in:
Central Government
State Governments
Union Territories
Voluntary organisations
Award Components
Each award includes:
Certificate of Merit
Medal
Cash prize of ₹1 lakh
Role of Nurses in Healthcare
Nurses play a vital role in:
Primary healthcare
Immunisation
Community outreach
Emergency care
About Florence Nightingale
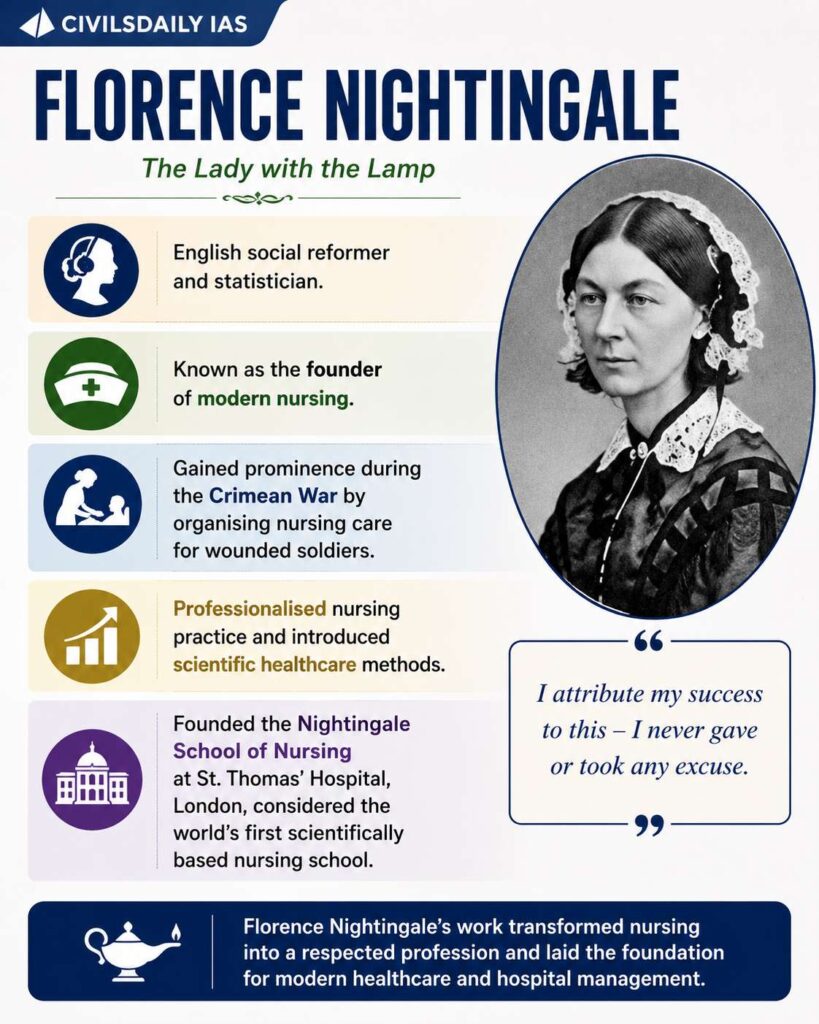
English social reformer and statistician.
Known as the founder of modern nursing.
Gained prominence during the Crimean War by organising nursing care for wounded soldiers.
Professionalised nursing practice and introduced scientific healthcare methods.
Founded the Nightingale School of Nursing at St. Thomas’ Hospital, London, considered the world’s first scientifically based nursing school.
[2024] With reference to the ‘Pradhan Manti Surakshit Matritva Abhiyan’, consider the following statements: 1. This scheme guarantees a minimum package of antenatal care services to women in their second and third trimesters of pregnancy and six months post-delivery health care service in any government health facility. 2. Under this scheme, private sector health care providers of certain specialties can volunteer to provide service at nearby government health facilities. Which of the statements given above is/are correct ? [A] 1 only [B] 2 only [C] Both 1 and 2 [D] Neither 1 nor 2
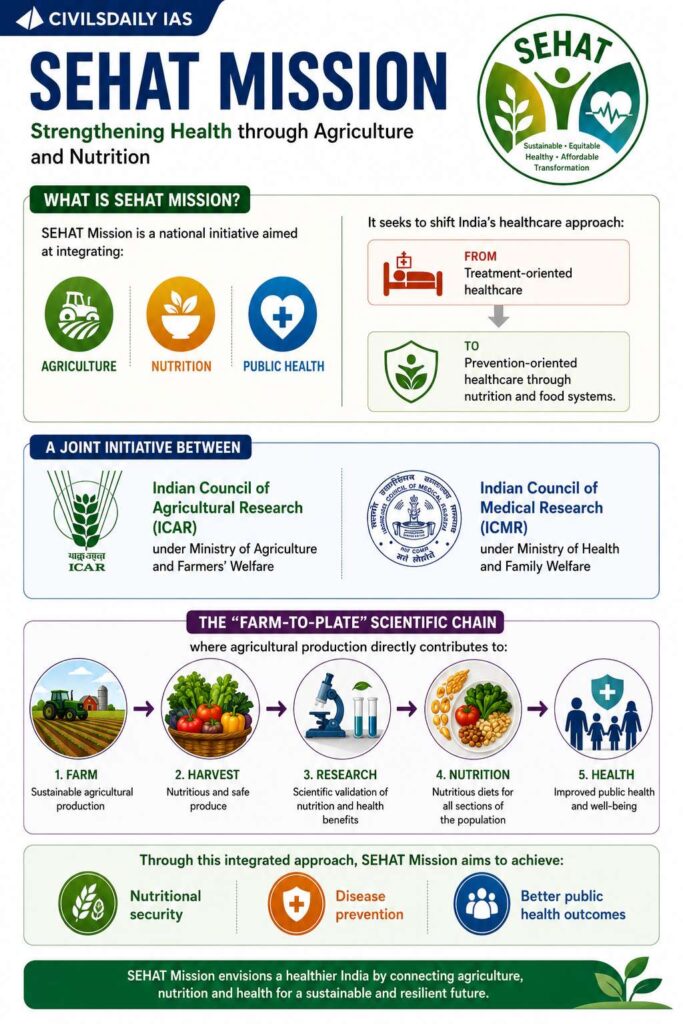
The Union Government launched the SEHAT Mission in New Delhi, marking the first major institutional convergence between India’s agriculture and health sectors to address malnutrition and non-communicable diseases (NCDs).
What is SEHAT Mission?
SEHAT Mission is a national initiative aimed at integrating: Agriculture, Nutrition, and Public Health
It seeks to shift India’s healthcare approach:
From treatment-oriented healthcare
To prevention-oriented healthcare through nutrition and food systems.
The mission is a joint initiative between:
Indian Council of Agricultural Research (ICAR) underMinistry of Agriculture and Farmers’ Welfare
Indian Council of Medical Research (ICMR) under Ministry of Health and Family Welfare
“Farm-to-Plate” scientific chain
where agricultural production directly contributes to:
Nutritional security
Disease prevention
Better public health outcomes
[2023] Consider the following statements: Statement-I: India’s public sector health care system largely focuses on curative care with limited preventive, promotive and rehabilitative care. Statement-II: Under India’s decentralized approach to health care delivery, the States are primarily responsible for organizing health services. Which one of the following is correct in respect of the above statements? [A] Both Statement-I and Statement-l are correct and Statement-II is the correct explanation for Statement-I. [B] Both Statement-I and Statement-II are correct and Statement-is not the correct explanation for Statement-l. [C] Statement-l is correct but Statement-II is incorrect. [D] Statement-I is incorrect but Statement-Il is correct.