💥Join UPSC 2027,2028 Mentorship (July Batch) + XFactor Notes & Microthemes PDF

Distribution: yearly

  • Way out lies within

    Context

    Domestic demand must play a greater role in India’s growth story.

    Recovery in the Indian economy

    • Sub-5 per cent growth rate: India’s fourth-quarter GDP growth (the calendar year 2019) printed another sub-5 per cent growth rate.
    • Favourable base effect: It would have been lower had it not been for the large downward revisions to previous years’ GDP that statistically boosted the last quarter’s growth rate because of favourable base effects.
    • The decline in GDP stabilised: Policymakers and the market heaved a sigh of relief that the relentless decline over the last three years at least seems to have stabilised around 4-5 per cent.
    • Why some countries prefer sequential growth rate: Because year-over growth rates are so strongly affected by what happened a year ago, most economies (including China) instead publish and conduct policy discussions based on sequential quarterly growth.
      • Better sense of momentum: Sequential growth rates provide a much better sense of the momentum and turning points in activity, which are critical to deciding whether, how much, and when the economy needs policy support.
    • The magnitude of recovery: The growth momentum rose, albeit modestly, from 3.8 per cent in the third quarter of 2019 to 4.1 per cent.
      • Non-farm and non-governmental GDP recovery: More importantly, non-farm and non-government GDP (the closest approximation to non-farm private-sector GDP) bounced much more sharply from 1.6 per cent (and no this is not a misprint) to 4.4 per cent in the fourth quarter.

    What is the dominant narrative of the slide in growth?

    • The deceleration in sequential terms: With the revised data, we now know that annual growth over the last four years has slowed from 8.3 per cent to 7 per cent to 6.1 per cent to 4-5 per cent.
      • The decline in non-farm private GDP: In sequential terms, the deceleration was far more dramatic, especially in non-farm private GDP, which after hitting a run rate of 13 per cent in the first quarter of 2016 fell to 1.6 per cent by the third quarter of 2019.
      • The dominant narrative of the cause of slide: The dominant narrative is that India’s woes are just an unfortunate and unintended consequence of demonetisation, the shift to a national GST, and the credit squeeze caused by the bad debt in banks and non-banks.
      • The dominant narrative on recovery: With a bit more fiscal support, some monetary easing, and extended regulatory forbearance to help banks work out their bad debts, these headwinds will fade and India will likely be back to its winning ways.

    Why real cause of the slowdown lays somewhere else?

    Following factors suggest that answer lies somewhere else.

    • Disruptive but not the drivers of the slowdown: While it is undeniable that facts stated in the dominant narrative had been disruptive, they couldn’t be the drivers of the decline.
      • Slide in growth started even before demonetisation: India’s growth had been sliding since the second quarter of 2016; nearly 6 months before demonetisation and a year before the GST was introduced.
      • By the third quarter of 2016, non-farm private sector growth had already slid to 3.5 per cent.
      • Bad debt problem predates slowdown: Although bad debt hit the headlines in 2016, the overleverage had already begun to tighten bank lending since 2014.
    • Fall in corporate investment- inexplicable cause: More inexplicable is the argument that falling corporate investment is the main culprit for the slowdown.
      • It is true that corporate investment is no longer running at the heady 17 per cent of GDP of the pre-global financial crisis (GFC) days but at a much more sombre 11-12 per cent.
      • However, this outsized adjustment had already taken place by 2010 and since then, corporate investment has flatlined at current levels.

    The answer lies in globalisation

    It is obvious once one eschews India’s exceptionalism and accepts that it is just another emerging market economy that grew on the coattails of globalisation with the minimal reforms. Globalisation has largely determined India’s fate.

    • Growth in corporate investment and exports: Contrary to a widely held misperception, India is and has been for a long time far more open to the global economy than believed.
      • Rise in corporate investment from 5 to 17%: The limited liberalisation of 1991-92, coupled with the corporate restructuring in the late 1990s, spurred corporate investment to rise from 5-6 per cent of GDP in the early 2000s to 17 per cent of GDP by 2008.
      • Increase in exports: Almost all of this expansion in investment was geared to produce for exports, which grew at an astonishing pace of 18 per cent per year-over-year in this period as global trade expanded at breakneck speed with the entry of China into the WTO in 2001.
      • 12% of GDP to 26% of GDP: Exports as a share of GDP more than doubled from 12 per cent in the early 2000s to over 26 per cent by 2008.
      • Slow growth in private consumption: In contrast, private domestic consumption, which is considered to be India’s great strength, grew only at 6 per cent annually, less than the growth rate of the economy, such that its share in GDP fell from 63 per cent to 56 per cent.
      • The engine of the Indian economy- Export: Since 2012, global trade has floundered and with that so has India’s economy.
      • Indeed, the entire rise and fall of investment, including the quarter-to-quarter twists and turns in it, can be almost fully explained by changes in exports.
      • The Indian economy has long been flying on one engine – exports — and that is now spluttering.

    What are the prospects of taking the economy back to its high growth path

    • Unlikely: So will the nascent recovery strengthen and take the economy back to its high growth path? Unlikely on current policies.
    • COVID-19 factor: In the near term, as in now widely feared, the COVID-19 outbreak could turn into a pandemic, sharply reducing global demand and trade.
      • With that, even expectations of a modest 2019-20 recovery to 5.25 per cent growth are under threat.
    • Backlash against globalisation: Over the longer term, it is unlikely that global trade will return to its pre-Global financial crisis growth rates not only because supply chains have stopped expanding in the absence of any material technology breakthrough, but there is also a growing political backlash against globalisation in the developed market that has led to increased trade barriers.

    Way forward

    • Search for new sources of growth: India too, like other emerging market economies, needs to face up to the reality that it can no longer depend on global trade to be the only growth driver. Instead, it needs to search and find new sources of growth and that starts with recognising and accepting reality.
    • Let domestic demand play a greater role in the economy: Policymakers need to stop thinking about India as a perennially supply-constrained economy focusing almost all policies and reforms to easing these constraints. Instead, it is time to let domestic demand play a greater role in India’s growth story.
    • Policy changes: The above factors mean that India Inc. needs to shift from producing what foreigners want to produce what residents can afford, it also means that policymakers have to reverse policies that have so far forced households to keep increasing savings (for retirement income, children’s education, healthcare, and housing) through a web of financial repression, regulatory distortions, and public spending choices.
      • It means redesigning India’s infrastructure to look more inward and less outward.
      • Reduce out of pocket expenses: Increasing public provisioning of healthcare and education, reforming insurance regulations to reduce out-of-pocket expenses and eliminating financial repression to raise returns on retirement savings.
      • Merely tinkering with macroeconomic policies will not be enough.


  • The growth challenge

    Context

    The focus in the near future should to increase investments and facilitate credit for funding these productive assets so that India’s potential output growth can steadily rise.

    Growth prospects of India

    • The NSO forecast at 5%: The latest data from the National Statistical Office (NSO) retained India’s economic growth forecast at 5 per cent for the current financial year.
      • Growth has dropped from 6.1 per cent in the previous year.
    • Fall in nominal GDP: More strikingly, nominal GDP growth has decelerated from an average of 11 per cent during 2016-17 to 2018-19 to 7.5 per cent this year.
      • Lower inflation added to the volume slowdown.
      • The value of India’s GDP for FY20 is estimated at around $2.9 trillion.

    Input and output side growth prospects

    • GDP is estimated from both output and demand lenses, using specific economic indicators as proxies for activity in specific sectors.
    • Output side: From the output side, sector-wise estimates were as following-
      • Agriculture sector growth was revised up to 3.7 per cent (up from the 2.8 per cent previously).
      • Agricultural production is expected to improve based on the third advance estimates of the rabi season crops, as well as higher horticulture and allied sector output (livestock, forestry and fishing), which now is significantly larger than conventional food crops.
      • Industrial activity was lowered to 1.5 per cent (from 2.3 per cent earlier).
      • The key concern regarding the continuing slowdown is the increasing weakness in the industrial sector (particularly of manufacturing, whose growth has progressively fallen from 13.1 per cent in FY16 to 5.7 per cent in FY19, and plummeting to 0.9 per cent in FY20).
      • Services output remained largely unchanged at 6.5 per cent.
    • Demand-side: From a demand perspective, the obverse side to the manufacturing slowdown is the even sharper drop in fixed asset investment growth — down sharply from an average 8.5 per cent during FY17 and FY19 to -0.6 per cent in FY20.
      • The causes for this contraction needs to be understood in detail, and we will return to this.

    Private consumption- a significant driver of growth

    • Private consumption at 60% of GDP: The other significant driver of growth in India has been private consumption. For perspective, the share of private consumption had averaged 59-60 per cent during FY16-FY20.
    • Government consumption 10% of GDP: Reflecting the higher spending over the last couple of years, the share of government consumption in GDP has risen from an average of 10.5 per cent of GDP over FY12-17 to almost 12 per cent in FY20, resulting in the share of total consumption above 70 per cent.

    Drop in the share of nominal investment

    • Drop from 39 % to 30 % of GDP: The really remarkable trend, though, as noted above, is the share of nominal investment in GDP progressively dropping from 39 per cent in FY12 to 30 per cent in FY20.
    • Is it a good sign? Part of this is actually good, reflecting higher Capex efficiency.
      • Slowing household consumption: One narrative underlying the contraction in fresh Capex in FY20 was slowing household consumption growth, which, in nominal terms, fell from an average 11.6 per cent during FY16-19 to an estimated 9.1 per cent in FY20.
      • Disproportionate contribution to lower growth: Though the deceleration prima facie does not seem significant enough to result in a broader economic slowdown of the current magnitude, the high share of household consumption has contributed disproportionately to lower growth.
      • Fall in capacity utilisation: A direct fallout of this is that seasonally adjusted capacity utilisation (based on RBI surveys) had shrunk from 73.4 per cent in the first quarter of FY20 to 70.3 per cent in the second quarter, and this is unlikely to have improved materially in the second half of the year.
      • This is one of the reasons for the low levels of fresh investment.

    Reduced flow of credit to the commercial sector

    • Impediment to growth revival: The other cause of the low Capex, more from the supply side, is a much-reduced flow of credit to the commercial sector, and this remains the proximate impediment for growth revival, with signs of risk aversion in lending still strong despite the recent measures by RBI to incentivise credit to productive sectors.
      • Funds from selected sources, over April-January FY20, was only about Rs 9 lakh crore as against Rs 15 lakh crore in the corresponding 10 months of FY19.
    • Bank credit lowest in three months: Growth in bank credit (which is still the largest source of financing) till mid-February 2020 was down to 6.3 per cent — the lowest in three years.
      • Even this is almost wholly driven by retail credit; incremental credit to industry and services over this period was negative.

    Investor confidence and coronavirus factor

    • A bright feature of the economic environment: One bright feature in this economic environment is strong foreign investor confidence in India, reflected in both FPI equity and FDI flows.
      • Many borrowers have used offshore sources to refinance or pay down domestic bank loans and debt.
      • A global risk-off environment might restrict even this channel in the near future.
    • Robust corporate bond issuances: Domestic corporate bond issuances have also remained robust, although the dominant set of borrowers still remain public sector agencies and financial institutions.
    • Coronavirus factor likely to moderate the gains: Monthly economic indicators suggest that the growth deceleration has likely bottomed out in the third quarter.
      • The bet has been on reducing inventories and the consequent production ramp-up to replenish stocks. However, the evidence on this is mixed.
      • The coronavirus effects, both concurrent and lagged, will also moderate some of the emerging positive effects of counter-cyclical policy measures of the past six months.
      • If the outbreak does not abate over the next month or so, the complex supply chains of intermediates sourced from China will run dry and add to the already weak system demand.
    • Growth prospects in the next few weeks: Surveys indicate that both business and consumer confidence, which while improving, remain muted. A growth revival, hence, is likely to be only very modest over the next few quarters.

    Conclusion

    A $5 trillion economy by 2025 is still a worthwhile target and aspirational; coordinated strategies, policies, execution and institutional mechanisms will be needed to move up to a sustained 8 per cent plus growth consistent with achieving the target. The focus in the near future should to increase investments and facilitate credit for funding these productive assets so that India’s potential output growth can steadily rise.


  • [pib] Biomethanation Process


    In an all India coordinated project, efforts are on to produce bio-gas for kitchen use and quality manure for fields using bio-methanation of rice straw by anaerobic digestion method. Six domestic level paddy straw-based bio-gas plants have been installed in Punjab for field trials and further study is in progress.

    What is Biomethanation?

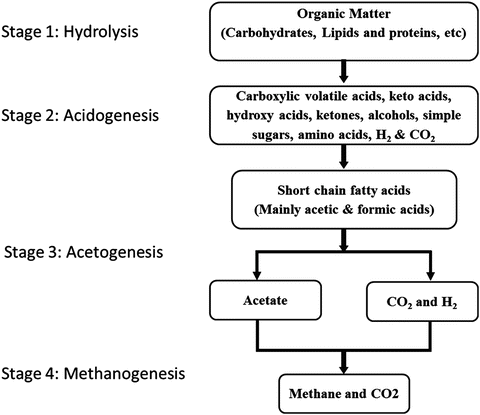
    • It is a process by which organic material is microbiologically converted under anaerobic conditions to biogas.
    • Three main physiological groups of microorganisms are involved: fermenting bacteria, organic acid oxidizing bacteria, and methanogenic archaea.
    • Biomethanation has strong potential for the production of energy from organic residues and wastes. It will help to reduce the use of fossil fuels and thus reduce CO(2) emission.

    How it works?

    • Microorganisms degrade organic matter via cascades of biochemical conversions to methane and carbon dioxide.
    • Syntrophic relationships between hydrogen producers (acetogens) and hydrogen scavengers (homoacetogens, hydrogenotrophic methanogens, etc.) are critical to the process.
    • A wide variety of process applications for biomethanation of wastewaters, slurries, and solid waste have been developed.
    • They utilize different reactor types and process conditions (retention times, loading rates, temperatures, etc.) in order to maximize the energy output from the waste and also to decrease retention time and enhance process stability.
  • [pib] Amendment to the Export Policy of APIs and formulations made from these APIs

    The Government has made amendments in the export policy and restricted export of specified APIs (Active Pharmaceutical Ingredients) and formulations made from these APIs.

    Active Pharmaceutical Ingredients (APIs)

    • All drugs are made up of two core components: the API, which is the central ingredient, and the excipients, the substances other than the drug that helps deliver the medication to your system.
    • The API is the part of any drug that produces its effects.
    • Excipients are chemically inactive substances, such as lactose or mineral oil.
    • The quality of APIs has a significant effect on the efficacy and safety of medications.

    The notification covers the following APIs and formulations made from these APIs:

    • Paracetamol
    • Tinidazole
    • Metronidazole
    • Acyclovir
    • Vitamin B1
    • Vitamin B6
    • Vitamin B12
    • Progesterone
    • Chloramphenicol
    • Erythromycin Salts
    • Neomycin
    • Clindamycin Salts
    • Ornidazole
  • Species in news: Swamp Wallaby


    Researchers reported that the swamp wallaby, a marsupial related to the kangaroo, is pregnant throughout its adult life. It typically conceives a new embryo days before delivering the newborn from its previous pregnancy.

    Swamp wallaby

    IUCN Status: Least Concerned

    • The swamp wallaby is a small macropod marsupial of eastern Australia. It is likely the only mammal pregnant and lactating all lifelong.
    • Female wallabies and kangaroos have two uteri and two separate ovaries.
    • At the end of a pregnancy in one uterus, a new embryo develops in the other uterus.
    • Kangaroos and wallabies regularly have an embryo in the uterus, a young joey in the pouch, and a third semi-dependent young at foot, still drinking its mother’s milk.

    How it is different from Kangaroo?

    • In kangaroos, the new embryo is conceived a day or two after the previous birth.
    • In the swamp wallaby (Wallabia bicolor), the new conception happens one or two days before the previous joey is delivered.

    What happens after?

    • As soon as the mature foetus is born and settles in the pouch, the swamp wallaby arrests the development of the new embryo.
    • This is called embryonic diapause, which happens in many animals to pause reproduction until the conditions are right — season, climate, food availability.
    • For wallabies, this is also to ensure that the new one is born only when the pouch is free again.
    • If this did not happen, the swamp wallaby would be birthing new young every 30 days — it has a short gestation period — and its pouch could not support that.
  • Department-related Standing Committees (DRSCs)

    Fewer sittings of Parliament are compensated by the working of department-related standing committees (DRSCs) praised Rajya Sabha Chairman.

    What are Standing Committees?

    • Standing Committee is a committee consisting of Members of Parliament.
    • It is a permanent and regular committee which is constituted from time to time according to the provisions of an Act of Parliament or Rules of Procedure and Conduct of Business.
    • The work done by the Indian Parliament is not only voluminous but also of a complex nature, hence a good deal of its work is carried out in these Parliamentary Committees.
    • Standing Committees are of the following kinds :
    1. Financial Standing Committees (FSC)
    2. Department Related Standing Committees (DRSC)
    3. Others Standing Committees (OSC)

    About DRSCs

    • There are 24 Department-related Standing Committees (DRSCs). Each of these committees have 31 members – 21 from Lok Sabha and 10 from Rajya Sabha.
    • The 17 Departmentally Related Standing Committees were formally constituted with effect from April, 1993.
    • After experiencing the working of the DRSC system for over a decade, the system was restructured in July,2004 wherein the number of DRSCs was increased from 17 to 24.
    • These members are to be nominated by the Speaker of Lok Sabha or the Chairman of Rajya Sabha respectively. The term of office of these committees does not exceed one year.
    • These committees are serviced either by Lok Sabha secretariat or the Rajya Sabha secretariat depending on who has appointed the chairman of that committee.

    Equal to 10 House sittings

    • During a usual sitting of Parliament, the Houses are convened for six hours. Calculating it accordingly, the meeting of these committees amount to 10 sittings of Parliament.
    • Proportionately, the work done by the 16 Committees of Lok Sabha amounts to another 20 sittings of the Parliament.
    • In all, the work put in by the total 24 DRSCs in examining the Demands for Grants of all the ministries equals 30 days of functioning of the Parliament, which is quite significant.
    • If the working of the committees is taken into account for the entire year, it will amount to significantly higher number of days.
  • Hazards of using fertilizers in Punjab

    Studies have pegged consumption of phosphatic fertilizers in Punjab at ten times higher than the national average. Thence media has consistently reported on cancer deaths in the Malwa region of Punjab.

    What are phosphatic fertilizers?

    • Phosphatic fertilizers are chemical substances that contain the nutrient phosphorus in an absorbable form (Phosphate anions) or that yield after conversion in the soil.
    • Phosphates help plants store energy, root well, flower and produce fruit.
    • The DAP or Diammonium Phosphate is the widely used phosphatic fertilizer in our country.
    • The total fertilizer consumption in India is 27 million tones, out of which about 20-25 per cent of phosphorous and nitrogen-based nutrients are dependent on imports from the United States, Jordan, Iran, Oman, China, Russia, Morocco, Israel, Lithuania and Egypt.

    Hazards of phosphatic fertilizers

    • Pursuant to the disquieting reports from the area, BARC in 2013 analysed fertilizer and soil samples from the Malwa region and discovered heavy concentration of Uranium.
    • According to the report, Uranium concentration in DAP was around 91.77 parts per million (ppm), which was way beyond the permissible limit.
    • It is also a fact that the fertiliser industry in India does not follow all procedures and protocols essential for decontamination of imported phosphatic rock associated with traces of Uranium.
    • There is yet another theory which does not support the fertiliser route for Uranium ingestion through food chain, but emphasises on the geogenic factors for the possible presence of Uranium in the groundwater samples.
    • Higher concentrations of Uranium are present in certain types of soils and rocks, especially granite.
    • All the three isotopes of Uranium (U-234, U-235, U-238) have a half-life period ranging from 0.25 million years to 4.47 billion years, indicating their relative stability.

    Increasing Uranium contamination

    • Presence of Uranium is widespread, and according to the United Nations Scientific Committee on the Effects of Atomic Radiation, its normal concentration in soil is between 300 microgram per kg (ug/kg) and 11.7 milligram per kg (mg/kg).
    • In the Indian context, contamination of Uranium in Punjab’s groundwater has been a problem since the early 2000s.
    • High levels of uranium found in the fertile Malwa region along with industrial effluents leads to a bigger problem as it contaminates the groundwater.
    • The presence of bicarbonates, nitrate, chloride anions and soil is calcareous since the carbonic acid created in the process enhances leaching efficiency of uranium from soils and sediments.

    Matter of urgent importance

    • With no guidelines or acceptable standards by Central Pollution Control Board (CPCB) regarding the amount of uranium in fertilizers produced in India, we are on a dead track.
    • Authorities’ concerned need to take cognizance and invest in less expensive R&D of the decontamination process.
    • At the same time, it is also necessary to specify the acceptable limit of Uranium in groundwater.

    Back2Basics

    Complete details of fertilizers

    http://agritech.tnau.ac.in/agriculture/agri_nutrientmgt_fertilizers.html

  • [pib] Star Labelling Programme


    The Bureau of Energy Efficiency (BEE) has included Deep Freezer and Light Commercial Air Conditioners (LCAC) under its Star Rating Programme on a voluntary basis.

    What is the news?

    • The program will be initially launched in voluntary mode from 2ndMarch, 2020 to 31st December, 2021.
    • Thereafter, it will be made mandatory after reviewing the degree of market transformation in this particular segment of appliances.
    • In order to cover split ACs beyond the scope of existing BEE star labeling program upto a cooling capacity of 18kW, BEE has prepared a star labeling program for split ACs having cooling capacities in excess of 10.5kW and upto 18.0 kW.
    • This category of Air conditioners is termed as LCAC primarily due to their application in commercial air conditioning.
    • Through this initiative, it is expected to save around 2.8 Billion Units by FY2030, which is equivalent to GHG reduction of 2.4-million-ton Carbon Dioxide.

    Why such move?

    • Energy Efficiency has the maximum GHG abatement potential of around 51% followed by renewables (32%), biofuels (1%), nuclear (8%), carbon capture and storage (8%) as per the World Energy Outlook (WEO 2010).
    • India can avoid building 300 GW of new power generation up to 2040 with the implementation of ambitious energy efficiency policies (IEA – India 2020).
    • Successful implementation of Energy Efficiency Measures contributed to electricity savings of 86.60 BUs i.e. 7.14% of total electricity consumption of the country and emission reduction of 108.28 million tonnes of CO2 during 2017-18.

    About Star Labeling Programme

    • The programme has been formulated by Bureau of Energy Efficiency, as part of its mandate, under the Energy Conservation Act, 2001.
    • Under this Programme, BEE has covered 24 appliances till date wherein 10 appliances are under the mandatory regime.
    • The existing BEE star labelling program for Air Conditioners is based on Indian Standard IS 1391 part 1, part 2 and covers AC with cooling capacities up to 10.5kW.

    Other facts: UDIT

    • Urja Dakshata Information Tool (UDIT) (udit.beeindia.gov.in), a first-ever initiative taken by BEE with the World Resources Institute (WRI), to facilitate a database on energy e­fficiency was also launched.
    • UDIT is a user-friendly platform that explains the energy efficiency landscape of India across industry, appliances, building, transport, municipal and agriculture sectors.
    • UDIT will also showcase the capacity building and new initiatives taken up by the Government across the sectors in the increasing energy efficiency domain.
  • Delimitation in the UT of Jammu and Kashmir

    The newly created UT of Jammu and Kashmir (J&K) will be the only one in the country to undergo a delimitation exercise based on the population figures recorded in the 2011 census.

    Delimitation in J&K

    • The latest readjustment of boundaries of constituencies in other States and UTs has been done on the basis of 2001 census and in future it will be carried out according to the 2031 census.
    • As per 2011 Census, the population in Kashmir region is 68,88,475, Jammu has a population of 53,78,538 and Ladakh has 2,74,289.
    • Delimitation was last done in J&K in the year 1995.

    The legal basis for delimitation

    • Section 63 was introduced in the J&K Reorganisation Act so that delimitation exercise can be conducted smoothly without overlapping with other provisions of Delimitation Commission Act, 2002.
    • It is a saving clause and since J&K is a UT, it now has constitutional safeguards.
    • The provision did not require any separate legislation as it was incorporated in the primary Act.
    • It says that “until the relevant figures for the first census taken after the year 2026 have been published,” it shall not be necessary to readjust the constituencies.
    • And any reference to the “latest census figures” in shall be construed as a reference to the 2011 census figures.
    • The delimitation will be done for 90 seats as 24 seats fall in Pakistan Occupied Kashmir (PoK).

    Back2Basics

    https://www.civilsdaily.com/news/explained-delimitation-of-constituencies/

  • Migratory species in India


    With new additions to the wildlife list put out by the Convention on the Conservation of Migratory Species (CMS), scientists say that the total number of migratory fauna from India comes to 457 species.

    Migratory species in India

    • Globally, more than 650 species are listed under the CMS appendices and India, with over 450 species, plays a very important role in their conservation.
    • The Zoological Survey of India (ZSI) had for the first time compiled the list of migratory species of India under the CMS before the Conference of Parties (COP 13) held in Gujarat recently.
    • It had put the number at 451. They are the Asian elephant, great Indian bustard, Bengal florican, oceanic white-tip shark, urial and smooth hammerhead shark.
    • Birds comprise 83% (380 species) of this figure.

    Various species mentioned

    • India has three flyways (flight paths used by birds): the Central Asian flyway, East Asian flyway and East Asian–Australasian flyway.
    • In India, their migratory species number 41, followed by ducks (38) belonging to the family Anatidae.
    • The estimate of 44 migratory mammal species in India has risen to 46 after COP 13.
    • The largest group of mammals is definitely bats belonging to the family Vespertilionidae. Dolphins are the second highest group of mammals with nine migratory species of dolphins listed.
    • Fishes make up another important group of migratory species. Before COP 13, the ZSI had compiled 22 species, including 12 sharks and 10 ray fish.
    • Seven reptiles, which include five species of turtles and the Indian gharial and salt water crocodile, are among the CMS species found in India. There was no addition to the reptiles list.