💥Join UPSC 2027,2028 Mentorship (August Batch) + XFactor Notes & Microthemes PDF

GS Paper: GS3-12.Effects of liberalization on the economy, changes in industrial policy and their effects on industrial growth

  • Carney’s defiance is well thought out

    Carney’s defiance is well thought out

    Why in the News

    Canada’s Prime Minister has walked away from trade negotiations with the United States after Washington put forward terms that would have cost Canada its sovereignty, key industries, French language protections and its freedom to negotiate with other countries. He has also announced retaliatory tariffs matching the new United States tariffs dollar for dollar, stating that the Americans “asked too much and offered too little.” The move tests whether a middle power, an economy that sends roughly three quarters of its exports into a market ten times its size, can resist pressure from a dominant trading partner without folding, and it carries lessons for other countries, including India, that are negotiating their own terms with Washington.

    What calculations underlie the decision to walk away?

    1. Broad domestic backing: The stance draws support even from the opposition Conservative party, amid public frustration with the United States President’s repeated talk of making Canada the fifty first state.
    2. A contained tariff footprint: The new tariffs apply to only about 5 percent of Canada’s overall exports to the United States, worth roughly 20 billion dollars, limiting the immediate domestic cost of retaliation.
    3. A calculated bet on mutual damage: A breakdown in trade relations is expected to hurt the United States as well, so Canada does not need to win the confrontation outright, only to make the arithmetic politically painful in Washington.

    How exposed is the United States to a breakdown with Canada?

    1. A leading export destination: Canada is the largest export market for 26 American states and among the top three trading partners for 45 of the 50 states.
    2. Energy dependence: Canada supplies roughly 60 percent of America’s crude oil imports, and Canadian electricity helps power grids in New England and the upper Midwest.
    3. Critical inputs: Canadian potash is vital to American agriculture, while Canadian critical minerals feed strategically important American supply chains.

    Why is the timing unfavourable for Washington?

    1. Domestic economic strain: A stalemate with Iran has pushed United States gasoline prices above 4 dollars a gallon, while the 30 year Treasury yield has climbed above 5.3 percent, its highest level since 2007.
    2. Fiscal and political weakness: Federal debt has crossed 40 trillion dollars, and the United States President’s net approval rating has fallen to minus 26 percent, narrowing his room to absorb a prolonged trade standoff.

    What broader pattern does this defiance respond to?

    1. A repeated negotiating playbook: Governments from Mexico City to Brussels to Tokyo have spent the past year confronting an American administration that treats a signed trade agreement as an opening bid that can be revisited whenever it suits it, coercing partners with escalating tariff threats and demanding unilateral concessions.
    2. Prior diversification, not improvisation: The Canadian Prime Minister had earlier warned that middle powers must stand up or risk ending up “on the menu,” and spent close to a year building trade ties with China, the Gulf and Asia, including India, so that a closed door in Washington did not mean a locked room globally.

    Challenges to Canada’s defiance strategy

    1. Economic exposure to a sustained standoff: Canada still sends roughly three quarters of its exports to an economy ten times its own size, so a prolonged confrontation could cost jobs and growth even if it wins the political argument. Eg. Estimates cited alongside the retaliatory tariffs put up to 90,000 Canadian jobs at risk from a sustained trade confrontation. Fix. Continue diversifying export markets by deepening the trade ties already being built with China, the Gulf and Asia.
    2. A narrow tariff footprint limits leverage: The new tariffs cover only about 5 percent of Canada’s exports to the United States, so retaliation alone may be too small to force a reversal in Washington. Eg. Even a full breakdown leaves most of Canada’s three quarter dependence on the United States market untouched. Fix. Extend retaliation toward strategically sensitive sectors such as crude oil, electricity and critical minerals, where Canada supplies a large share of United States demand.
    3. Domestic political risk if pain outlasts patience: Sustained economic pain could erode the broad backing that currently underwrites the stance, including support from the opposition. Eg. Higher fuel and consumer prices from a prolonged standoff could shift Canadian public opinion before comparable pressure is felt in Washington. Fix. Time targeted relief for the sectors affected by the new tariffs so public patience holds through the standoff.

    Conclusion

    The decision to reject an unfavourable trade deal, backed by calculated retaliation and prior diversification of trade ties, is being read as proof that a middle power can resist pressure from a much larger economy without folding. Whether the strategy succeeds depends on whether Canada’s own economic pain stays contained and whether Washington’s vulnerabilities, from energy prices to approval ratings, bite hard enough to force a reversal. For India, still negotiating its own trade deal with Washington, the lesson is not to reject a deal outright but to know precisely which concessions it can never afford to make.

    [2025] What are the challenges before the Indian economy when the world is moving away from free trade and multilateralism to protectionism and bilateralism? How can these challenges be met?”

  • How the Supreme Court ruling redefined ‘industry’

    Why in the News

    A nine-judge Constitution Bench of the Supreme Court revisited the definition of “industry” laid down in Bangalore Water Supply and Sewerage Board v. A. Rajappa (1978), examining how that definition interacts with the term “industry” as newly defined under the Industrial Relations Code, 2020. The 1978 ruling had given “industry” a wide, functional definition covering any organised activity involving cooperation between employer and employee for producing goods or services, regardless of profit motive. The Industrial Relations Code, 2020 narrows this definition by carving out specific exclusions. The Bench’s majority and minority opinions diverge on whether Parliament’s narrower statutory definition can override the Bangalore Water Supply test for constitutional purposes.

    What did the Bangalore Water Supply test originally hold?

    1. Triple test for “industry”: The 1978 ruling held that any activity involving systematic cooperation between an employer and workers to produce or distribute goods or services qualifies as an industry, irrespective of whether the entity is charitable, religious, sovereign, or run by the government.
    2. Sovereign function exception, narrowly read: The 1978 Bench exempted only inalienable sovereign functions of the State, such as legislation, defence, and the administration of justice, from the definition.
    3. Wide coverage of welfare and professional bodies: The test brought hospitals, educational institutions, and clubs employing staff within the definition of “industry,” extending industrial-dispute protections to their employees.
    4. Persistent legislative attempts to narrow it: Parliament had earlier attempted to codify a narrower definition through an amendment that was never brought into force, leaving the 1978 test operative for over four decades.

    What does the Industrial Relations Code, 2020 change?

    1. Statutory definition narrows the exclusions: The Industrial Relations Code, 2020 (the law consolidating the Trade Unions Act 1926, the Industrial Employment (Standing Orders) Act 1946 and the Industrial Disputes Act 1947 into a single code) defines “industry” with specific carve-outs for institutions engaged in charitable, social, or philanthropic services not for profit.
    2. Government departments performing sovereign functions excluded: The Code writes into statute an exclusion for departments discharging sovereign functions, aligning more closely with a narrower reading than the 1978 test.
    3. Domestic and hospital work carved out selectively: The Code excludes certain categories, such as purely domestic service, while leaving other categories, including some hospitals, to be decided case by case.

    Where do the majority and minority views diverge?

    1. Majority view on legislative competence: The majority holds that Parliament may legislatively define “industry” for the purposes of a labour statute, and that a narrower statutory definition prevails over the judicially evolved 1978 test within the Code’s own field of operation.
    2. Minority view on protective intent: The minority holds that a legislative narrowing of “industry” risks excluding workers in charitable, educational, and welfare institutions from industrial-dispute protections that the 1978 Bench extended to them.
    3. Divergence on precedent’s continuing force: The majority treats Bangalore Water Supply as persuasive but non-binding once Parliament legislates a definition, while the minority treats it as continuing to bind interpretation of undefined terms outside the Code’s specific carve-outs.

    Conclusion

    The ruling settles, for now, that Parliament’s statutory definition of “industry” under the Industrial Relations Code, 2020 governs disputes falling within the Code, narrowing the wide protective sweep the Bangalore Water Supply test had given workers across charitable, educational and welfare institutions for over four decades. Litigation over which specific institutions fall inside or outside the Code’s carve-outs is expected to continue as the Code is implemented.

    Back2Basics: Industrial Relations Code, 2020

    1. One of the four labour codes consolidating 29 central labour laws, this one merging the Trade Unions Act, 1926, the Industrial Employment (Standing Orders) Act, 1946, and the Industrial Disputes Act, 1947.
    2. Raises the threshold for prior government permission before layoffs, retrenchment or closure from 100 to 300 workers in an establishment.
    3. Introduces a statutory recognition mechanism for trade unions and a two-member negotiating council where no single union has majority membership.
    4. Notified but implemented in phases, with States framing their own rules under it.

    Matching Previous Year Question

    “[2024, GS3, 15 marks] Discuss the merits and demerits of the four ‘Labour Codes’ in the context of labour market reforms in India. What has been the progress so far in this regard?”

  • [24th August 2026] The Hindu OpED: Core concerns

    [24th August 2026] The Hindu OpED: Core concerns

    Question (2017, GS3): ““Industrial growth rate has lagged behind in the overall growth of Gross-Domestic-Product (GDP) in the post-reform period” Give reasons. How far the recent changes is Industrial Policy are capable of increasing the industrial growth rate?
    Linkage: The easing of the Manufacturing PMI to its lowest level since August 2021 due to weak domestic demand is a classic real-time symptom of industrial growth lagging behind overall economic expansion. It forces candidates to examine why Indian manufacturing struggles to maintain sustained momentum.

    Mentor Comment

    Growth in the Index of Core Industries slowed to 5.4 per cent in July from 6 per cent in the previous month. The Manufacturing Purchasing Managers’ Index eased in the same month to its lowest level since August 2021, on weak domestic demand conditions. July’s core sector growth was still the second highest rate in the last seven months. The tension sits between that headline and its composition: a large part of the growth rests on a statistical low base effect, the two genuinely strong sectors are cement and electricity, and the domestic crude oil and natural gas sectors have contracted continuously for at least the last 14 months.

    What is the Index of Core Industries?

    • What it measures: The Index of Core Industries measures the combined production of the country’s core infrastructure industries, covering coal, crude oil, natural gas, refinery products, fertilisers, steel, cement and electricity.
    • Why it is watched: These industries carried a combined weight of about 40 per cent in the Index of Industrial Production, so the core index acts as an early read on industrial output before the fuller index is released.
    • Current series: The index is compiled on a revised new series, for which comparable data currently extends back only about 14 months.

    Why is the July core sector number weaker than it looks?

    • Growth rests on a low base: A large part of even this slower growth is based on a statistical low base effect, where a contraction in the corresponding month of the previous year makes the current month’s output look like expansion.
    • Coal illustrates the effect: The coal sector grew at an 11 month high of 7.6 per cent in July. That was measured against a contraction of 12.3 per cent in July of last year.
    • Refinery products repeat the pattern: The refinery products sector snapped a three month streak of contraction to grow at 2.7 per cent. This too was measured against a contraction in July 2025.
    • Iron ore’s strength is partly base driven: The iron ore sector grew at 29.5 per cent, slower than 44.5 per cent in June. Its comparison base is contractions of 16.4 per cent in June and 7.1 per cent in July of last year.
    • The headline flatters the trend: A rate that is second highest in seven months coexists with an easing demand signal, which means the ranking of the number matters less than what produced it.

    Which sectors are carrying the index and which are dragging it?

    • Steel has slowed sharply: The steel sector decelerated to 2.9 per cent in July from 5.6 per cent in June and 15.7 per cent in July of last year. This is a genuine slowdown rather than a base effect.
    • Hydrocarbons are a standing drag: The domestic crude oil and natural gas sectors have contracted continuously for at least the last 14 months for which the new series has data.
    • Electricity remains strong but is decelerating: The electricity sector grew at 9 per cent in July. That was slower than two consecutive months of double digit growth in May and June, which were lifted by prevalent heatwave conditions in many parts of the country.
    • Cement accelerated: The cement sector sped up to 13.1 per cent, the clearest genuine acceleration in the index.
    • The bright spots are only two: Within the core index, cement and electricity were the only two sectors reading as bright spots, and such positive trends were few and far between.

    Does the core sector number describe output or demand?

    • The two indicators point in opposite directions: The core index recorded its second highest growth in seven months in the same month that the Manufacturing Purchasing Managers’ Index fell to its lowest since August 2021.
    • They measure different things: The core index counts physical production in a set of infrastructure industries. The Manufacturing Purchasing Managers’ Index records what purchasing managers report about new orders and demand conditions.
    • A base effect can mask a contraction: A sector recovering from a deep fall registers a high growth rate at a low level of output, so a rate can rise even as demand conditions ease.
    • Weather and construction are not demand: The strongest readings came from electricity, lifted by heatwave conditions, and from cement, which tracks construction activity rather than broad consumer demand.
    • The forward reading is slack: Easing demand conditions were already being predicted by other indicators before the core sector data appeared, so the July slowdown was not a surprise.

    How is energy import dependence turning into a cost shock?

    • Import volumes are rising: India’s crude oil imports rose 13.3 per cent in volume terms in July. Liquefied Natural Gas (LNG) imports grew a more marginal 1.5 per cent.
    • Domestic supply is not filling the gap: Against the falling domestic base noted above, the economy’s appetite is being met from abroad rather than from home production.
    • The bill has jumped: High oil prices meant the crude oil import bill jumped 41 per cent in July, so a 13.3 per cent volume rise translated into a far larger payment outgo.
    • A tariff shock is queued behind it: The 100 per cent tariffs the United States is preparing to levy on countries such as India that import Russian oil will once again burden Indian exporters.
    • Blending has not yet displaced imports: Moving to 20 per cent ethanol blending has not yet impacted oil imports materially, so the substitution effect is not visible in the July numbers.

    Challenges to the Index of Core Industries as a growth signal

    • Base effects distort the headline rate: A contraction in the year ago month converts a modest recovery into a high growth print, which misleads on the level of output. Eg. Coal’s 11 month high of 7.6 per cent in July sat on a 12.3 per cent contraction in July of the previous year. Fix. Publish index levels and two year compound rates alongside the year on year rate in every release.
    • Coverage is narrow: The index tracks a small set of infrastructure industries and therefore misses most of the economy’s output. Eg. Services contribute over half of Gross Value Added and are entirely outside the core index. Fix. Publish the core index alongside a high frequency services activity indicator so the composite reading is visible.
    • Weights favour public sector heavy industries: The largest weights sit in sectors dominated by public enterprises and administered pricing, so the index responds to policy decisions as much as to market demand. Eg. Refinery products and electricity output move with administered allocation and tariff decisions. Fix. Rebase and reweight the index on a fixed cycle with published sensitivity of the headline to each sector’s weight.
    • Informal and small firm output is invisible: Production by micro and small enterprises is not captured, so a squeeze concentrated there does not register. Eg. Of about 64 million micro, small and medium enterprises, only around 14 per cent have access to formal credit and most stay outside statistical registers. Fix. Link the index to Goods and Services Tax e-way bill and electronic invoice data to capture small firm activity.
    • Provisional data is heavily revised: Early estimates are released on partial returns and are revised in later months, so a policy read taken on the first print can reverse. Eg. Iron ore’s July reading of 29.5 per cent followed a June figure of 44.5 per cent, a swing large enough to change the quarterly picture on revision. Fix. Publish a standing revision history for each sector so the reliability of the first print is visible.
    • It reads supply, not demand: The index counts what was produced, not what was bought, so it can rise while orders fall. Eg. July’s core growth of 5.4 per cent coincided with the Manufacturing Purchasing Managers’ Index at its weakest since August 2021. Fix. Present the core index and the demand side survey indicators in a single monthly dashboard rather than as separate releases.

    Conclusion

    The Indian economy looks set for a period of slack demand, higher costs and moderating growth. The July core sector reading does not contradict that: a large part of its growth is base driven, only cement and electricity grew genuinely strongly, and the sectoral spread set out above is narrow. The cost side is worsening independently, on the import bill and the tariff exposure already recorded. Whether the next few months show a genuine industrial recovery depends on domestic demand rather than on the base against which growth is measured.

    Industrial Growth in India

    • Manufacturing’s share is stuck: Manufacturing contributes around 17 per cent of Gross Domestic Product (GDP), far below the 25 per cent target set under Make in India.
    • Global standing: India holds about 2.8 per cent of global manufacturing output against China’s roughly 29 per cent, with domestic manufacturing output nearing $1 trillion in 2025-26.
    • Concentration: Maharashtra, Gujarat and Tamil Nadu account for about 40 per cent of net value added in manufacturing, and half the States have no operational Special Economic Zone.

    Government Initiatives for Industrial Growth

    • National Manufacturing Mission: Announced in the 2025-26 Budget, it unifies manufacturing policy and targets a 25 per cent GDP share with 143 million jobs by 2035.
    • Production Linked Incentive Scheme: Covers 14 sunrise and strategic sectors with outcome linked incentives, drawing over ₹1.76 lakh crore in committed investment as of March 2025.
    • Semiconductor Mission: A ₹76,000 crore framework under which 10 projects worth about ₹1.60 lakh crore have been approved.
    • Industrial Corridors Programme: India approved 11 corridors covering 32 projects, with 12 new industrial nodes cleared in 2024 for plug and play industrial cities.

    Challenges in Industrial Growth

    • Compliance load falls on small firms: Micro, small and medium enterprises face over 1,450 annual compliances, which consumes management time that would otherwise go into expansion. Eg. Annual compliance costs for such firms run to ₹13 lakh to ₹17 lakh. Fix. Adopt third party certification in place of repeat inspections, as the Ajay Shankar Committee recommended.
    • Regional concentration leaves capacity idle: Industrial value added clusters in three States, so national incentives do not translate into national capacity. Eg. Half of India’s States have no operational Special Economic Zone. Fix. Weight central incentive disbursal toward States below the national share of net value added.
    • Technology transition is slow in strategic segments: Domestic capability lags in electronics, semiconductors and renewable energy components, which keeps high value assembly abroad. Eg. India remains heavily dependent on imports for semiconductors and advanced electronic components. Fix. Extend Production Linked Incentives to upstream segments such as advanced materials and green hydrogen rather than final assembly alone.
    • Credit does not reach small manufacturers: Formal finance is unavailable to the great majority of small firms, so they cannot fund the fixed capital that raises productivity. Eg. The unmet credit demand of the micro, small and medium enterprise sector is estimated at about ₹20 lakh crore to ₹25 lakh crore. Fix. Expand cash flow based lending against Goods and Services Tax returns rather than collateral based assessment.
    • Trade barriers raise export uncertainty: Tariff action by large markets can remove the price advantage of an entire export segment without notice. Eg. The United States imposed a 50 per cent tariff in August 2025, hitting about 55 per cent of India’s exports to that market. Fix. Deepen global value chain participation through trade agreements and diversify destination markets under a China plus one strategy.
  • In a 5-4 ruling, Supreme Court for tweaking the definition of industry, exempts pending matters

    Why in the News

    A nine-judge Bench of the Supreme Court held on 20 August 2026, by a 5:4 margin, that the expansive 1978 interpretation of the term industry will not govern the Industrial Relations Code, 2020. The ruling preserves that interpretation for disputes already pending under the Industrial Disputes Act, 1947 and withdraws it from every case that follows.

    What is the ‘triple test’ laid down in Bangalore Water Supply (1978)?

    1. Origin: A seven-judge Constitution Bench in Bangalore Water Supply and Sewerage Board v. A. Rajappa (1978), authored by Justice V.R. Krishna Iyer, read Section 2(j) of the Industrial Disputes Act, 1947 expansively.
    2. The three conditions: An undertaking qualifies as an industry where there is systematic activity, organised by cooperation between employer and employee, for the production or distribution of goods or services calculated to satisfy human wants and wishes.
    3. What the test ignores: Profit motive is irrelevant to the classification. Purely spiritual or religious activity stays outside the definition.
    4. Reach: The test brought hospitals, educational institutions and municipalities within the fold of industry, exempting only core sovereign activities such as the judiciary, law and order and defence, in order to protect the state’s functional autonomy.

    What is the Industrial Relations Code, 2020?

    1. About: The Industrial Relations Code, 2020 consolidates the law on trade unions, standing orders and the settlement of industrial disputes into a single statute, and came into force in November 2025.
    2. The operative provision: Section 2(p) of the Code carries its own definition of industry, taking over the function that Section 2(j) of the 1947 Act performed for 48 years.

    What did the Supreme Court actually hold on the reach of the 1978 definition?

    1. A clean slate for the new Code: The majority held that industry under Section 2(p) of the Industrial Relations Code, 2020 would not be burdened by the 1978 interpretation of Section 2(j) of the 1947 Act.
    2. No sheet anchor: The Chief Justice of India stated that the 1978 judgment and its conclusion would not act as the sheet anchor or the foundation for any future interpretation of Section 2(p).
    3. A refinement, not a reversal: The majority found that the essential framework of the 1978 interpretation had withstood the test of time, and that some of its constituent elements could have been articulated differently to better reflect the scope and contours of Section 2(j).
    4. Prospective operation: The refined triple test evolved in the opinion of the Chief Justice of India will operate prospectively, and the modified definition will not apply to pending cases.
    5. Pending disputes protected: All matters presently pending before courts, tribunals and labour authorities under the Industrial Disputes Act, 1947 are to be adjudicated in accordance with the triple test as laid down in Bangalore Water Supply.
    6. Maintainability settled: The majority held that the reference questioning the correctness of the 1978 ruling was maintainable.
    7. Text still awaited: The fine print of the ruling prescribing the new formulation of the definition has not yet been released.

    Why was the 1978 definition sent to a nine-judge Bench at all?

    1. Docket explosion: Later Benches found that the 1978 definition produced what they called a docket explosion, bringing far more cases to the labour courts.
    2. A failed legislative narrowing: Parliament attempted to narrow the definition through the Industrial Disputes (Amendment) Act, 1982, excluding several organisations from its scope.
    3. The 2005 admission: The Centre told the Court in 2005 that no alternative dispute resolution mechanism existed for employees who would fall outside the amended definition, so the 1978 position continued to hold.
    4. Divergent readings: Subsequent rulings interpreted the 1978 judgment differently, and the case was referred to a nine-judge Bench for reconsideration.

    What three questions did the reference place before the Bench?

    1. Correctness of the test: Whether the test laid down in Bangalore Water Supply remains the correct interpretation of industry, and whether later legislative developments have any bearing on it.
    2. Welfare schemes: Whether welfare schemes run by the government count as an industrial activity.
    3. Sovereign function: What constitutes a sovereign function of the state, and whether such functions fall outside the ambit of labour law altogether.
    4. When framed: The Court identified these three broad questions for consideration in February 2026.

    Why does preserving the 1978 test only for pending cases divide the workforce in two?

    1. Two regimes running side by side: A dispute already filed under the 1947 Act is decided on the wide 1978 definition. An identical dispute arising under the Code is decided on a definition that has not yet been written out.
    2. The Court’s own reason: The majority stated that it did not intend to displace the governing legal position on pending proceedings, since doing so would create artificial discrimination.
    3. What the wide net secured: The 1978 definition enabled workers across a wide range of jobs to obtain legal recourse on wages, working hours, strikes, collective bargaining and protection against arbitrary dismissal.
    4. What the clean slate removes: Workers whose disputes arise after the Code’s commencement lose the settled presumption that their workplace is an industry, and must establish it afresh under Section 2(p).

    What does the dissent argue about the State as an employer?

    1. Reference itself questioned: Justice B.V. Nagarathna found the reference against the 1978 verdict unwarranted and not maintainable, and held that the ruling required no interference or modification.
    2. Identity of the employer is irrelevant: The dissent held that merely because a function is performed by the State, it cannot be exempted from the definition of industry, so the test of who carries out the activity is not relevant.
    3. Nature of the activity governs: Social welfare activities and schemes undertaken by government departments or their instrumentalities can be construed as industrial activities for the purpose of Section 2(j), depending on the nature of the activity and all other relevant factors.
    4. Why it matters now: The dissent held that it was important, now more than ever, to retain the inclusive definition of industry to safeguard workers’ rights.
    5. Split within the majority side: Justice Joymalya Bagchi recorded disagreement with the majority on the reformulation of the triple test, and Justices Dipankar Dutta and Ujjal Bhuyan wrote dissenting opinions.

    What challenges follow from redefining ‘industry’ under the new Code?

    1. Coverage uncertainty until the operative text arrives: The modified formulation was pronounced without the wording that prescribes it being available, so adjudicating authorities have no text to apply. Eg. The hour-long pronouncement on 20 August 2026 ended with the fine print of the new formulation still awaited.
    2. Identical workplaces treated differently by filing date: The cut-off is the date of the proceeding, not the nature of the work, so two workers in the same undertaking can face different definitions. Eg. A dispute in a municipal water supply undertaking filed under the 1947 Act is decided on the triple test, and one arising afterwards is not.
    3. No fallback forum for excluded categories: Narrowing the definition removes workers from the industrial adjudication machinery without putting anything in its place. Eg. The Centre itself told the Court in 2005 that no alternative dispute resolution mechanism existed for employees who would fall outside a narrowed definition.
    4. Threshold effects that discourage firms from growing: The Code applies its stricter obligations only above stated headcounts, which gives firms a reason to stop hiring below the line. Eg. Standing orders now apply at 300 employees and prior approval for layoff, retrenchment and closure applies at 300 workers, both raised from far lower thresholds.
    5. The sovereign function boundary left to case-by-case litigation: The Court has framed the question of what a sovereign function is without settling a workable test for it. Eg. Whether a government-run welfare scheme is an industrial activity was one of the three questions placed before the Bench in February 2026.
    6. A definition built for a standard employment relation: The triple test turns on cooperation between employer and employee, which platform-mediated work does not fit. Eg. Gig and platform workers are addressed through the Code on Social Security, 2020 rather than through the industrial dispute machinery.

    Conclusion

    The Court has separated the past from the future of a single statutory term, keeping Justice Krishna Iyer’s wide definition alive for disputes already in the system and denying it any authority over the Code that now governs Indian industrial relations. The substantive contest has therefore moved from the judiciary to the text of Section 2(p) and to whoever interprets it first. The Industrial Relations Code, 2020 has been in force since November 2025, and the next milestone is the release of the full text of the judgment carrying the refined formulation of the triple test.

    “[2024, GS3, 15] Discuss the merits and demerits of the four ‘Labour Codes’ in the context of labour market reforms in India. What has been the progress so far in this regard?”

  • Steel mills face margin squeeze as global coking coal prices rise

    Why in the News

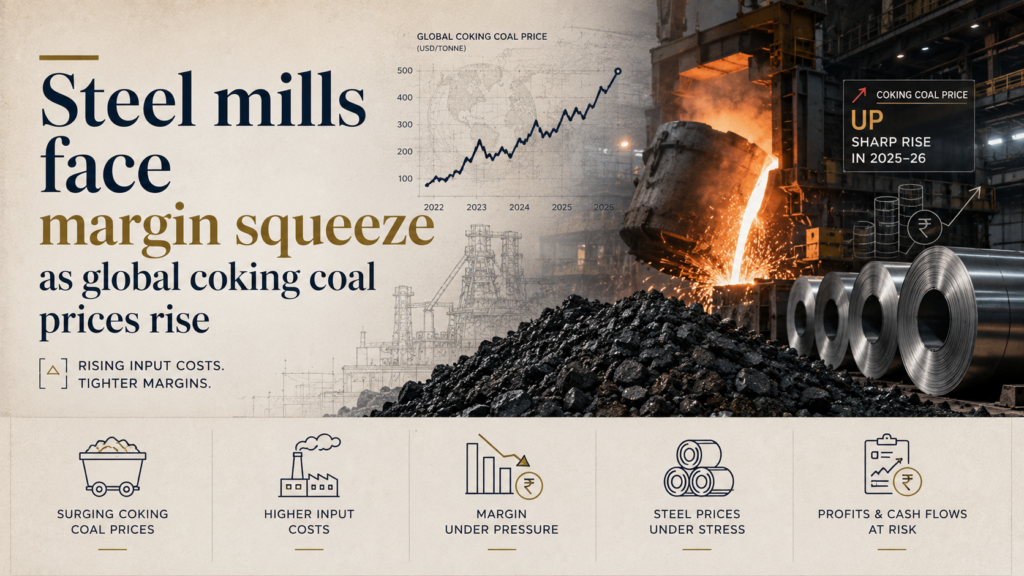
    Premium hard coking coal has averaged $236 per metric ton freight on board Australia in the first seven months of 2026, a jump of 25 percent over last year. Indian steelmakers import 95 percent of their coking coal and face competition from cheap Chinese steel at the selling end, so the input shock cannot be passed on to buyers.

    What is coking coal and why does it decide steelmaking costs?

    1. Definition: Coking coal is a low ash, low sulphur coal that is baked into coke, the carbon source that both fuels the blast furnace and chemically strips oxygen from iron ore. It is not interchangeable with the thermal coal used in power stations.
    2. Share of cost: Coking coal accounts for nearly 40 percent of steel production costs, which makes its price the single largest swing factor in a mill’s margin.
    3. Import dependence: India meets 95 percent of its coking coal needs through imports, with at least half shipped from Australia.
    4. Cost transmission: For blast furnace based steelmakers, every $10 a ton increase in coking coal prices adds approximately $7 to $9 per metric ton to steelmaking costs.

    What does freight on board (FOB) Australia mean?

    1. Price basis: Freight on board (FOB) is the price of the cargo at the loading port, before ocean freight and insurance are added. The $236 per metric ton benchmark is therefore the Australian port price, not the delivered Indian cost.

    Why have global coking coal prices risen this year?

    1. Australian supply disruptions: Output interruptions at Australian mines removed tonnage from a market where India sources at least half its requirement.
    2. Slower ramp up at new mines: New Australian capacity has come on stream more slowly than expected, so the supply gap was not filled.
    3. Middle East conflict: The conflict in the Middle East provided price support across the seaborne coal complex.
    4. Shanxi accident: A large accident at a coal mine in Shanxi, China removed further tonnage from the market in the most recent phase of the price rise.
    5. Benchmark movement: Premium hard coking coal averaged $236 per metric ton FOB Australia over the first seven months of 2026, 25 percent above the previous year, on the metallurgical coal and coke market assessment of the consultancy CRU.
    6. Outlook for the rest of the year: Costs are likely to remain high in the second half of 2026, partly due to the loss of supply following the Shanxi coal mine disaster, on the assessment of BMI, a unit of Fitch Solutions.

    How does the price rise transmit into Indian mills’ balance sheets?

    1. Direct cost pass through: Each $10 a ton rise in coking coal adds $7 to $9 per metric ton to blast furnace steelmaking cost, on the estimate of an executive at a large steel mill.
    2. Volume exposure widens the hit: Coking coal imports are expected to rise by 2 million to 3 million tons in 2026-27, from 64 million tons a year earlier, on the estimate of the commodities consultancy BigMint, so the higher price applies to a larger tonnage.
    3. Freight adds on top of the cargo price: Trade flows have tightened with high demand from India and higher diesel, freight and insurance costs, on the assessment of Moody’s Ratings, raising the delivered cost above the FOB benchmark.
    4. Margin compression is already reported: Executives at three leading steelmakers report squeezed margins with little headroom to raise steel prices.

    Why can Indian mills not pass the cost on to buyers?

    1. Cheap Chinese steel sets the ceiling: Competition from cheap Chinese steel leaves little headroom to raise domestic steel prices even as input costs rise.
    2. Tariffs have not stopped the inflow: Shipments from China have increased despite import tariffs on some grades, so the trade remedy has not restored pricing power.
    3. Demand is strong but price inelastic: Domestic demand is buoyant on the back of infrastructure spending and strong economic growth, and that demand is being served at prices anchored by imports.
    4. Cost push and price ceiling combine: The squeeze operates from both ends at once, on the input side by coking coal and on the output side by import competition.

    What does the squeeze mean for India’s steel capacity expansion?

    1. Capital expenditure at risk: Squeezed margins could impede investment and delay capacity expansion at a time when Indian steelmakers are stepping up spending.
    2. Demand case remains intact: The expansion plans are driven by infrastructure led domestic demand and strong economic growth, so a delay is a supply side failure rather than a demand failure.
    3. Import bill widens: Rising coking coal import volumes alongside rising prices widen the trade exposure of a sector already dependent on a single dominant supplier.

    What do the source geographies of India’s coking coal reveal about its exposure?

    1. Australia, the anchor supplier: Australia ships at least half of India’s coking coal and is expected to continue doing so, which makes an Australian supply interruption an Indian cost event.
    2. China, both a supply and a competition risk: The Shanxi mine accident tightened coking coal supply, and rising Chinese steel shipments simultaneously cap Indian mills’ selling prices.
    3. Russia, a discount that has faded: Russian coal accounted for 24 percent of India’s coking coal imports in recent years, and the discounts on it have diminished over the past two years.
    4. Mozambique and the United States, the diversification margin: Imports from Russia, Mozambique and the United States are all set to rise as India spreads its sourcing.
    5. The Middle East, a freight channel rather than a supply channel: The United States and Iran war raises diesel, freight and insurance costs on seaborne routes rather than removing coal tonnage.

    Challenges to India’s coking coal supply security

    1. Extreme import concentration: A 95 percent import share with at least half from one country leaves no domestic buffer against a single supplier’s disruption. e.g. Australian supply disruptions in 2026 alone lifted the premium hard coking coal benchmark to an average of $236 per metric ton.
    2. Domestic coking coal is largely unusable raw: Indian coking coal carries high ash content and needs washing and blending with imported low ash coal before it can enter a blast furnace. e.g. the Jharia coalfield in Jharkhand holds India’s only significant prime coking coal deposits and still cannot substitute imports without beneficiation.
    3. No pricing power at the selling end: Import competition caps steel prices, so cost shocks are absorbed in the margin rather than recovered from the customer. e.g. Chinese shipments into India rose in 2026 despite import tariffs on some grades.
    4. Freight and insurance are a second, uncorrelated shock: Shipping cost spikes hit the delivered price even when the cargo price is stable. e.g. the United States and Iran war raised diesel, freight and insurance costs on the routes carrying Indian bound coal.
    5. Capacity expansion is the first casualty: Compressed margins delay the capital expenditure cycle rather than current output, so the damage appears years later. e.g. Indian mills stepping up spending to serve infrastructure driven demand now face investment decisions taken under a squeezed margin.
    6. The scrap based alternative route is supply constrained: Electric arc and induction furnace steelmaking avoids coking coal but depends on scrap that India does not generate in sufficient volume. e.g. India continues to import ferrous scrap despite the Steel Scrap Recycling Policy, 2019.

    Conclusion

    India’s steel sector faces a cost shock it cannot pass on, because a 95 percent import dependence on coking coal sits alongside a domestic price ceiling set by cheap Chinese steel. Coking coal is set to remain expensive through the second half of 2026 following the Shanxi supply loss, and import volumes are projected to rise by 2 million to 3 million tons in 2026-27. The immediate risk is not to current production but to the capacity expansion India needs to meet infrastructure led demand. Reducing the exposure requires domestic beneficiation capacity and a wider supplier base, neither of which can be built within a single price cycle.

    Steel Sector in India

    1. Global standing: India is the world’s largest crude steel producer after China and the world’s largest producer of direct reduced iron, also called sponge iron.
    2. Two production routes: The blast furnace and basic oxygen furnace route depends on coking coal and iron ore, and the electric arc furnace, induction furnace and direct reduced iron route depends on scrap, natural gas or non coking coal.
    3. Policy target: The National Steel Policy, 2017 targets 300 million tonnes of crude steel capacity and per capita finished steel consumption of 158 kg by 2030-31.
    4. Structural dependence: India holds large thermal coal reserves but very limited prime coking coal, so the raw material constraint is qualitative rather than quantitative.
    5. Trade position: India moved to being a net importer of finished steel in recent years, which is why import competition now shapes domestic pricing.

    Government Initiatives for the Steel Sector

    1. Production Linked Incentive Scheme for Specialty Steel: Approved in 2021 to incentivise domestic manufacture of value added grades such as coated steel, high strength steel and electrical steel that India otherwise imports.
    2. Mission Purvodaya: Launched in 2020 to build an integrated steel hub in eastern India, drawing on the iron ore and coal belt of Odisha, Jharkhand, West Bengal, Chhattisgarh and Andhra Pradesh.
    3. Steel Scrap Recycling Policy, 2019: Sets up a framework of registered scrapping centres to raise domestic scrap availability and reduce reliance on imported scrap and on coking coal based production.
    4. Domestically Manufactured Iron and Steel Products Policy: Provides preference to domestically manufactured iron and steel in government procurement, to anchor demand for local mills.
    5. Steel Import Monitoring System: Requires advance registration of steel imports so that the government has near real time visibility of import volumes, grades and prices.
    6. Mission Coking Coal: A Ministry of Coal initiative to raise domestic raw coking coal production and washing capacity so that the import share falls over time.
    7. Green Steel Taxonomy: Notified in 2024 to define and star rate low emission steel, creating a domestic standard ahead of carbon border measures in export markets.

    Key Facts about Coking Coal and Indian Steel

    1. Jharia coalfield: Located in Jharkhand, it holds India’s only significant reserves of prime coking coal and has been affected by long running underground mine fires.
    2. Ash content problem: Indian coking coal typically carries ash levels well above the imported grades, which is why it must be washed and blended rather than used directly.
    3. Coke, not coal, enters the furnace: Coking coal is converted to metallurgical coke in coke ovens before charging into the blast furnace.
    4. Administering ministry: The steel sector is administered by the Ministry of Steel and coal by the Ministry of Coal, which is why coking coal policy sits across two ministries.
    5. Non coking coal use: The sponge iron route uses non coking coal, which India produces domestically in large volumes, and is the reason India leads the world in direct reduced iron.

    “[2020, GS1, 15 marks] Account for the present location of iron and steel industries away from the source of raw material, by giving examples.”

  • Socialism as the shackle: revisiting the four decades before the 1991 reforms

    Why in the News

    India holds foreign exchange reserves of $700 billion, including 880 tonnes of gold, on its 80th Independence Day. In early 1991 the same reserves had fallen below $1 billion, and the escape required a Prime Minister formed in socialist politics to pledge the country’s gold to foreign banks.

    What was the licence permit quota system?

    1. About: The administrative regime under which a private firm needed a government licence to set up capacity, expand output, change product mix or import inputs.
    2. Legal basis: The Industries (Development and Regulation) Act, 1951 reserved industrial licensing to the Centre and listed the industries requiring approval.
    3. Delivery vehicle: Investment was allocated through five year plans, which placed the public sector first in the commanding heights of the economy.
    4. Effect on entry: Capacity was fixed by the licence rather than by demand, so a firm could not expand even when the market grew.
    5. Effect on competition: New entrants competed for approvals rather than for customers, which made the licence itself the scarce asset.

    What is a balance of payments crisis?

    1. Definition: A country cannot meet payments for imports and external obligations because its foreign exchange earnings and reserves fall short of what it owes.
    2. The operative measure: Severity is read in import cover, that is the number of weeks of imports the reserves can finance, not in the absolute size of the reserves.

    What was the socialist pattern of society resolution?

    1. Adoption: The Congress session at Avadi in Tamil Nadu in 1955 passed a resolution declaring a socialist pattern of society to be the goal of government policy.
    2. Content: It committed the government to state ownership and state direction of the principal means of production.

    What is the Bank for International Settlements (BIS)?

    1. Definition: A Basel based institution owned by central banks that functions as a bank to central banks, with operations that made it one of the two lenders against India’s gold in 1991.
    2. Function: It accepts deposits and gold from member central banks and extends short term credit against that collateral.

    What was the 42nd Constitutional Amendment Act, 1976?

    1. Preamble change: It inserted the words socialist, secular and integrity into the Preamble of the Constitution.
    2. Wider effect: It also expanded the protection given to laws implementing Directive Principles and curtailed the scope of judicial review, and much of it was reversed by the 44th Amendment.

    Why did the 1991 crisis force India to pledge its gold?

    1. Reserve collapse: Foreign exchange reserves fell below $1 billion in early 1991, producing a full balance of payments crisis.
    2. Import cover: The remaining reserves covered only about two weeks of imports.
    3. The only option left: The Reserve Bank Governor advised that India’s gold be mortgaged to the Bank of England and the Bank for International Settlements in Switzerland, and dollars borrowed against it.
    4. Quantum pledged: About 67 tonnes of gold moved out in two consignments during 1991.
    5. Closed markets: A downgrade below investment grade had shut India out of ordinary commercial borrowing, which left collateralised lending as the only route.

    How did socialism become the organising idea of Indian economic policy?

    1. 1927: A visit to Moscow for the decennial celebration of the October Revolution converted Jawaharlal Nehru to socialism.
    2. 1929: As president of the Indian National Congress he declared that India will have to go the socialist way.
    3. 1936: A revolt in the Congress Working Committee followed, in which seven senior leaders including Sardar Patel, Rajendra Prasad, C Rajagopalachari, J B Kripalani and Jamnalal Bajaj resigned.
    4. Gandhi’s condition: Mahatma Gandhi extracted a commitment that socialism would not become the Congress’s official policy, and it was honoured as long as Gandhi and Patel were alive.
    5. After 1950: The theme returned, and the 1955 Avadi resolution made a socialist pattern of society the declared goal of government.
    6. Instrumentation: The goal was executed through five year plans and the licence permit quota system, which emphasised state led growth and discouraged individual entrepreneurship.

    What did four decades of state led growth actually deliver?

    1. Poverty rose: Decadal data published in 1965 showed the poverty rate had risen from 52.66 per cent to 58.60 per cent.
    2. Food rationing persisted: India was the only country still running food rationing two decades after the Second World War.
    3. Agriculture stagnated: Agricultural productivity remained among the lowest in the world.
    4. The income floor: In Parliament in 1963 it was asserted that 270 million Indians lived on three annas, that is 19 paise, a day while the Prime Minister’s pet dog cost nearly three rupees a day.
    5. Enterprise discouraged: Licensing made official approval rather than consumer demand the binding constraint on production.

    Where did ideological commitment collide with fiscal solvency?

    1. The formation: The Prime Minister of 1990 to 1991 had begun his political life under the socialist leaders Acharya Narendra Dev and Ram Manohar Lohia.
    2. The dilemma: Pledging national gold to foreign banks contradicted the economic doctrine he had held throughout that political life.
    3. The counter argument: The Reserve Bank Governor’s case was that the country ranked above the doctrine, and it prevailed.
    4. Who acted: A lame duck government running on a thin majority took the decision that kept India solvent until a reform government could be formed.
    5. Who is credited: The turnaround is attributed to the Prime Minister and Finance Minister who followed, not to the government that pledged the gold.

    How much of the 1991 collapse can be attributed to socialism alone?

    1. Oil shock: The Gulf conflict of 1990 raised crude prices and cut worker remittances from West Asia at the same time.
    2. Deposit flight: Non resident deposits were withdrawn rapidly as confidence in repayment fell.
    3. Fiscal position: The fiscal deficit had reached about 8.4 per cent of gross domestic product in 1990 to 1991, financed by borrowing.
    4. Political instability: Three governments in two years delayed every corrective decision.
    5. Model exhaustion: The licensing system had already produced four decades of low growth, so an external shock met an economy with no buffer.

    What did other countries do when the same model failed?

    1. China: The Four Modernisations introduced by Deng Xiaoping in 1978 opened agriculture, industry, defence and science and technology to market incentives, with special economic zones as the entry point for foreign capital.
    2. Soviet Union: The planned economy did not reform in time and collapsed along with the state itself in the early 1990s.
    3. Vietnam: The Doi Moi programme from 1986 replaced collective farming with household production and legalised private enterprise.
    4. Poland: The stabilisation programme of 1990 freed prices and made the currency convertible in a single step rather than in stages.

    Challenges to the post 1991 reform model

    1. Manufacturing share stagnation: Industry has not absorbed labour at the expected scale, e.g. manufacturing has remained near 17 per cent of gross value added against the 25 per cent target set under Make in India.
    2. Factor market reform stalled: Land and agricultural marketing reform remain politically blocked, e.g. the three farm laws enacted in 2020 were repealed in 2021 after a year of protest.
    3. Labour codes unimplemented: Consolidation of labour law has not translated into uniform practice, e.g. the four labour codes passed by 2020 waited years for States to notify matching rules.
    4. Disinvestment slippage: Public sector exits are announced faster than they are completed, e.g. the sale of Air India concluded in 2022 after two decades of failed attempts.
    5. Credit cycle damage: Directed and concentrated lending has repeatedly produced stress, e.g. the asset quality review of 2015 exposed non performing assets built up in infrastructure and power lending.
    6. Policy predictability: Retrospective changes deter long term capital, e.g. the retrospective tax amendment of 2012 triggered the Vodafone and Cairn arbitrations and was withdrawn only in 2021.

    Conclusion

    The crisis of 1991 was the terminal cost of a model in which official approval, not consumer demand, set the limit on production. The decisive moment came when a Prime Minister formed in socialist politics accepted that solvency outranked doctrine. Liberalisation removed the licence, but factor markets, manufacturing scale and policy predictability remain unresolved three decades later.

    What is Economic Liberalisation?

    1. About: Economic liberalisation is the removal of state controls on entry, capacity, prices and trade so that market signals rather than administrative permission allocate resources.
    2. Rationale: It addresses the shortages, rent seeking and low productivity that follow when output is capped by licence rather than by demand.
    3. Liberalisation: The first element removes industrial licensing, price controls and import restrictions on domestic producers.
    4. Privatisation: The second element transfers ownership or management of state enterprises to private hands and opens reserved sectors to private entry.
    5. Globalisation: The third element integrates the domestic economy with world markets through trade, investment and currency convertibility.

    Key Concerns Regarding Economic Liberalisation

    1. Jobless growth: Output growth has not produced proportionate formal employment, leaving a large workforce in low productivity informal work.
    2. Regional divergence: Investment concentrates in States with existing infrastructure, widening the gap with lagging States.
    3. Concentration of market power: Deregulation without strong competition enforcement allows dominant firms to entrench themselves.
    4. External vulnerability: Open capital accounts transmit global shocks quickly through portfolio flows and the exchange rate.
    5. Weak social protection: Removal of administered prices raises the burden on households where targeted transfers are incomplete.

    Constitutional Framework Governing Economic Policy in India

    1. Preamble: The word socialist, inserted by the 42nd Amendment in 1976, declares a normative economic orientation without prescribing a specific model.
    2. Article 19(1)(g): Guarantees the freedom to practise any profession or carry on any occupation, trade or business.
    3. Article 19(6): Permits reasonable restrictions on that freedom, including the creation of a complete or partial state monopoly in any trade.
    4. Article 39(b): Directs that ownership and control of material resources be distributed to best subserve the common good.
    5. Article 39(c): Directs that the operation of the economic system not result in concentration of wealth to the common detriment.
    6. Article 31C: Protects laws made to give effect to Articles 39(b) and 39(c) from challenge on specified fundamental rights grounds.
    7. Article 246 with Union List Entry 52: Places industries whose control by the Union is declared expedient in the public interest within Parliament’s exclusive competence, which is the basis of central industrial licensing.
    8. Article 301: Guarantees freedom of trade, commerce and intercourse throughout the territory of India.

    Laws and Rules Governing Industrial Policy in India

    1. Industries (Development and Regulation) Act, 1951: Created the licensing system for industrial capacity; it remains in force but licensing now applies to only four industries.
    2. Industrial Policy Resolution, 1956: Classified industries into three schedules and reserved the commanding heights for the public sector.
    3. Monopolies and Restrictive Trade Practices Act, 1969: Restricted expansion by large firms above an asset threshold, and was repealed and replaced by the Competition Act, 2002.
    4. Foreign Exchange Regulation Act, 1973: Capped foreign equity and criminalised exchange violations, and was replaced by the Foreign Exchange Management Act, 1999, which shifted violations from crime to civil penalty.
    5. New Industrial Policy, 1991: Abolished industrial licensing except for a short list, opened reserved sectors and raised the automatic route for foreign investment.
    6. Competition Act, 2002: Shifted regulation from restricting size to prohibiting anti competitive agreements and abuse of dominance.
    7. Insolvency and Bankruptcy Code, 2016: Created a time bound resolution process, which supplied the exit mechanism the licence era economy never had.

    Back2Basics: The 1991 New Economic Policy

    1. Trigger: Foreign exchange reserves below $1 billion and import cover of about two weeks.
    2. Gold pledge: About 67 tonnes of gold were pledged to the Bank of England and to a Swiss bank across two consignments in 1991.
    3. Devaluation: The rupee was devalued in two steps on 1 and 3 July 1991, by roughly 9 per cent and 11 per cent.
    4. External support: India drew on an International Monetary Fund standby arrangement, conditioned on fiscal correction and structural reform.
    5. Industrial delicensing: Licensing was abolished for all but 18 industries, a list since reduced to four.
    6. Trade and investment: Import tariffs were cut sharply and foreign direct investment up to 51 per cent was permitted through an automatic route in listed industries.

    Government Initiatives for Industrial Growth

    1. Make in India: Launched to raise manufacturing’s share of output and employment through sector specific facilitation.
    2. Production Linked Incentive schemes: Pay incentives on incremental sales in named sectors such as electronics, pharmaceuticals and solar modules.
    3. National Single Window System: Consolidates central and State approvals for a new industrial project into one application portal.
    4. PM GatiShakti National Master Plan: Coordinates infrastructure planning across ministries to reduce logistics cost for industry.
    5. Jan Vishwas (Amendment of Provisions) Act, 2023: Decriminalised a large number of minor business offences to reduce compliance risk.
    6. Startup India: Provides tax benefits, a fund of funds and simplified compliance for recognised new enterprises.

    Key Facts about the 1991 Reforms

    1. The Budget of 1991: The reform Budget was presented in July 1991 and paired fiscal correction with trade liberalisation.
    2. Licensing today: Only four industries still require an industrial licence, including alcoholic drinks, tobacco products, defence and aerospace equipment, and industrial explosives.
    3. Reserve position now: Foreign exchange reserves stand at about $700 billion, with gold holdings of 880 tonnes.
    4. Rate of change: Reserves more than doubled over the last twelve years.
    5. Preamble litigation: The presence of the word socialist in the Preamble has been repeatedly challenged, and the Supreme Court has declined to read it as mandating a specific economic model.

    Challenges in India’s Industrial Economy

    1. Scale deficit in manufacturing: Firms stay small to retain benefits tied to size, e.g. the majority of registered manufacturing units remain micro enterprises with fewer than ten workers.
    2. Import dependence in key inputs: Assembly has grown faster than component making, e.g. India still imports the bulk of active pharmaceutical ingredients and advanced electronic components from China.
    3. Logistics cost: Freight moves disproportionately by road, e.g. rail’s share of freight traffic has fallen steadily since the 1950s, raising delivered cost for bulk industry.
    4. Land acquisition friction: Project land remains slow and contested to assemble, e.g. the Nandigram and Singur episodes in West Bengal ended two large industrial projects outright.
    5. Skills mismatch: Formal training does not match employer requirements, e.g. employability surveys repeatedly report that a minority of engineering graduates are job ready without retraining.
    6. Power reliability and cost: Industrial tariffs cross subsidise other consumers, e.g. energy intensive units in several States run captive diesel or solar capacity to avoid grid interruption.

    Way Forward

    1. Complete factor market reform: Move on land assembly, tenancy and labour rule notification instead of amending statute without implementation.
    2. Tie incentives to competitiveness: Structure production incentives to expire on a fixed schedule so that supported sectors face world prices.
    3. Deepen component ecosystems: Extend support beyond final assembly to component, material and capital goods manufacturing.
    4. Cut logistics cost: Shift bulk freight to rail and coastal shipping through dedicated corridors and multimodal terminals.
    5. Stabilise tax and regulatory expectations: Rule out retrospective taxation by statute and publish advance rulings to reduce litigation.
    6. Align skilling with employers: Fund apprenticeships tied to firm level hiring rather than to enrolment targets.

    “[2017, GS3, 15 marks] “Industrial growth rate has lagged behind in the overall growth of Gross-Domestic-Product (GDP) in the post-reform period” Give reasons. How far the recent changes is Industrial Policy are capable of increasing the industrial growth rate?”

  • Govt extends PM E-DRIVE scheme timeline, sop halved

    Why in the news?

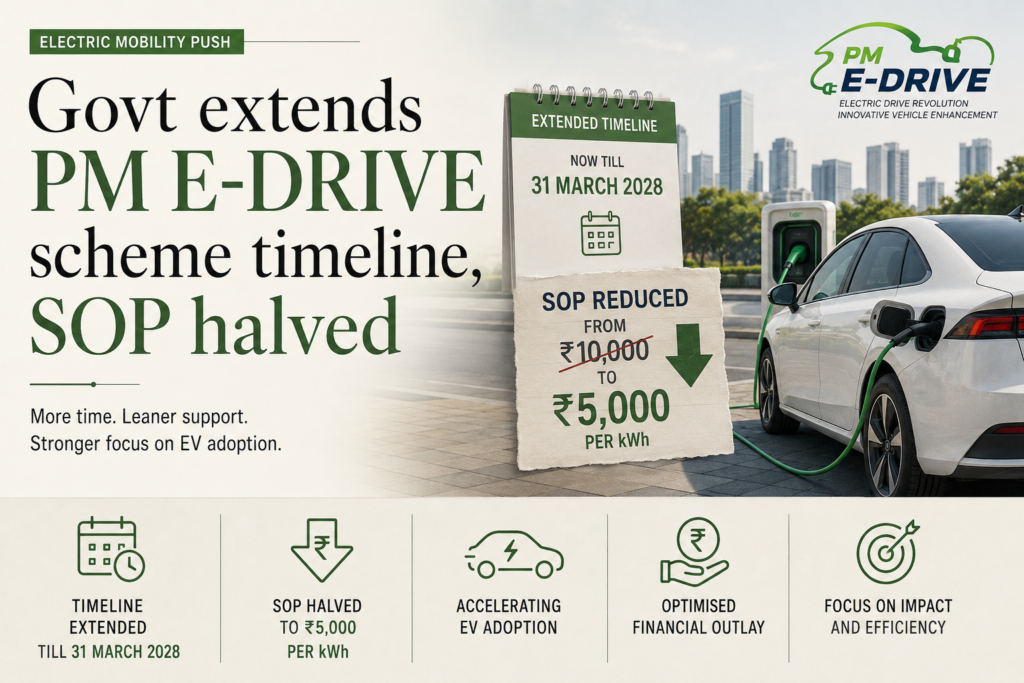
    The Centre has extended the PM Electric Drive Revolution in Innovative Vehicle Enhancement (PM E-DRIVE) Scheme for electric two wheelers till 31 March 2028 and halved the per unit incentive to Rs 2,500 per kilowatt hour from Rs 5,000 earlier. The move signals a planned tapering of demand support as electric two wheeler costs fall and the market matures.

    What is the PM E-DRIVE Scheme?

    1. What it is: PM E-DRIVE is the central scheme providing demand incentives and support infrastructure for electric mobility, administered by the Ministry of Heavy Industries. It succeeds the earlier FAME programme as the main demand side push for electric vehicles.
    2. Outlay and duration: It carries an outlay of Rs 11,900 crore and is implemented from 1 April 2024 till 31 March 2028.
    3. Two wheeler support: For electric two wheelers, the scheme sets a total fund support of Rs 2,767 crore from the Ministry of Heavy Industries.

    What has changed?

    1. Timeline extended: The electric two wheeler segment has been extended till 31 March 2028.
    2. Incentive halved: The per unit incentive is cut to Rs 2,500 per kilowatt hour from Rs 5,000 per kilowatt hour earlier.
    3. Per vehicle cap lowered: The incentive is capped at Rs 5,000 per vehicle, down from Rs 10,000 per vehicle in FY 2024-25.
    4. Eligibility window: Registered electric two wheelers can avail the Rs 2,500 per kilowatt hour incentive for the period between 1 April 2025 and 31 March 2028.
    5. Price ceiling: The maximum ex factory price for an electric two wheeler to qualify is Rs 1.5 lakh.
    6. Lower of two limits: The incentive is limited to the specified cap or 15 per cent of the ex factory price of the electric two or three wheeler, whichever is lower, and is subject to periodic review as vehicle costs fall.

    Back2Basics: PM E-DRIVE Scheme

    1. Ministry: Ministry of Heavy Industries.
    2. Launch year: 2024, implemented from 1 April 2024 to 31 March 2028.
    3. Outlay: Rs 11,900 crore.
    4. Aim: Accelerate adoption of electric vehicles and build charging and testing infrastructure.
    5. Beneficiaries: Buyers of electric two, three, and heavier vehicles, state transport undertakings, and charging infrastructure providers.

    Government Initiatives for Electric Mobility

    1. FAME India (Phase I and II): Earlier demand incentive scheme for electric and hybrid vehicles.
    2. PLI Auto Scheme: Production Linked Incentive for advanced automotive technology products.
    3. PLI ACC Battery Scheme: Incentive for domestic advanced chemistry cell battery manufacturing.
    4. Vehicle Scrappage Policy: Phasing out unfit vehicles to spur cleaner replacements.
    5. e-AMRIT portal: A one stop information platform on electric vehicles.

    Key Facts about PM E-DRIVE

    1. Successor scheme: PM E-DRIVE succeeds FAME II as the flagship electric mobility scheme.
    2. Incentive metric: Support is calculated per kilowatt hour of battery capacity.
    3. Segment coverage: Covers electric two wheelers, three wheelers, buses, trucks, and ambulances, plus charging infrastructure.

    Challenges to Electric Vehicle Adoption

    1. Charging infrastructure gap: Public charging networks remain thin outside major cities.
    2. Battery import dependence: Reliance on imported cells and critical minerals raises cost and supply risk.
    3. High upfront cost: Purchase prices stay above comparable petrol vehicles despite incentives.
    4. Range and grid strain: Range anxiety and grid readiness limit uptake in some segments.
    5. Recycling burden: End of life battery disposal needs robust recycling systems.
    6. Incentive dependence: Demand remains sensitive to the level and continuity of subsidies.

    “[2023, GS3, 15 marks] The adoption of electric vehicles is rapidly growing worldwide. How do electric vehicles contribute to reducing carbon emissions and what are the key benefits they offer compared to traditional combustion engine vehicles?”

    [2025] With reference to India, consider the following pairs: Organization Union Ministry
    1. The National Automotive BoardMinistry of Commerce and Industry
    2. The Coir BoardMinistry of Heavy Industries
    3. The National Centre for Trade
    InformationMinistry of Micro, Small and Medium Enterprises
    How many of the above pairs are correctly matched?

    [A] Only one

    [B] Only two

    [C] All the three

    [D] None

  • PIB Backgrounder Charts India’s Electric Vehicle Ecosystem

    Why in the News

    A PIB Backgrounder has highlighted the rapid growth of India’s Electric Vehicle (EV) ecosystem, showcasing significant progress in EV adoption, charging infrastructure, battery manufacturing, and government support.

    What does the Backgrounder Highlight?

    • EV Penetration: Increased from 0.08% in 2016 to 8.26% in 2026.
    • EV Sales: Rose from about 50,000 units in 2016 to 2.3 million units in 2025.
    • Charging Infrastructure: India had 52,718 public charging stations by July 2026, with a target of about 1.32 million stations by 2030.
    • National Goal: Achieve a 30% share of electric vehicles in new vehicle sales by 2030 under the EV30@30 initiative.

    PM E-DRIVE Scheme

    • Full Form: PM Electric Drive Revolution in Innovative Vehicle Enhancement (PM E-DRIVE).
    • Launched: 2024, replacing the FAME scheme.
    • Outlay: ₹10,900 crore.
    • Coverage: Electric two-wheelers. Electric three wheelers. Electric trucks. Electric buses. Electric ambulances.
    • Objective: Accelerate EV adoption through demand incentives and supporting infrastructure.

    Battery Manufacturing Push

    Production Linked Incentive (PLI) Scheme for Advanced Chemistry Cell (ACC)

    • Outlay: ₹18,100 crore.
    • Manufacturing Target: 50 GWh of Advanced Chemistry Cell battery capacity.
    • Objective: Promote domestic battery manufacturing and reduce import dependence.

    Earlier Initiative: FAME Scheme

    • Full Form: Faster Adoption and Manufacturing of Electric Vehicles (FAME).
    • Launched: 2015.
    • Phase II: Implemented until 2024.
    • Replaced by: PM E-DRIVE in 2024.

    [2025] In the context of electric vehicle batteries, consider the following elements:

    I. Cobalt

    II. Graphite

    III. Lithium

    IV. Nickel

    How many of the above usually make up battery cathodes?

    (a) Only one (b) Only two (c) Only three (d) All the four

  • Rising private R&D spending should be channelled into manufacturing

    Why in the News

    For the first time, private industry has overtaken the government as the largest source of Research and Development (R&D) spending in India, marking a significant shift in the country’s innovation ecosystem. However, India’s overall R&D investment remains low compared to major economies.

    What does the R&D data show?

    • Private sector leads: Private industry contributed 51.8% of India’s total R&D expenditure in 2023 to 2024.
    • Low R&D intensity: India’s Gross Expenditure on R&D (GERD) is only 0.84% of GDP.
      • Global comparison: China: 2.58%, United States: 3.45%, South Korea: 4.94%
    • Limited research workforce: India has only 354 researchers per million population, much lower than leading innovation economies.

    Why should R&D focus on manufacturing?

    • Higher value addition: Promotes movement from low-end assembly to high-technology manufacturing.
    • Import substitution: Reduces dependence on imported technologies and critical components.
    • Employment generation: Encourages advanced manufacturing, creating skilled jobs and strengthening industrial competitiveness.
    • Global competitiveness: Supports initiatives such as Make in India and Atmanirbhar Bharat.

    What institutional support exists?

    Anusandhan National Research Foundation (ANRF)

    • Established under: ANRF Act, 2023.
    • Corpus: ₹50,000 crore over five years.
    • Objective: Promote research, innovation and collaboration among academia, industry and government.
    • Key role:
      • Mobilise private sector investment in research.
      • Coordinate research funding across institutions.
      • Strengthen India’s innovation ecosystem.

    Prelims Pointers

    • GERD (Gross Expenditure on Research and Development): Total national expenditure on R&D as a percentage of GDP.
    • Private industry is now India’s largest R&D spender.
    • ANRF replaced the Science and Engineering Research Board (SERB) as the apex research funding body.
    • India spends less than 1% of GDP on R&D.

    [2015] Which of the following statements is/are correct regarding National Innovation Foundation-India (NIF)?
    1. NIF is an autonomous body of the Department of Science and Technology under the Central Government
    2.NIF is an initiative to strengthen the highly advanced scientific research in India’s premier scientific institutions in collaboration with highly advanced foreign scientific institutions.
    Select the correct answer using the code given below.

    [A] 1 only

    [B] 2 only

    [C] Both 1 and 2

    [D] Neither 1 nor 2

  • Rajya Sabha passes the MSME Development (Amendment) Bill 2026

    Why in the News?

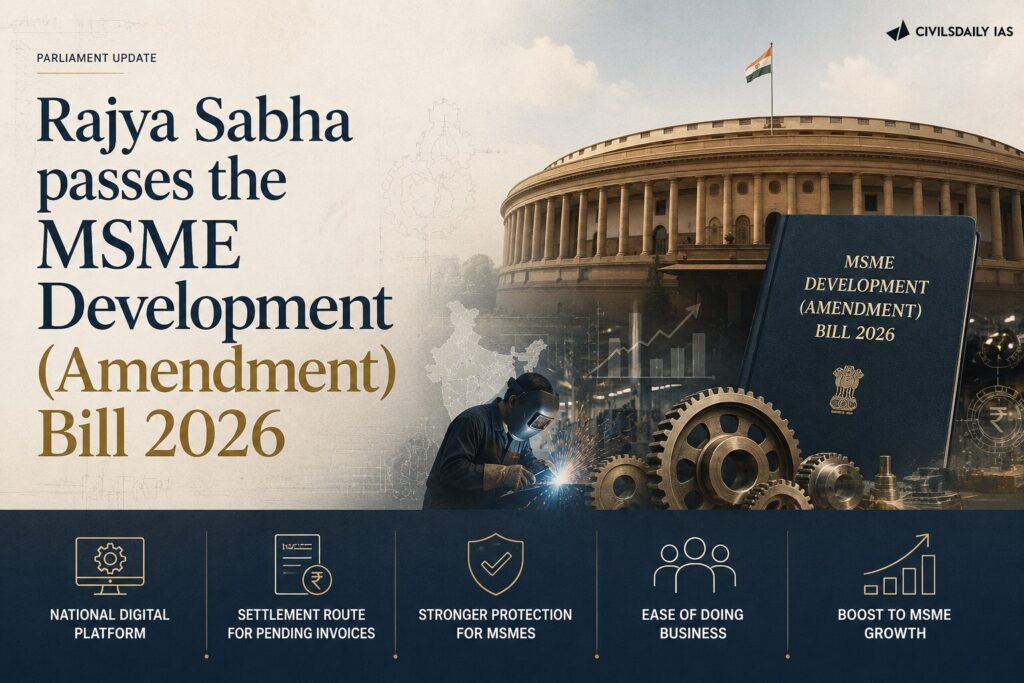
    The Rajya Sabha passed the Micro, Small and Medium Enterprises (MSME) Development (Amendment) Bill, 2026, replacing the MSME Development Act, 2006. It aims to improve formalisation and liquidity by introducing a digital registration platform and mandatory invoice settlement through Trade Receivables Discounting System (TReDS).

    Key Provisions

    • National Digital Registration: Free, voluntary online registration for MSMEs.
    • Mandatory TReDS: Central Public Sector Enterprises (CPSEs) must settle MSME invoices through the Trade Receivables Discounting System (TReDS).
    • Updated Framework: Replaces the 2006 Act governing MSME classification, credit and delayed payments.
    • Objective: Improve timely payments while balancing business interests.

    What is TReDS?

    • Trade Receivables Discounting System (TReDS) is a Reserve Bank of India (RBI) regulated electronic platform where MSMEs sell approved invoices to financiers for immediate cash.
    • Process: MSME uploads invoice → financiers bid → MSME gets upfront payment → buyer pays financier on the due date.

    Why is the Amendment Needed?

    • Delayed payments reduce MSME working capital.
    • Easier registration promotes formalisation and access to credit.
    • Institutional credit has grown, but access remains uneven.

    Importance of MSMEs

    • Contribute 31% of Gross Domestic Product (GDP).
    • Account for 36% of manufacturing output.
    • Contribute 41% of exports.
    • Second largest employer after agriculture.

    Challenges

    • Voluntary registration may exclude many firms.
    • TReDS mandate covers only CPSEs.
    • Smaller firms may struggle to attract financiers.
    • Weak enforcement and digital literacy remain concerns.

    MSME Classification

    • Micro: Investment ≤ ₹2.5 crore; Turnover ≤ ₹10 crore
    • Small: Investment ≤ ₹25 crore; Turnover ≤ ₹100 crore
    • Medium: Investment ≤ ₹125 crore; Turnover ≤ ₹500 crore

    Key Initiatives

    • Udyam Registration Portal
    • MSME Samadhaan
    • Trade Receivables Discounting System (TReDS)
    • Priority Sector Lending (PSL)

    “[2023] Consider the following statements with reference to India:

    1. According to the ‘Micro, Small and Medium Enterprises Development (MSMED) Act, 2006’, the ‘medium enterprises’ are those with investments in plant and machinery between Rs. 15 crore and Rs. 25 crore.

    2. All bank loans to the Micro, Small and Medium Enterprises qualify under the priority sector.

    Which of the statements given above is/are correct?

    (a) 1 only

    (b) 2 only

    (c) Both 1 and 2

    (d) Neither 1 nor 2.