Scientists from Agharkar Research Institute developed a biodegradable nanomedicine platform capable of silencing cancer driving genes in breast cancer cells, offering a promising precision oncology therapy.
Key Highlights
Research published in: Advanced Healthcare Materials.
Developed under: Department of Science and Technology.
Uses: Targeted gene silencing strategy.
Aim: Effective tumour inhibition with minimal toxicity.
What is Nanomedicine?
Nanomedicine refers to the use of nanoscale materials and technology for:
Side effects associated with conventional therapies.
Key Technology Used
Mesoporous Silica Nanoparticles
Biodegradable nanoparticles with:
High drug loading capacity.
Tunable surface chemistry.
Used to deliver: Small interfering RNA (siRNA).
What is siRNA?
Small interfering RNA (siRNA): Molecules that silence specific genes by preventing protein production.
Used in:
Gene therapy
Cancer treatment research.
[2015] With reference to the use of nanotechnology in health sector, which of the following statements is/are correct? 1.Targeted drug delivery is made possible by nanotechnology 2.Nanotechnology can largely contribute to gene therapy Select the correct answer using the code given below.
PYQ Relevance[UPSC 2017]‘China is using its economic relations and positive trade surplus as tools to develop potential military power status in Asia’. In the light of this statement, discuss its impact on India as her neighbour.Linkage: The PYQ focuses on China’s broader strategy of converting economic, diplomatic, and strategic influence into regional power projection. The article reflects China’s broader strategy of using its growing power to strengthen territorial claims and strategic leverage along the India-China border, particularly through the “Early Harvest” proposal.
Mentor’s Comment
India and China have resumed discussions on boundary settlement through the Special Representatives (SR) mechanism after years of tensions following the 2020 Galwan crisis. The significance lies in the reported revival of the idea of an “early harvest” settlement in the Sikkim sector, a proposal first discussed in 2005.
What is the Indo-China border?
The India-China border is defined by a 3,488-kilometre-long frontier known as the Line of Actual Control (LAC).
Three Sectors of the LAC
The un-demarcated border is geopolitically divided into three operational sectors:
Western Sector: Covers Ladakh. It features key flashpoints like the Galwan Valley, Pangong Tso, and the Depsang Plains, directly adjacent to the Chinese-controlled Aksai Chin wasteland.
Central Sector: Runs across the peaceful, less contested states of Himachal Pradesh and Uttarakhand.
Eastern Sector: Spans Sikkim and Arunachal Pradesh. It historically follows the McMahon Line, which India recognizes but China disputes by claiming Arunachal Pradesh as “South Tibet“.
How Have India-China Boundary Negotiations Evolved?
Phase 1: Historical Boundary Legacy
1890 Anglo-Chinese Convention
Defined the Sikkim-Tibet boundary.
Mentioned Mount Gipmochi as the starting point.
Introduced the watershed principle.
Phase 2: Military Confrontation
1967 Nathu La and Cho La Clashes
Major armed confrontations after the 1962 war.
Demonstrated unresolved border disputes.
Phase 3: Confidence-Building Era
1993 Agreement on Peace and Tranquillity
First major agreement to maintain stability along the LAC.
1996 CBM Agreement: Military confidence-building measures.
2005 Political Parameters and Guiding Principles: Created framework for final boundary settlement. Envisaged:
Political settlement first.
Delimitation later.
Demarcation afterwards.
Phase 4: Emergence of the Early Harvest Idea
2005-2010s
Discussions emerged on resolving easier sectors first.
Sikkim identified as a possible candidate.
India remained cautious about abandoning the package-settlement approach.
Phase 5: Doklam and Strategic Distrust
2017 Doklam Standoff
China attempted road construction near the tri-junction.
India intervened.
Highlighted strategic importance of Sikkim-Doklam region.
Phase 6: Breakdown of Trust
2020 Galwan Clash
First combat fatalities in decades.
India linked broader bilateral relations to peace on the LAC.
Phase 7: Renewed Negotiations
May 2025: Working Mechanism for Consultation and Coordination (WMCC) discussed steps toward boundary delimitation.
August 2025
24th Special Representatives Meeting.
Agreement to establish an Expert Group.
China referred to “demarcation” and negotiations in favourable sectors.
Phase 8: Current Debate
China’s Preference: Sector-wise or “Early Harvest” settlement.
India’s Preference
Comprehensive package settlement.
Peace and tranquillity on the LAC as a precondition.
Protection of interests in Eastern Ladakh, Arunachal Pradesh, and the Doklam tri-junction.
How Do Recent India-China Boundary Talks Indicate a Revival of the “Early Harvest” Approach?
The Early Harvest Proposal refers to the idea of resolving those sectors of the India-China boundary where agreement is relatively easier, while leaving the more contentious sectors for later negotiations. Under this approach:
India and China would first settle the Sikkim sector, where differences are comparatively limited.
More difficult disputes such as Eastern Ladakh and Arunachal Pradesh would be postponed.
China would obtain a formal settlement in one sector while negotiations continue indefinitely elsewhere.
Why Does the Revival of the “Early Harvest” Proposal Matter?
Special Representatives Dialogue: India and China held the 24th round of SR talks in August 2025, reviving discussions on boundary settlement.
Expert Group Formation: Both sides agreed to establish an Expert Group to examine boundary delimitation in India-China border areas.
Chinese Terminology Shift: China used the term “demarcation” and referred to launching negotiations in sectors where conditions are favourable.
Strategic Concern: Sector-wise settlements could enable China to secure gains in less disputed regions while retaining leverage in contentious sectors.
Diplomatic Significance: Marks the return of political-level boundary negotiations after prolonged military tensions.
What Is the Historical Basis of the Sikkim Boundary Dispute?
Nathu La Clashes (1967): Heavy casualties occurred on both sides despite Sikkim’s eventual accession to India.
Convention of 1890: The Anglo-Chinese Convention identified Mount Gipmochi as the starting point of the Sikkim-Tibet boundary.
Watershed Principle: The convention specified that the boundary follows the mountain ridge separating watersheds.
Tri-Junction Dispute: India and Bhutan maintain that the tri-junction lies near Batang La, about 6.5 km north of Gipmochi.
Strategic Geography: The dispute directly affects the location of the India-China-Bhutan tri-junction.
Why Is the Tri-Junction Location Strategically Important?
Jampheri/Zompelri Ridge: Controls approaches overlooking the Siliguri Corridor.
Siliguri Corridor Security: The narrow corridor connects mainland India with the Northeast.
Chinese Objective: A favourable tri-junction location would provide China greater strategic depth in the Chumbi Valley.
Military Leverage: Enhanced access could improve Chinese observation and operational capabilities.
Territorial Implications: A revised boundary could indirectly legitimise Chinese claims over nearby areas.
How Does the Doklam Experience Influence India’s Position?
Chinese Consolidation: Since the 2017 Doklam standoff, China has strengthened military infrastructure in western Bhutan.
Road Construction: Expansion of roads and permanent facilities has altered ground realities.
Pressure on Bhutan: Increased Chinese presence creates incentives for Bhutan to negotiate on China’s terms.
Indian Concerns: Any settlement affecting the tri-junction could have direct consequences for India’s security.
Strategic Lesson: Temporary stand-offs do not necessarily prevent long-term territorial consolidation.
Why Does India Link Boundary Settlement With Peace Along the LAC?
Galwan Legacy: The 2020 clashes fundamentally altered trust levels in bilateral relations.
LAC Stability Principle: India maintains that broader normalization depends on peace and tranquillity along the border.
Military Buildup: Large-scale troop deployments remain in several sectors.
Confidence Deficit: Repeated violations of prior understandings have weakened confidence in incremental agreements.
Negotiation Framework: India seeks restoration of stability before pursuing major political settlements.
How Has China Altered Ground Realities Along the Border?
Infrastructure Expansion: Construction of roads, airfields, logistics hubs, and border villages.
Military Consolidation: Increased troop presence and deployment capabilities along sensitive sectors.
Administrative Assertion: Renaming locations in Arunachal Pradesh seeks to reinforce territorial claims.
Border Villages Programme: Expansion of settlements near the LAC strengthens administrative presence.
Strategic Messaging: Combines military, political, and infrastructural measures to reinforce claims.
What Was the Significance of the 2005 Agreement?
Political Parameters Agreement (2005): Established principles for resolving the boundary issue.
Two-Step Process: Envisaged political settlement first, followed by delimitation and demarcation.
Package Settlement Concept: Favoured an overall settlement rather than sector-wise resolution.
Mutual Safeguards: Recognized the need to protect strategic interests of both sides.
Framework Relevance: Continues to provide the most comprehensive basis for negotiations.
Should India Accept a Sector-Wise Settlement?
Arguments in Favour
Incremental Progress: Resolves less contentious sectors.
Confidence Building: May improve bilateral atmosphere.
Diplomatic Momentum: Prevents complete stagnation of negotiations.
Administrative Clarity: Reduces ambiguity in settled regions.
Arguments Against
Loss of Leverage: Settled sectors can no longer be bargaining instruments.
Strategic Risk: May strengthen Chinese positions elsewhere.
Historical Precedent: Past agreements have not always prevented new tensions.
Asymmetrical Benefits: China could secure gains while retaining flexibility in contentious sectors.
What Principles Should Guide India’s Negotiating Strategy?
Comprehensive Settlement: Prioritises holistic resolution over isolated agreements.
LAC Stability: Makes peace and tranquillity a precondition for progress.
Strategic Reciprocity: Ensures mutual concessions rather than unilateral compromises.
Protection of Core Interests: Safeguards Arunachal Pradesh, Eastern Ladakh, and Siliguri Corridor security.
Ground Verification: Links agreements with verifiable implementation.
Conclusion
India’s challenge is not merely to settle a boundary segment but to secure a durable and equitable border framework. Any settlement must preserve strategic interests, maintain stability along the LAC, and avoid creating incentives for future coercion. A comprehensive settlement rooted in the 2005 framework, supported by verifiable peace on the ground, remains more consistent with India’s long-term security and diplomatic objectives than a narrowly defined “early harvest” approach.
Recently, NITI Aayog Frontier Tech Hub report was released and it assesses the country’s readiness for chip manufacturing. India has approved its first semiconductor fabrication unit at Dholera and launched a ₹76,000 crore India Semiconductor Mission. But, the report finds that the domestic ecosystem is still not equipped to meet national demand.
How Has India Built the Foundations of a Semiconductor Ecosystem?
Policy Priority: Semiconductor manufacturing has been identified as a strategic national priority.
India Semiconductor Mission (ISM): Operates with a corpus of ₹76,000 crore.
Financial Support: Provides incentives for fabs, compound semiconductor facilities, packaging units, design initiatives, and research.
Capital Subsidies: Major projects receive capital support of up to 50%.
Production Incentives: Several projects receive production-linked and output-linked incentives.
Dholera Fab: India’s first semiconductor fabrication facility is expected to become operational by 2028.
Ecosystem Development: Multiple packaging and testing facilities have been approved.
India Semiconductor Mission
The India Semiconductor Mission (ISM) is a specialized, independent business division within the Digital India Corporation under the Ministry of Electronics and Information Technology (MeitY).
It was launched in 2021 with an original financial outlay of ₹76,000 crore.
Its core purpose is to build a vibrant, sustainable semiconductor and display ecosystem to transition India from a chip consumer into a global electronic manufacturing and design hub.
Core Schemes & Financial Support: The initiative operates as a single-window nodal agency that evaluates proposals and distributes a 50% fiscal subsidy on a pari-passu basis across critical segments:
Semiconductor Fabs: Financial backing to set up silicon-based wafer fabrication plants.
Display Fabs: Incentives for building TFT LCD or AMOLED display manufacturing units.
Compound Semiconductors & ATMP: Support for Silicon Photonics, Sensors, and Assembly, Testing, Marking, and Packaging (ATMP/OSAT) plants.
Design Linked Incentive (DLI): Financial and infrastructure support for domestic fabless companies developing Integrated Circuits and Systems on Chips (SoCs).
ISM 2.0
Announced in the latest 2026 Union Budget, ISM 2.0 drives local supply chain self-sufficiency.
It receives a targeted ₹1,000 crore budgetary provision for FY 2026-27 alongside an overall ₹8,000 crore layout for the modified manufacturing program.
Key targets include:
Upstream Supply Chains: Localizing production of specialty gases, chemicals, and lithography tools.
Indian IP & Processors: Scaling indigenous open-source RISC-V processors like DHRUV64 under the Digital India RISC-V (DIR-V) programme to secure digital sovereignty.
Talent Pyramid: Training over 85,000 to 100,000 engineers via the Chips to Startup (C2S) program and dedicated SMART Labs.
NITI Aayog Roadmap: Aligning with the NITI Frontier Tech Hub’s newly released “Future of India’s Semiconductor Industry” roadmap to target a $100-110 billion domestic market by 2030.
Why Does the Report Argue That India Remains Semiconductor-Dependent?
Import Dependence: India depends almost entirely on external suppliers, importing an estimated $15+ billion in electronics hardware. Major suppliers include China, Hong Kong, Taiwan, and Singapore
Domestic Supply Gap: India’s semiconductor ecosystem cannot fully meet domestic demand. The domestic semiconductor ecosystem is largely limited to Assembly, Testing, Marking, and Packaging (ATMP) rather than full-scale fabrication.
Electronics Vulnerability: Growth in electronics manufacturing remains dependent on external suppliers.
National Security Concerns: Defence systems rely on imported semiconductor components.
Supply-Chain Risks: Geopolitical disruptions could affect access to critical technologies and components.
What Structural Challenges Limit India’s Semiconductor Manufacturing Ambitions?
Time-Intensive Manufacturing Cycle
Long Gestation Period: Semiconductor fabs generally require 4-5 years before commercial production.
Yield Optimisation: Reliability and quality improvement continue for several quarters after production begins.
Technological Complexity
Equipment Dependence: More than 50 specialised equipment categories are required.
Global Supplier Concentration: Critical manufacturing tools are controlled by a limited number of international firms.
Capital Intensity
High Investment Requirements: Semiconductor manufacturing demands massive upfront capital expenditure.
Financial Risks: Long project cycles increase uncertainty for investors.
Skill Requirements
Advanced Expertise: Requires highly skilled engineers, designers, and process specialists.
Technology Gaps: Domestic capabilities remain under development.
Should India Replicate the Entire Global Semiconductor Value Chain?
India should not replicate the entire global semiconductor value chain, as doing so is financially impractical and technologically inefficient. The global semiconductor industry is highly fragmented, capital-intensive, and reliant on decades of hyper-specialization across different countries.
Selective Strategy: The report discourages attempts to replicate the complete global manufacturing spectrum.
Example: Instead of trying to build complex extreme ultraviolet (EUV) lithography machines (a sector monopolized by ASML in the Netherlands), India is focusing on specific nodes (like 28nm and above) that serve automotive and consumer electronics markets.
Capital Efficiency: Setting up a single advanced semiconductor fabrication plant (fab) can cost upwards of $10 billion to $20 billion. Replicating the entire chain would require hundreds of billions of dollars.
Example: By directing capital toward Assembly, Testing, Marking, and Packaging (ATMP) and Outsourced Semiconductor Assembly and Test (OSAT) facilities, such as the Tata Electronics facilities, India can enter the manufacturing ecosystem faster and at a fraction of the cost of a leading-edge logic fab.
System-Level Differentiation: Emphasises strategic specialisation rather than broad replication.
Example: India houses nearly 20% of the world’s semiconductor design engineers. By utilizing the Design-Linked Incentive (DLI) scheme, local startups can design specialized, proprietary chips for Artificial Intelligence (AI), 5G communications, and Internet of Things (IoT) devices, establishing a unique global niche.
Resource Optimisation: Supports targeted investments in high-potential segments.
Why Does the Report Advocate a Shift Towards Mature and Strategic Nodes?
Semiconductor nodes represent the transistor size, with advanced (3-7nm) focusing on density for high-end computing and mature nodes (28nm+) offering reliability for industrial use. The report advocates shifting toward mature and strategic nodes because they cost significantly less to build, have higher market demand in India, and directly secure critical industries like defense and automotive.
Technological Feasibility: India currently lacks the manufacturing ecosystem, equipment base, and process expertise required for competitive production at advanced 3-7 nanometre nodes.
Capital Efficiency: Mature-node semiconductor facilities require significantly lower investment and entail lower commercial risks than cutting-edge fabrication plants.
Market Demand: Mature-node chips continue to dominate demand in automobiles, industrial machinery, consumer electronics, power systems, and telecommunications equipment.
Strategic Utility: Domestic production of mature semiconductors can strengthen supply-chain resilience in defence, telecom, automotive, and critical infrastructure sectors.
Comparative Advantage: Compound semiconductors offer niche opportunities where India can develop specialised capabilities without directly competing in the most advanced fabrication segments.
Faster Capability Creation: Focusing on mature technologies enables quicker ecosystem development, workforce training, and industrial scaling than pursuing frontier-node manufacturing.
Why Can Semiconductor Packaging Become India’s Most Viable Entry Point into the Global Semiconductor Industry?
Lower Capital Requirement: Packaging and testing facilities require substantially lower investment than semiconductor fabrication plants, making entry easier for India.
Workforce Advantage: India’s large pool of engineers and technical professionals can support labour-intensive assembly, testing, and packaging operations.
Faster Capacity Expansion: Packaging facilities can be established and scaled more quickly than fabrication units, enabling rapid ecosystem development.
Import Substitution Potential: Domestic packaging capabilities can reduce dependence on foreign assembly and testing services in high-volume semiconductor segments.
Global Value Chain Integration: Packaging provides a practical route for India to participate in international semiconductor supply chains without mastering frontier-node manufacturing.
Foundation for Ecosystem Growth: A strong packaging industry can create demand for ancillary industries, skills, logistics networks, and future fabrication investments.
What Does “Sovereign Design and Research Capability” Mean for India?
Technological Sovereignty: Enhances control over critical technologies.
Global Positioning: Improves India’s role in future technology ecosystems.
Conclusion
India’s semiconductor strategy is entering an execution phase where success will depend less on replicating the entire global value chain and more on building competitive strengths in areas aligned with domestic capabilities. The NITI Aayog report advocates a pragmatic approach centred on mature-node manufacturing, semiconductor packaging, design innovation, and strategic international partnerships. By prioritising commercially viable segments while gradually deepening technological capabilities, India can strengthen supply-chain resilience, reduce strategic vulnerabilities, and establish itself as a credible participant in the global semiconductor ecosystem.
PYQ Relevance
[UPSC 2025] India aims to become a semiconductor manufacturing hub. What are the challenges faced by the semiconductor industry in India? Mention the salient features of the Indian Semiconductor Mission
Linkage: The PYQ tests understanding of high-technology manufacturing, industrial policy, technological self-reliance, and strategic sectors. The article evaluates India’s semiconductor strategy through the NITI Aayog report, highlighting challenges in fabrication, supply chains, investment, and skills while assessing the future direction of the India Semiconductor Mission
Rajasthan has announced its first-ever land pooling scheme, signalling a major shift in the way urban land is assembled for infrastructure and development projects.
What is land pooling?
Land pooling is a land acquisition strategy where landowners voluntarily hand over their land parcels to a government agency or development authority. The authority consolidates (pools) the land, builds modern infrastructure and then returns a smaller but highly developed portion of the land back to the original owners.
How does land pooling work?
Pooling: Landowners voluntarily transfer their fragmented, irregular plots to a central authority to create one continuous tract.
Infrastructure Development: The authority reserves a percentage of the total land to build roads, utilities, parks, and public services.
Reconstitution: The authority reorganises the remaining land into a planned layout of commercial, residential, and industrial plots.
Return: Each landowner receives back a physically smaller but highly developed plot equipped with modern amenities and significantly higher market value.
Example
Gujarat Town Planning (TP) Model
Land Contribution: Landowners typically contribute about 25-40% of their land.
Land Return: Approximately 60-75% of land is returned as serviced plots.
Integrated Development: Combines land assembly, infrastructure provision, cost recovery, and urban planning within a single framework.
How is land pooling governed in India?
Land pooling in India is governed through a decentralized framework managed primarily by individual state governments, rather than a single central federal law. The structural and legal governance framework breaks down into four primary tiers:
Constitutional Authority: Under the Constitution of India, Land and Colonisation fall explicitly under the State List (List II, Seventh Schedule).
State-Specific Legislative Acts
The Mechanism: States enact standalone Town Planning Acts or Urban Development Acts that provide the legal backbone for land pooling.
Examples: Notable examples include the Gujarat Town Planning and Urban Development Act, 1976, and the Andhra Pradesh Capital Region Development Authority Act, 2014, which laid out the legal rules for building the city of Amaravati.
Execution by Development Authorities
The Mechanism: State governments delegate the actual implementation and policing of land pooling schemes to specialized Urban Development Authorities.
The Power: Entities like the Delhi Development Authority (DDA) or the Mumbai Metropolitan Region Development Authority (MMRDA) are legally authorized to notify zones for pooling, verify land titles, collect landowner consensus, and re-allot reconstituted plots.
Judicial Oversight and Grievance Redressal
The Mechanism: State pooling policies mandatorily incorporate dedicated dispute resolution tribunals, appellate authorities, or arbitrators.
How Has Traditional Land Acquisition Become a Constraint to Urban Infrastructure Development?
Procedural Complexity: Land acquisition has historically been lengthy, litigation-prone, and administratively challenging.
Post-2013 Cost Escalation: The Right to Fair Compensation and Transparency in Land Acquisition, Rehabilitation and Resettlement Act, 2013 increased compensation, rehabilitation, and resettlement obligations.
Financial Burden: Higher compensation requirements have significantly increased project costs.
Implementation Gap: Planned infrastructure often remains under-executed due to inability to mobilise land.
Urbanisation Pressure: Expanding cities require large-scale land assembly for roads, public facilities, housing, and economic infrastructure.
Why Is Land Pooling Considered More Equitable Than Compulsory Acquisition?
Participatory Planning: Landowners remain stakeholders rather than losing ownership entirely.
Reduced Displacement: Limits physical displacement compared to conventional acquisition.
Value Capture: Landowners benefit from appreciation in land value after infrastructure development.
Financial Sustainability: Infrastructure costs are recovered through incremental development charges rather than large upfront expenditure.
Social Acceptance: Voluntary participation reduces resistance and legal disputes.
Environmental Protection: Facilitates planned development while preserving environmentally sensitive areas.
Why Is Gujarat Considered India’s Most Successful Land Pooling Model?
Historical Evolution: Land pooling was introduced nearly 100 years ago.
Legal Foundation: Formalised under the Gujarat Town Planning and Urban Development Act, 1976.
Large-Scale Implementation: More than 1,000 sq. km. has been planned through TP schemes.
Geographical Coverage: Implemented across Ahmedabad, Surat, Rajkot, Vadodara, and Gandhinagar.
Urban Expansion: Facilitated orderly peripheral growth and infrastructure provision.
Why Has Maharashtra Recently Revived Interest in Land Pooling?
Statutory Limitations: Existing legal provisions were not adequately updated for TP schemes.
Recent Adoption: The model has gained momentum in Pune and the Mumbai Metropolitan Region Development Authority (MMRDA).
Peripheral Development: Supports infrastructure creation and serviced land development in expanding urban regions.
Growth Management: Provides an alternative to fragmented urban expansion.
Why Land Pooling Initiatives like Guwahati Face Difficulties?
Institutional Challenges
Legal Gaps: The Guwahati Metropolitan Development Authority Act, 1985 lacked clarity on land appropriation percentages and institutional responsibilities.
Implementation Ambiguity: Development scheme preparation procedures remained inadequately specified.
Land Records Challenges
Manual Records: Land records were not digitised.
Record Mismatch: Discrepancies existed between revenue records and actual ground conditions.
Land pooling represents a shift from a compensation-centric model of land acquisition to a partnership-based model of urban development. The experiences of Gujarat, Maharashtra, Guwahati, and Rajasthan demonstrate that success depends less on the concept itself and more on institutional capacity, legal clarity, digitised land records, and equitable benefit-sharing. As India’s urbanisation accelerates, land pooling can become a critical instrument for balancing infrastructure needs with property rights and inclusive development.
Value Addition
Land Pooling vs Land Acquisition
Dimension
Land Acquisition
Land Pooling
Ownership
Government acquires land
Landowners retain stake
Compensation
Monetary payment
Reconstituted serviced plots
Participation
Compulsory
Voluntary
Displacement
Higher
Lower
Litigation
High
Relatively lower
Cost Burden
Upfront government expenditure
Shared through value capture
Benefit Sharing
Limited
Broader and participatory
PYQ Relevance
[UPSC 2024] What were the factors responsible for the successful implementation of land reforms in some parts of the country? Elaborate.
Linkage: The question focuses on land governance, fair land distribution, and factors that make land reforms successful. Land pooling is a modern land reform approach that uses voluntary participation, clear land records, and shared benefits to support planned development.
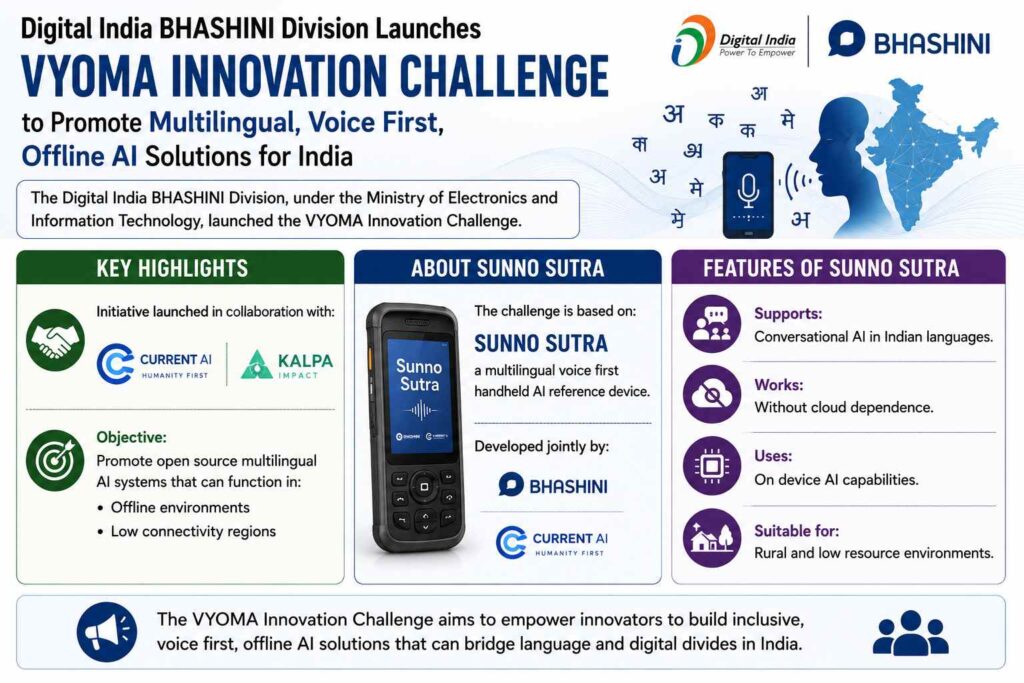
The Digital India BHASHINI Division, under the Ministry of Electronics and Information Technology, launched the VYOMA Innovation Challenge to promote multilingual, voice first, offline AI solutions for India.
Key Highlights
Initiative launched in collaboration with:
Current AI
Kalpa Impact.
Objective:
Promote open source multilingual AI systems that can function in:
Offline environments
Low connectivity regions.
About Sunno Sutra
The challenge is based on:
Sunno Sutra: A multilingual voice first handheld AI reference device.
Developed jointly by: BHASHINI and Current AI.
Features of Sunno Sutra
Supports: Conversational AI in Indian languages.
Works: Without cloud dependence.
Uses: On device AI capabilities.
Suitable for: Rural and low resource environments.
Objectives of the VYOMA Innovation Challenge
Encourage development of:
Multilingual AI applications.
Voice based technologies.
Improve:
Digital accessibility.
Language inclusion.
Promote: Edge AI innovation in India.
What is Edge AI?
Edge AI refers to: Artificial Intelligence processing directly on local devices instead of remote cloud servers.
Advantages:
Faster processing
Offline functionality
Better privacy
Reduced internet dependence
Sectors Targeted
Potential applications include:
Education
Agriculture
Healthcare
Governance
Public service delivery
[2020] With the print state of development, Artificial Intelligence can effectively do which of the following? 1. Bring down electricity consumption in industrial units 2. Create meaningful short stories and songs 3. Disease diagnosis 4. Text -to -Speech Conversion 5. Wireless transmission of electrical energy Select the correct answer using the code given below:
The Department of Higher Education under the Ministry of Education launched applications for the Prime Minister Research Chair (PMRC) Scheme 2026 to attract global Indian talent into India’s research and innovation ecosystem.
Key Highlights
The scheme aims to connect:
Indian origin researchers and professionals working abroad with:
India’s higher education and research institutions.
Focus areas include:
Research
Innovation
Technology development.
Objectives of PMRC Scheme
Strengthen: India’s research ecosystem.
Promote: International academic collaboration.
Enhance: Innovation in strategic sectors.
Support: Mission oriented research in national priority areas.
Thematic Areas Covered
The scheme focuses on 13 national priority sectors including:
Artificial Intelligence
Quantum Computing
Semiconductors
Cybersecurity
Biotechnology
Healthcare and MedTech
Space and Defence
Advanced Materials
Blue Economy
Atomic Energy
Climate Change and Sustainability.
[2018] Consider the following statements : Human capital formation as a concept is better explained in terms of a process which enables 1. individuals of a country to accumulate more capital. 2. increasing the knowledge, skill levels and capacities of the people of the country. 3. accumulation of tangible wealth. 4. accumulation of intangible wealth. Which of the statements given above is/are correct?
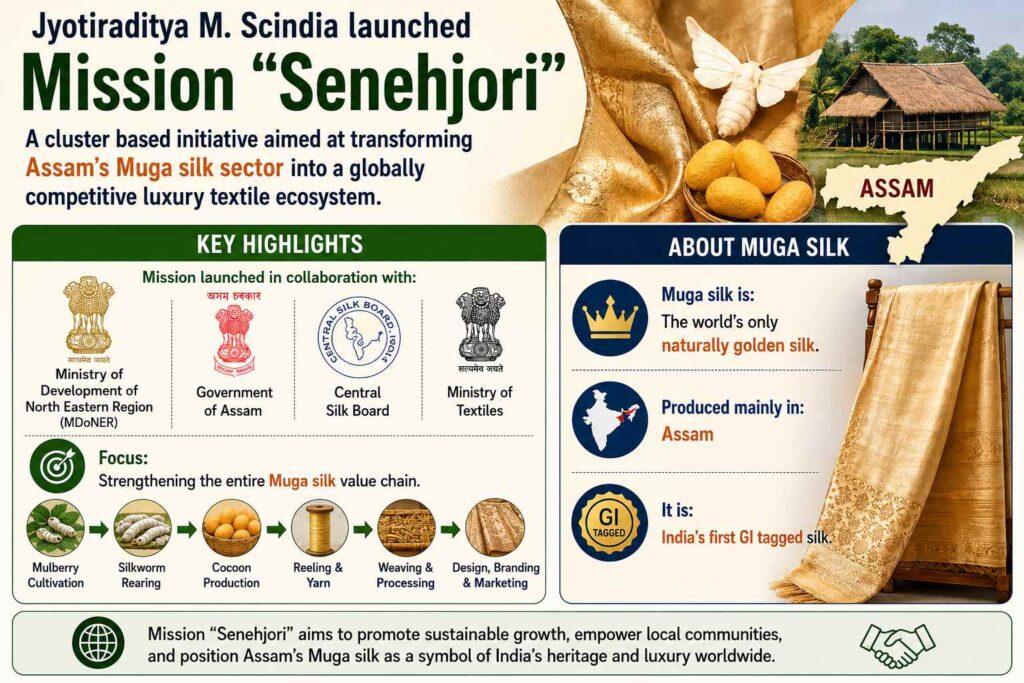
Jyotiraditya M. Scindia launched Mission “Senehjori”, a cluster-based initiative aimed at transforming Assam’s Muga silk sector into a globally competitive luxury textile ecosystem.
Key Highlights
Mission launched in collaboration with:
Ministry of Development of the North-Eastern Region
Government of Assam
Central Silk Board
Ministry of Textiles.
Focus: Strengthening the entire Muga silk value chain.
About Muga Silk
Muga silk is: The world’s only naturally golden silk.
Produced mainly in: Assam
It is India’s first GI tagged silk.
Geographical Indication (GI)Tag
A tag given to products originating from a specific geographical region.
Indicates:
Unique quality
Reputation
Traditional characteristics.
Major Objectives of Mission Senehjori
Promote: Global branding of Assam Muga silk.
Improve:
Export potential
Traceability
Quality assurance.
Increase incomes of:
Rearers
Weavers
Artisans.
Cluster-Based Approach
Mission covers major Muga silk districts:Jorhat, Sivasagar, Lakhimpur, Dhemaji, Dibrugarh, Tinsukia, Majuli, and Sualkuchi.
[2018] India enacted The Geographical Indications of Goods (Registration and Protection) Act, 1999 in order to comply with the obligations to
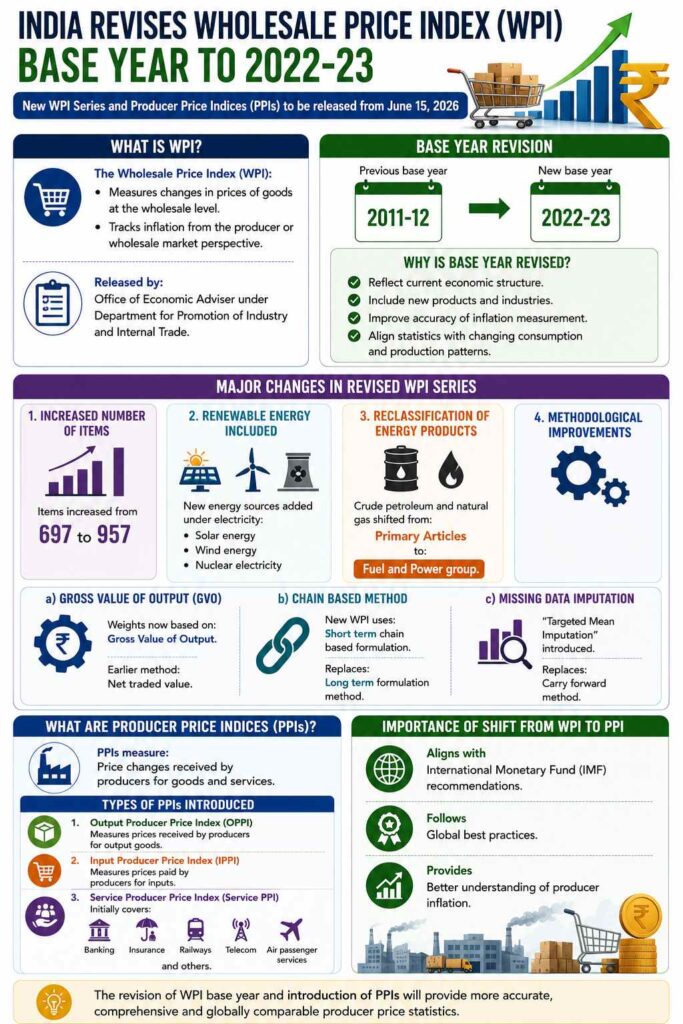
The Government of India has revised the base year of the Wholesale Price Index (WPI) from 2011-12 to 2022-23. The revised WPI series and new Producer Price Indices (PPIs) will be released from June 15, 2026.
What is WPI?
The Wholesale Price Index (WPI):
Measures changes in prices of goods at the wholesale level.
Tracks inflation from the producer or wholesale market perspective.
Released by:
Office of Economic Adviser under the Department for Promotion of Industry and Internal Trade.
Base Year Revision
Previous base year: 2011-12.
New base year: 2022-23.
Why is Base Year Revised?
Base year revision helps:
Reflect current economic structure.
Include new products and industries.
Improve accuracy of inflation measurement.
Align statistics with changing consumption and production patterns.
Major Changes in Revised WPI Series
Increased Number of Items
Items increased from: 697 to 957.
Renewable Energy Included
New energy sources added under electricity:
Solar energy
Wind energy
Nuclear electricity
What are Producer Price Indices (PPIs)?
PPIs measure: Price changes received by producers for goods and services.
How is PPI connected to WPI?
WPI is essentially a traditional form of producer price measurement for goods.
PPI expands the scope of WPI by:
including services,
measuring both input and output prices,
capturing production stage inflation more accurately.
India’s revised WPI and introduction of PPI indicate a gradual transition toward a modern producer inflation framework.
Components Linking WPI and PPI
1. Output Producer Price Index (OPPI)
Similar to WPI because it measures prices received by producers for selling goods.
WPI can be viewed as partially comparable to OPPI for goods.
2. Input Producer Price Index (IPPI)
Measures prices paid by producers for raw materials, fuel, machinery, etc.
WPI does not capture this aspect separately.
3. Service PPI
Completely absent in WPI.
Covers sectors like banking, telecom, insurance, railways, aviation.
[2020] Consider the following statements: 1. The weightage of food in the Consumer Price Index (CPI) is higher than that in the Wholesale Price Index (WPI). 2. The WPI does not capture changes in the prices of services, which the CPI does. 3. The Reserve Bank of India uses WPI as its key measure of inflation to decide changes in policy rates. Which of the statements given above is/are correct?
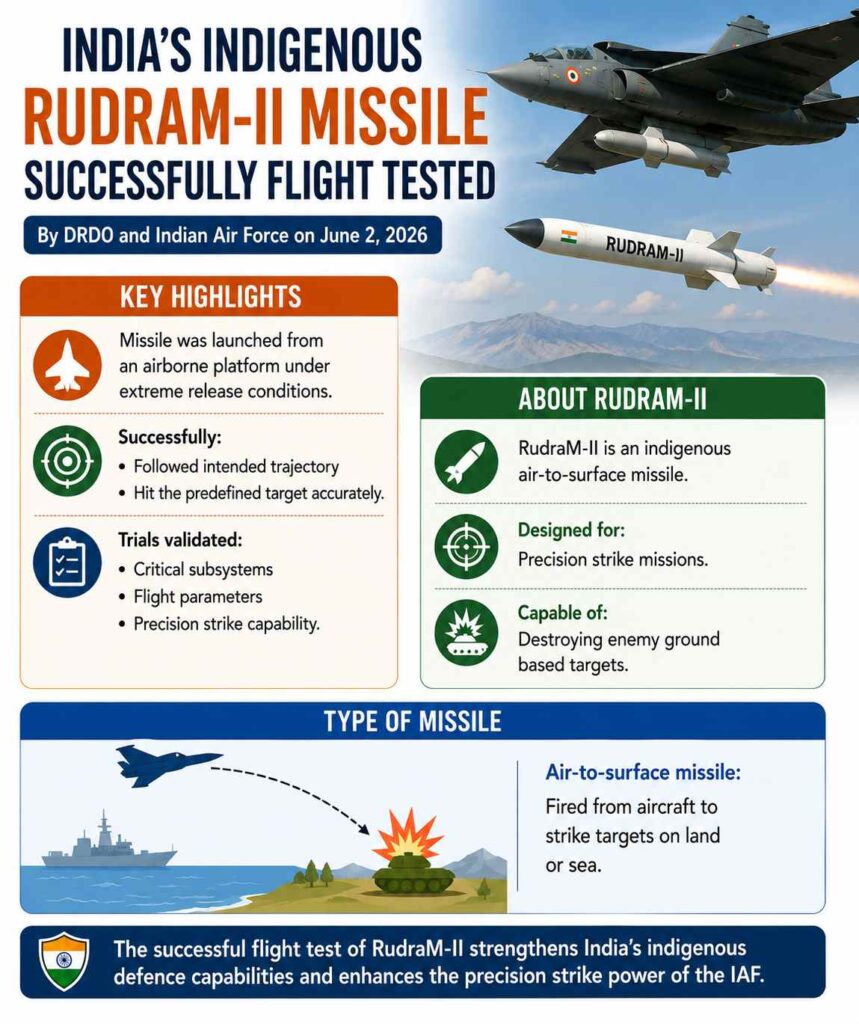
Defence Research and Development Organisation and the Indian Air Force successfully flight tested the indigenous RudraM-II air-to-surface missile on June 2, 2026.
Key Highlights
Missile was launched from: An airborne platform under extreme release conditions.
Successfully:
Followed intended trajectory
Hit the predefined target accurately.
Trials validated:
Critical subsystems
Flight parameters
Precision strike capability.
About RudraM-II
RudraM-II is an indigenous air-to-surface missile.
Designed for Precision strike missions.
Capable of destroying enemy ground-based targets.
[2023] Consider the following statements 1. Ballistic missiles are jet-propelled at subsonic speeds throughout their fights, while cruise missiles are rocket-powered only in the initial phase of fight. 2. Agni-V is a medium-range supersonic cruise missile, while BrahMos is a solid-fuelled intercontinental ballistic missile. Which of the statements given above is/are correct?
PYQ Relevance[UPSC 2022] How will I2U2 (India, Israel, UAE and USA) grouping transform India’s position in global politics?Linkage: The question focuses on emerging minilateral partnerships involving India, Israel and Gulf countries, which form the geopolitical foundation of IMEC. IMEC is the economic and connectivity manifestation of the same India-Middle East strategic architecture represented by I2U2.
Mentor’s Comment
The recent Iran-Israel conflict has renewed attention on the India-Middle East-Europe Economic Corridor (IMEC) by exposing the vulnerability of global trade routes such as the Strait of Hormuz and the Suez Canal. While the conflict strengthens the strategic case for alternative connectivity corridors like IMEC, it has simultaneously delayed the project’s implementation due to growing instability across West Asia.
What is India-Middle East-Europe Economic Corridor (IMEC)?
It is a planned multimodal transport and infrastructure network designed to connect India, the Arabian Gulf, and Europe.
Formalised via a Memorandum of Understanding (MoU) signed at the G20 Summit in New Delhi, the initiative aims to create a highly efficient ship-to-rail transit system.
It acts as a transparent, sustainable, and debt-free alternative to China’s Belt and Road Initiative (BRI) while significantly reducing the global reliance on traditional maritime chokepoints like the Suez Canal.
How Has the Iran-Israel Conflict Exposed the Vulnerability of Existing Global Trade Routes?
Military Vulnerability: The conflict challenged assumptions regarding technological and military superiority as guarantees of strategic success.
Aircraft Losses: Reports indicate that 42 U.S. aircraft were reportedly lost or damaged during “Operation Epic Fury.”
Missile Defence Stress: More than half of the inventories of Patriot, THAAD and Terminal High Altitude Area Defence interceptors were reportedly expended.
Asymmetric Warfare: Iranian missile and drone capabilities imposed substantial costs on technologically superior adversaries.
Trade Route Fragility: The conflict highlighted how disruptions in strategic chokepoints can generate global economic consequences.
Hormuz Significance: Nearly 20 million barrels of crude oil move through the Strait of Hormuz every day.
Global Share: The strait carries roughly one-third of global seaborne oil supplies.
India’s Exposure: India imports around 88% of its crude oil requirements, making it highly vulnerable to disruptions.
Economic Impact: Even temporary blockades can increase freight costs, insurance premiums, and energy prices globally.
Why Has IMEC Gained Strategic Importance After the Conflict?
Connectivity Diversification: Provides alternatives to vulnerable maritime chokepoints.
Supply Chain Resilience: Reduces excessive dependence on the Suez Canal and Strait of Hormuz.
Strategic Redundancy: Creates multiple transportation pathways during geopolitical crises.
Economic Security: Enhances reliability of trade flows between India, West Asia and Europe.
Geopolitical Necessity: Demonstrates the need for trade corridors that avoid conflict-prone regions.
Regional Integration: Links major production centres, consumption markets and logistics hubs.
What is the Structure and Design of IMEC?
Eastern Corridor
India-UAE Linkage: Connects India to West Asia through maritime routes linked with the UAE.
Gateway Function: Serves as the entry point of the corridor into the Arabian Peninsula.
Central Corridor
Transit Route: Passes through UAE, Saudi Arabia, Jordan and Israel.
Haifa Terminus: Ends at the Israeli port of Haifa on the Mediterranean coast.
Multimodal Connectivity: Integrates ports, railways, logistics facilities and customs infrastructure.
Western Corridor
European Connection: Links Haifa to European ports through Mediterranean maritime routes.
Market Access: Facilitates faster movement of goods into European markets.
Infrastructure Components
Rail Networks: Ensures seamless cargo movement across West Asia.
Ports and Logistics: Strengthens multimodal transport efficiency.
Energy Corridors: Supports electricity transmission and hydrogen trade.
Digital Connectivity: Includes high-speed data cables and digital infrastructure.
Green Transition: Integrates renewable energy and green hydrogen networks.
How Does IMEC Compare with Other Connectivity Corridors?
International North-South Transport Corridor (INSTC)
Route Objective: Connects India with Russia and Europe through Iran.
Strategic Purpose: Reduces dependence on the Suez Canal.
Geographic Advantage: Provides shorter transit times to Eurasian markets.
Belt and Road Initiative (BRI)
Chinese Connectivity Model: Links Asia, Africa and Europe through infrastructure projects.
Land Connectivity: Seeks alternatives to maritime chokepoints.
Strategic Competition: Represents China’s connectivity vision, while IMEC serves as an alternative architecture.
IMEC Distinction
Multidimensional Design: Integrates trade, energy, digital and logistics connectivity.
West Asian Focus: Traverses economically significant regions of the Arabian Peninsula.
India-Europe Orientation: Establishes a dedicated connectivity route linking India with Europe.
How Has the Conflict Delayed the Execution of IMEC?
Gaza War Impact: The October 2023 Gaza conflict stalled implementation soon after IMEC’s announcement.
Haifa Disruptions: The corridor’s Mediterranean endpoint became directly affected by regional instability.
Strategic Adaptability: Allows route modifications during crises.
What Role Can India Play in Advancing IMEC?
Connectivity Leadership: Positions India as a major architect of transcontinental connectivity.
Diplomatic Balancing: Maintains strong relations with Saudi Arabia, UAE, Israel and Europe simultaneously.
Economic Integration: Expands trade access to Europe and West Asia.
Strategic Autonomy: Diversifies supply chains beyond traditional routes.
Infrastructure Cooperation: Encourages investments in logistics, digital and energy networks.
India-Europe Engagement: Strengthened by Prime Minister Narendra Modi’s Europe visit in May 2026 and growing India-Europe connectivity cooperation.
Conclusion
The Iran-Israel conflict has reinforced the strategic necessity of IMEC by exposing the vulnerabilities of existing trade routes and energy chokepoints. At the same time, it has highlighted that connectivity projects cannot succeed through infrastructure alone; they require sustained political stability, regional cooperation and strategic trust. The future success of IMEC will depend on its ability to balance commercial objectives with the geopolitical realities of West Asia.