đŸ’„Join UPSC 2027,2028 Mentorship (July Batch) + XFactor Notes & Microthemes PDF

Subject: Climate Change

1. Global Warming and Issues
2. All about Pollution

  • Railways to become Net Zero Carbon Emission Mass Transport by 2030

    A new dawn ushers on Indian Railways as it endeavors to be self-reliant for its energy needs as directed by the Prime Minister and solarise railway stations by utilizing its vacant lands for Renewable Energy (RE) projects.

    Moving towards ‘Net Zero’ Carbon Emission Railways

    • The Ministry of Railways has decided to install solar power plants on its vacant unused lands on mega-scale.
    • The use of solar power will accelerate the mission to achieve a conversion of Indian Railways to ‘Net Zero’ Carbon Emission Railway.
    • Railway Energy Management Company Ltd. (REMCL) is working to further proliferate the use of solar energy on mega scale.
    • It has already floated tenders for 2 GW of solar projects for Indian Railways to be installed on unutilised railway lands.

    Projects along operational railway lines

    • Indian Railways is also adopting an innovative concept of installation of solar projects along operational railway lines.
    • This will help in preventing encroachment, enhancing the speed and safety of trains and reduction of infrastructure costs due to direct injection of solar power into the traction network.
    • With these mega initiatives, Indian Railways is leading India’s fight against climate challenge.
    • These are significant steps towards meeting its ambitious goal of being a net zero carbon emissions organisation and meeting India’s Intended Nationally Determined Contributions (INDC) targets.


  • What is the Arctic Heatwave warming up Siberia?

    The Arctic Circle has recorded temperatures reaching over 38 degrees Celsius in the Siberian town of Verkhoyansk, likely an all-time high. The temperatures seem to have been 18 degree Celsius higher than normal in June a/c to the BBC.

    Try this question from CS Mains 2017:

    Q.How does the Cryosphere affect global climate?

    What is happening in the Arctic?

    • Since the past month, the most above-average temperatures were recorded in Siberia, where they were about 10 degrees Celsius above normal.
    • Siberia has been recording higher-than-average surface air temperatures since January.

    Are Arctic heatwaves common?

    • This is not the first time that rising temperatures in the Arctic have created alarm.
    • The rising temperatures are attributed to large-scale wind patterns that blasted the Arctic with heat, the absence of sea ice, and human-induced climate change, among other reasons.
    • There has been an increase of heatwave occurrences over the terrestrial Arctic. These frequent occurrences have already started to threaten local vegetation, ecology, human health and economy.

    A cause of worry for all

    • Warming in the Arctic is leading to the thawing of once permanently frozen permafrost below ground.
    • This is alarming scientists because as permafrost thaws, carbon dioxide and methane previously locked up below ground is released.
    • These greenhouse gases can cause further warming, and further thawing of the permafrost, in a vicious cycle known as positive feedback.
    • The higher temperatures also cause land ice in the Arctic to melt at a faster rate, leading to greater run-off into the ocean where it contributes to sea-level rise.
  • Revealing the secrets Arctic holds

    This article is about Polarstern, is an icebreaker, which traversed the Arctic Ocean to study the aspects related to ice there. Here, we will look at some of these aspects. These aspects are-monitoring of the ice, difficulty in measuring the thickness, rate of melting of ice and relations with cloud formation.

    Arctic: A recorder and driver of climate change

    How is it a recorder of climate change?

    • It is a recorder because of two co-related factors, these are-
    • 1) The visible difference between ice and water.
    • 2) The obvious relationship between global temperatures and the amount of ice around.
    • Two factors together shows in an easily graspable way how things are changing.
    • The extent of the Arctic sea ice in summer has declined by 30% in the past 30 years, and that loss is accelerating (see chart).

    How is it a driver of climate change?

    • The Arctic is also a driver of climate change, because the whiteness of ice means it reflects sunlight back into space, thus cooling Earth.
    • Whereas the darkness of open water means it absorbs that light.
    • The less of the reflection of sunlight and the more absorption of light will result in a faster rise in global temperatures.

    Monitoring the Arctic’s ice

    • At the moment this is monitored mainly by satellite.
    • Measuring the extent of the Arctic’s ice from space is easy.
    • Measuring its thickness is trickier.
    • From orbit, this is done by a mixture of radar and laser beam.
    • Icesat 2, an American craft, provides laser-altimeter data that record the height above sea level of the top of the snow that overlies the ice.
    •  Cryosat 2, a European one, uses radar to penetrate the snow and measure the height of the top of the ice itself.
    • The thickness of the ice in a particular place can then be calculated by applying Archimedes’ principle of floating bodies to the mixture of ice and snow, and subtracting the thickness of the snow.
    • But there is a view that the data collected by these two satellites may be inaccurate, leading to an overestimation of the ice’s thickness.

    Let’s understand why the data about thickness could be inaccurate

    • When all is working perfectly, the return signal for Cryosat 2 comes exactly from the boundary between the ice and any overlying snow.
    • But, that this is not always what happens.
    • Variables such as layering within the snow, along with its temperature and salinity, might affect the returning radar signal by changing the snow’s structure and density.
    • This could cause the signal to be reflected from inside the snow layer, rather than from the boundary where it meets the ice.
    • If that were happening, it would create the illusion that the ice beneath the snow is thicker than is actually the case.

    How topography of Arctic ice matters

    • Though sea ice is solid, it is not rigid.
    • It forms but a thin skin on the ocean—varying in depth from around 30cm in summer to a couple of metres in winter—so is readily moved by wind and current.
    • As the ice moves it stretches and cracks in some places.
    • Large cracks formed in this way are called leads, because they are wide enough to “lead” a ship.
    • In other places, by contrast, movement makes the ice thicker.
    • As individual panes of ice butt up against each other, they create ridges that can be metres high.
    •  But even from the ship’s deck one can watch leads opening and ridges forming around the vessel.
    • Observations suggest that winter the ice has been particularly mobile—and has thus become particularly rough, with a surprising number of ridges.

    So, how these ridges affect the rate at which ice melts?

    • These ridges may affect the rate at which the ice melts—but to complicate matters, this could happen in two opposing ways.
    • Ridges make ice thicker, and thicker ice melts more slowly.
    • On the other hand, a ridge projects down into the sea as well as up into the air (Archimedes, again), so it may stir up water from below the surface.
    • Deep water is warmer than the surface layer, so this stirring would serve to increase melt rates.
    • Moreover, to add to the confusion, ridges are prone to having pieces of ice fall off them into the sea, to form small blocks known as brash.
    • This brash, having more surface area per unit volume than unbroken ice, melts faster.

    How cloud formation is affected by cracks in Arctic ice

    • On most parts of Earth clouds form as droplets of water condense around “seeds” of dust or organic molecules.
    • In the Arctic, there is little dust.
    • Biological activity, too, is in short supply compared with elsewhere—and is, moreover, conducted mainly below the barrier of the sea ice.
    • It might, therefore, be expected that there would be few seeds present for clouds to form around.
    • And yet, clouds are present.
    • Cloud seeds there tended to be compounds containing sulphur, nitrogen, chlorine, bromine or iodine.
    • Presence of these molecules suggests their link with cracks in the ice sheets.
    • This means that more cracks in the ice sheet could lead to more clouds in the Arctic.
    • What overall effect that might have on the climate is unclear.
    • Summer clouds would reflect sunlight back into space, cooling the planet.
    • Those formed in winter, when the sun is below the horizon, would serve as insulation, warming it.
    •  Two opposite outcomes are possible—or perhaps the net effect will be that they cancel each other out.

    Conclusion

    Properly disentangling the interactions between Arctic ice, atmosphere and ocean life will require data collected across a full year—for the contrast between winter and summer at the poles is greater than anywhere else on the planet.

  • “Assessment of Climate Change over the Indian Region” Report

    The Union Ministry of Earth Sciences (MoES) has released the “Assessment of Climate Change over the Indian Region” Report.

    This newscard discusses a very important concept: the Representative Concentration Pathway (RCP). Note its definition.  It can be directly asked as a statement based on prelims MCQ.

    Highlights of the report

    • Average surface air temperatures over India could rise by up to 4.4 degrees Celsius by the end of the century as compared to the period between 1976 and 2005, according to the MoES report.
    • The rise in temperatures will be even more pronounced in the Hindu Kush-Himalayan region where the average could reach 5.2°C.
    • The region is already highly vulnerable to climate-related variability in temperatures, rainfall and snowfall.
    • By 2100, the frequency of warm days and warm nights might also increase by 55 per cent and 70 per cent respectively, as compared to the period 1976-2005 under the RCP 8.5 scenario.
    • The incidences of heat waves over the country could also increase by three to four times. Their duration of occurrence might also increase which was already witnessed by the country in 2019.

    A 100-year record

    • Between 1900 and 2018, the average temperatures of India rose by 0.7°C.
    • This rise in temperatures has been largely attributed to global warming due to GHG emissions and land use and land cover changes.
    • But it has also been slightly reduced by the rising aerosol emissions in the atmosphere that have an overall cooling characteristic.
    • The report predicts that monsoon rainfall could change by an average of 14 per cent by 2100 that could go as high as 22.5 per cent.
    • The report does not mention if this change will be an increase or a decrease but still represents variability.
    • It further says that the overall rainfall during the monsoon season has decreased by six per cent between 1950 and 2015.

    Data on dry spells

    • The assessment also says that in the past few decades, there has been an increased frequency of dry spells during the monsoon season that has increased by 27 per cent between 1981-2011, as compared to 1951-1980.
    • The intensity of wet spells has also increased over the country, with central India receiving 75 per cent more extreme rainfall events between 1950 and 2015. This means that it either rains too little or too much.
    • One of the primary examples of this was the monsoon seasons of 2018 and 2019 where dry spells were broken by extremely heavy rainfall spells, creating a flood and drought cycle in many regions in India.

    What is Representative Concentration Pathway (RCP)?

    • A Representative Concentration Pathway (RCP) is a greenhouse gas concentration (not emissions) trajectory adopted by the IPCC.
    • It is defined as a radiative force in watt per square metre due to the rising greenhouse gas (GHG) emissions in the atmosphere.
    • Four pathways were used for climate modelling and research for the IPCC Fifth Assessment Report (AR5) in 2014.
    • The pathways describe different climate futures, all of which are considered possible depending on the volume of greenhouse gases (GHG) emitted in the years to come.
    • The RCPs – originally RCP2.6, RCP4.5, RCP6, and RCP8.5 – are labelled after a possible range of radiative forcing values in the year 2100 (2.6, 4.5, 6, and 8.5 W/m2, respectively).
    • Since AR5 the original pathways are being considered together with Shared Socioeconomic Pathways: as are new RCPs such as RCP1.9, RCP3.4 and RCP7.
  • When did CO2 become our planet’s arch enemy?

    Carbon dioxide was always essential for our planet. This newscard discusses when did it become too much.

    Try this question from CSP 2017:

    Q. In the context of mitigating the impending global warming due to anthropogenic emissions of carbon dioxide, which of the following can be the potential sites for carbon sequestration?

    1. Abandoned and uneconomic coal seams
    2. Depleted oil and gas reservoirs
    3. Subterranean deep saline formations

    Select the correct answer using the code given below:

    (a) 1 and 2 only

    (b) 3 only

    (c) 1 and 3 only

    (d) 1, 2 and 3

    GHGs in atmosphere

    • The Earth’s atmosphere is made up of different gases. The temperature of the atmosphere depends on a balance between the incoming energy from the sun and the energy that bounces back into space.
    • Greenhouse gases (GHG) such as carbon dioxide (CO2), methane and nitrous oxide play an important role in the atmosphere.
    • They absorb some of the sun’s heat and release it back in all directions, including back to the atmosphere.
    • Through this process, CO2 and other GHGs keep the atmosphere warmer than it would be without them.
    • However, fossil fuel-run industries and other human activities add GHGs to the atmosphere. This, in turn, increases atmospheric temperature, causing global warming.

    Assessing the carbon level

    • In 1958, American scientist Charles David Keeling calculated the amount of CO2 in our atmosphere.
    • When he started his measurements in 1958, the CO2 levels were around 315 parts per million (PPM).
    • When he died in 2005, the project was taken over by his son Ralph Keeling. By 2014, CO2 levels had increased to about 400 PPM.
    • With his systematic study of atmospheric CO2, Keeling became the first person to alert the world about the increasing levels of CO2 in the atmosphere.

    Reasons for rising CO2 levels

    • Scientists first argued that the increasing release of methane and CO2 was due to agriculture and livestock.
    • But, with the start of the Industrial Revolution in the 18th century, the use of fossil fuels and CO2 levels rose simultaneously.
    • Nations that underwent the Industrial Revolution used huge amounts of fossil fuels and became centres of high CO2 emissions, while nations with an agrarian economy emitted less GHGs.
    • Over the years, as CO2 levels increased, it sparked off debates and arguments between the GHG-emitting rich industrial nations and the victims of global warming — the poorer nations.
  • Will leaders act on the climate crisis as they did Covid-19?

    In the context of climate change, the rising concentration of carbon dioxide and rising global temperature are inextricably linked with each other. This article elaborates on two interlinked and rising curves-CO2 and temperature. The article is concluded on the positive note that leaders would act on climate change with same urgency as Covid.

    The upward journey of two curves

    • Two interrelated curves began their upward trend two centuries ago with the advent of the industrial age.
    • The first curve was the atmospheric concentration of carbon dioxide or, more generally, all greenhouse gases, GHGs.
    • And the second was the average global temperature curve.

    CO2 concentration at 407 ppm: But did we get here?

    • Actually, the CO2 curve began its upward march about 18,000 years ago when it was a little under 200 parts per million (ppm).
    • And earth was much colder back then.
    • By the time it reached 270 ppm about 11,500 years ago, the warmer conditions accompanying this curve made it possible for the emergence of agriculture.
    • Over the past million years, CO2 levels never exceeded 280-300 ppm.
    • They always went back to 200 ppm before rising again in a cyclical fashion.
    • They remained steady at close to 280 ppm for 10,000 years until, beginning in the mid-19th century.
    • They began to rise again as humans burnt coal and oil to fuel the industrial revolution, and burnt forests to expand agriculture and settlements.
    • From a mere 0.2 billion tonnes of CO2 emissions in 1850, annual emissions increased to 36 billion tonnes by 2018.
    • If all this CO2 had accumulated in the atmosphere, we can say that human life would have been altered beyond recognition.
    • Nature has been rather kind to us so far — about one-half of all CO2 emissions have been sanitised from the atmosphere, equally by growing vegetation on land and by absorption in the oceans.
    • Thus, the levels of CO2 in the atmosphere reached 407 ppm in 2018, a level last experienced by earth some three million years ago.

    Global temperature up by 1 degree Celcius

    •  From 1850 onwards, for over a century, the global temperature showed a slight warming trend.
    • But there was nothing suggestive of anything serious.
    • From 1975 onwards, the temperature graph has shown a distinct, upward trend.
    • By 2015, the globe had heated by a full degree Celsius relative to a hundred years previously.
    • Climate modellers unequivocally project that under the current trends of emissions the globe will heat up by 4˚C by the end of the century.
    • he 2003 European heat wave killed over 70,000 people.
    • The years 2015-19 have globally been the warmest years on record.
    • Leave aside the Amazon fire of 2019, the bush fires of 2019-20 in Australia were unprecedented in their scale and devastation.
    • March 2020 has been the second warmest March on record.

    But climate change is not just about temperature rise

    • Climate change involves not just a change in temperature but every other component of weather, including rainfall, humidity and wind speed.
    • Indirect effects follow, such as a rise in sea levels from melting glaciers.
    • Globally there have been several extreme weather events such as hurricanes, heat waves or droughts.
    • While no single event can be directly attributed to climate change, the collective trends are consistent with climate change predictions.

    Warning for India

    • The Climate Impact Lab at the University of Chicago put out a warning for India last year.
    • It says that if global CO2 emissions continue to gallop at the present rate, average summer temperatures would rise by 4˚C in most States.
    • Extremely hot days (days above 35˚C), which were only five days in 2010, would increase to 15 days by 2050 and to 42 days by 2100 on average across all districts.
    • A more moderate emissions scenario, as a result of countries largely fulfilling their commitments under the Paris Agreement, would keep average global temperature rise below 2˚C compared to pre-industrial levels.

    Let’s look into the financial dimension of tackling climate change

    • The most common excuse is that the world cannot afford to curb GHG emissions for fear of wrecking the economy.
    • An article in Nature in 2019 highlighted the financial dimensions of tackling the looming climate crisis.
    • Apparently, the wealthy nations are spending over $500 billion each year internally on projects aimed at reducing emissions.
    • The Intergovernmental Panel on Climate Change, however, estimates that a sustained annual investment of $2.4 trillion in more efficient energy systems is needed until 2035 in order to keep warming below the more ambitious 1.5˚C relative to pre-industrial levels.
    • To put this in perspective, that is about 2.5% of the global GDP.

    What happened to the $100 billion per year aid to poor countries?

    • Some of the wrangling over money relates to the amounts that the wealthy nations, agreed to pay other countries to cope with climate change.
    • Underlying idea was that these countries have caused most of the GHGs resulting in global warming,
    • At the UN Climate Conference in 2009, the richest nations had pledged to provide $100 billion in aid each year by 2020 to the poorer countries for climate change mitigation and adaptation.
    • In 2017, for which data are available, only $71 billion had been provided.
    • And most of the money was spent on mitigation and less than 20% towards climate adaptation.
    • Such numbers had been challenged prior to the 2015 Paris Summit by many countries, including India.
    • It was challenged because much of the so-called aid provided did not come out of dedicated climate funds but, rather, development funds or simply loans which had to be repaid.
    • It thus seems unlikely that the rich countries will deliver $100 billion in tangible climate finance during 2020.

    Time to act

    • COVID-19 has unwittingly given humanity a brief respite from the climate change curve.
    • Commentators are already talking about a paradigm shift in the structure and functioning of societies once the pandemic subsides.
    • This is also a make-or-break moment for the climate trajectory which has to be flattened within a few years if we are to avoid dangerous climate change.
    • Nature’s kindness is not expected to last beyond a 2˚C rise in temperature as the carbon sequestered into vegetation will be thrown back into the atmosphere.
    • Also remember that earth has already warmed by 1˚C and we really have only another 1˚C as a safety margin or 0.5˚C if we are concerned about island nations.

    Consider the mains question asked by the UPSC in 2017-‘Climate change’ is a global problem. How India will be affected by climate change? How Himalayan and coastal states of India will be affected by climate change?

    Conclusion

    There is no substitute to reducing GHG emissions. Technologists, economists and social scientists must plan for a sustainable planet based on the principles of equity and climate justice within and across nations. It is the responsibility of leaders to alter their mindset and act on the looming climate crisis with the same alacrity they have shown on COVID-19.

  • Environment Performance Index 2020

    India has secured 168 ranks in the 12th edition of the biennial Environment Performance Index (EPI Index 2020).

    CSP 2019 has been a year with two questions based on rankings and indices viz. the EoDB index and Global Competitiveness Index.  Note all such indices and their publishing agencies here at  [Prelims Spotlight] Important reports and indexes

    About EPI

    • The EPI measures the environmental performance of 180 countries.
    • It is biennially released by the Yale University.
    • It considers 32 indicators of environmental performance, giving a snapshot of the 10-year trends in environmental performance at the national and global levels.

    The performance on climate change was assessed based on the following indicators —

    • Adjusted emission growth rates;
    • Composed of growth rates of four greenhouse gases and one pollutant;
    • Growth rate in carbon dioxide emissions from land cover;
    • Greenhouse gas intensity growth rate; and
    • Greenhouse gas emissions per capita.

    Performance of the South Asian Region

    • The 11 countries lagging behind India were — Burundi, Haiti, Chad, Solomon Islands, Madagascar, Guinea, CĂŽte d’Ivoire, Sierra Leone, Afghanistan, Myanmar and Liberia.
    • All South Asian countries, except Afghanistan, were ahead of India in the ranking.

    India’s performance

    • A ten-year comparison progress report in the index showed that India slipped on climate-related parameters.
    • India scored below the regional average score on all five key parameters on environmental health, including air quality, sanitation and drinking water, heavy metals and waste management.
    • It has also scored below the regional average on parameters related to biodiversity and ecosystem services too.
    • Among South Asian countries, India was at the second position (rank 106) after Pakistan on ‘climate change’. Pakistan’s score (50.6) was the highest under the category.

    Remarks for India

    • The report indicated that black carbon, carbon dioxide emissions and greenhouse emissions per capita increased in 10 years.
    • India needs to re-double national sustainability efforts on all fronts, according to the index.
    • It needs to focus on a wide spectrum of sustainability issues, with a high-priority to critical issues such as air and water quality, biodiversity and climate change.
  • Aerosols Radiative Effects in the Himalayas

    Indian researchers have found that the effect of anthropogenic aerosols is much higher over the high altitudes of western trans-Himalayas.

    Try this question from CSP 2019:

    Q. In the context of which of the following do some scientists suggest the use of cirrus cloud thinning technique and the injection of sulphate aerosol into the stratosphere?

    (a) Creating the artificial rains in some regions

    (b) Reducing the frequency and intensity of tropical cyclones

    (c) Reducing the adverse effects of solar wind on the Earth

    (d) Reducing the global warming

    What are Aerosols?

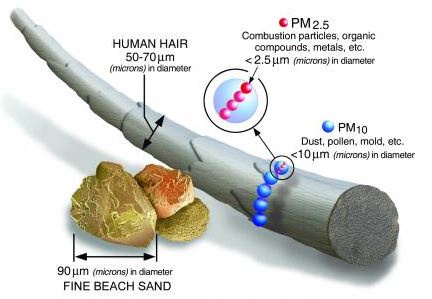
    • An aerosol is a suspension of fine solid particles or liquid droplets in air or another gas.
    • They can be natural or anthropogenic.
    • Examples of natural aerosols are fog, mist, dust, forest exudates and geyser steam. Examples of anthropogenic aerosols are particulate air pollutants and smoke.
    • The liquid or solid particles have diameters typically less than 1 ÎŒm; larger particles with a significant settling speed make the mixture a suspension, but the distinction is not clear-cut.
    • Technological applications of aerosols include dispersal of pesticides, medical treatment of respiratory illnesses, and combustion technology.

    Heat pump over the Himalayas

    • The transport of light-absorbing carbonaceous aerosols and dust from the polluted Indo-Gangetic Plain and desert areas over the Himalayas constitutes a major climatic issue due to severe impacts on atmospheric warming and glacier retreat.
    • This heating over the Himalayas facilitates the “elevated-hat pump” that strengthens the temperature gradient between land and ocean and modifies the atmospheric circulation and the monsoon rainfall.

    Findings of the research

    • The monthly-mean atmospheric radiative forcing of aerosols leads to heating rates of 0.04 to 0.13 C per day.
    • Further, the temperature over the Ladakh region is increasing 0.3 to 0.4 degrees Celsius per decades from the last 3 decades.

    How are aerosols fuelling the heat?

    • The atmospheric aerosols play a key role in the regional/global climate system through scattering and absorption of incoming solar radiation and by modifying the cloud microphysics.

    Assessing the Aerosol potential

    • Despite the large progress in quantifying the impact of different aerosols on radiative forcing, it still remains one of the major uncertainties in the climate change assessment.
    • Precise measurements of aerosol properties are required to reduce the uncertainties, especially over the oceans and high altitude remote location in the Himalayas where they are scarce.
    • Researchers have analysed the variability of aerosol optical, physical and radiative properties and the role of fine and coarse particles in aerosol radiative forcing (ARF) assessment.
    • ARF is the effect of anthropogenic aerosols on the radiative fluxes at the top of the atmosphere and at the surface and on the absorption of radiation within the atmosphere.

    Significance of ARF study

    • A scientific study of aerosol generation, transport, and its properties has important implications in our understanding and mitigation of climate change via atmospheric warming.
    • Aerosols impact the snow and glacier dynamics over the trans-Himalayan region.
    • The results from the study can help better understanding of aerosol effects in view of aerosol-climate implications.
  • ‘Race to Zero’ campaign

    The UN has launched the “Race to Zero” campaign ahead of delayed COP 26 Climate Talks.

    Possible question for prelims:

    The ‘Race to Zero’ campaign often seen in news is related to zeroing: Global Hunger/Carbon Emission/HR violations/None of these.

     ‘Race to Zero’ campaign

    • The campaign aims to codify commitments made via the Climate Ambition Alliance (CAA), which launched ahead of last year’s COP25 in Madrid.
    • It encourages countries, companies, and other entities to deliver structured net-zero greenhouse-gas emission pledges by the time the talks begin.
    • This messaging for the campaign — carried out under the aegis of the UNFCCC— seeks to emphasise the potential for non-state actors to raise climate ambition.
    • The campaign refers to these as ‘real economy actors’, noting they “cover just over half the gross domestic product, a quarter of global CO2 emissions and over 2.6 billion people”.

    About the Climate Ambition Alliance

    • The CAA currently includes 120 nations and several other private players that have committed to achieving zero net greenhouse gas emissions by 2050.
    • Signatories are responsible for 23 per cent of current greenhouse-gas emissions worldwide and 53 per cent of global GDP.

    What Are the Criteria?

    • The minimum criteria for establishing a recognized pledge were developed through dialogues coordinated by Oxford University.
    • The pledges must include a clear net-zero target date no later than 2050, they must also begin immediately and include interim targets.
    • Much like the Paris Agreement itself, the criteria are designed to strengthen over time, but they begin at a level that reflects current best practices.

    Issue over offsetting

    • Offsets are emission-reductions generated outside a company’s own operations, and they are used in both compliance programs to meet mandated emission caps (“cap and trade”) and involuntary programs to reduce a company’s overall impact (voluntary carbon markets).
    • The Race to Zero criteria emphasizes that if offsets are ultimately recognized, they must only be used to neutralize residual emissions that can’t be eliminated internally – at least not immediately.
  • Expansion of the Amery Ice Shelf


    There would be a 24% increase in the expansion of the Amery Ice Shelf (AIS) boundaries in Antarctica by 2021 and another 24 per cent by 2026 from its 2016 positions, the National Centre for Polar and Ocean Research (NCPOR) in Goa has predicted.

    Practice question for mains:

    Q. Discuss the interrelation between Cryosphere and Climate change in context to the melting ice shelves in the Antarctic region.

    Amery Ice Shelf (AIS)

    • The Amery Ice Shelf is a broad ice shelf in Antarctica at the head of Prydz Bay between the Lars Christensen Coast and Ingrid Christensen Coast.
    • It is part of Mac. Robertson Land.
    • The name “Cape Amery” was applied to a coastal angle mapped on February 11, 1931.
    • The AIS is one of the largest glacier drainage basins in the world, located on the east coast of Antarctica, at about 70ÂșS Latitude, 70ÂșE Longitude.
    • The AIS dynamics and mass balance help in understanding the changes in the global climate scenario.

    Significance of the study

    • NCPOR observations revealed a critical cooling of the sea surface temperature, resulting in an advancement of the ice shelf by 88 per cent in the past 15 years.
    • These changes would contribute in a major way to climate variability.
    • The study clearly demonstrated the future dynamism of ocean heat fluctuation and Antarctic Amery ice shelf mass shifting-extent.

    Back2Basics: Ice Shelves

    • The floating sheets of ice called ‘ice shelves’ play a multi-faceted role in maintaining the stability of a glacier. Ice shelves connect a glacier to the landmass.
    • The ice sheet mass balance, sea stratification, and bottom water formation are important parameters for the balancing of a glacier. Latent and sensible heat processes do play important roles here.
    • The insulation of ice shelves from atmospheric forcing is dependent on a temperature gradient that the ocean cavity beneath the ice shelves provides.
    • It is the pressure exerted by the ice shelves upon the ocean cavity that determines this temperature gradient.