💥Join UPSC 2027,2028 Mentorship (July Batch) + XFactor Notes & Microthemes PDF

Subject: Climate Change

1. Global Warming and Issues
2. All about Pollution

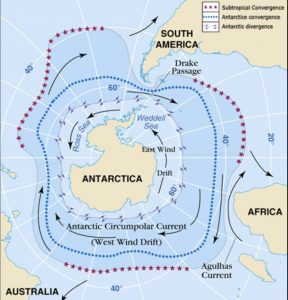
  • Southern Ocean  

    Why in the News?

    Scientists have found that the Southern Ocean mitigates global surface warming by absorbing a large share of carbon released by human activities.

    About the Southern Ocean

    • Also known as the Antarctic Ocean
    • Fourth largest ocean by surface area
    • Described by the International Hydrographic Organisation as the southernmost part of the World Ocean

    Formation and Geological History

    • Formed around 34 million years ago
    • Resulted from the separation of Antarctica and South America
    • Opening of the Drake Passage allowed free circumpolar water flow
    • This isolation contributed to Antarctic cooling and ice sheet formation

    Role of the Southern Ocean

    Climate Regulation

    • Absorbs large amounts of atmospheric carbon dioxide
    • Takes up excess heat generated by global warming
    • Acts as a major carbon sink

    Global Ocean Circulation

    • Drives large scale circulation of ocean waters
    • Influences heat and nutrient distribution worldwide
    • Plays a role in deep water formation

    Sea Ice Dynamics

    • Seasonal expansion and retreat of sea ice affects albedo
    • Influences global climate feedback mechanisms

    Prelims Pointers

    • Southern Ocean surrounds Antarctica completely
    • Antarctic Circumpolar Current has no continental barrier
    • Drake Passage is key to global ocean circulation
    • Southern Ocean absorbs both heat and carbon dioxide
    • Crucial for long term climate stability
    [2011] Westerlies in the southern hemisphere are stronger and persistent than in the northern hemisphere. Why? 

    1. Southern hemisphere has less landmass as compared to northern hemisphere. 

    2. Coriolis force is higher in southern hemisphere as compared to northern hemisphere. 

    Which of the statements given above is/are correct? 

    (a) 1 only (b) 2 only (c) Both 1 and 2 (d) Neither 1 nor 2

  • White Spot Disease

    Why in the News?

    • The Minister of Fisheries, Animal Husbandry and Dairying informed the Rajya Sabha about White Spot Disease

    About White Spot Disease

    Highly contagious viral disease
    • Affects crustaceans such as prawns, yabbies, and crabs
    • Causes mass mortality in shrimp aquaculture

    Causative Agent

    White Spot Syndrome Virus (WSSV)
    Double stranded DNA virus
    Genus: Whispovirus
    Family: Nimaviridae

    Host Range

    All decapod crustaceans belonging to order Decapoda
    • Includes prawns, shrimps, lobsters, and crabs
    • Occurs in marine, brackish, and freshwater environments

    Mode of Transmission

    Vertical transmission
    From infected brood stock to post larvae
    Horizontal transmission
    Through carrier animals
    By cannibalism of infected organisms

    Geographical Distribution

    • Reported from Bangladesh and eastward from India

    Among the following organisms, which one does not belong to the class of other three? (2014)

    (a) Crab 

    (b) Mite 

    (c) Scorpion 

    (d) Spider

  • Climate change, deforestation worsened impact of SE Asia cyclones

    Introduction

    Rising global temperatures, deforestation, and rapid urbanisation have significantly intensified the flood impacts of tropical cyclones across Sri Lanka, Malaysia, Indonesia, and Thailand. Recent cyclones such as Dithawru and Senyar produced rainfall and flooding far exceeding historical norms, marking a shift from cyclical monsoon flooding to extreme, compound climate disasters.

    Why in the News

    A new attribution study by the World Weather Attribution (WWA) group establishes that climate change, land-use change, and urban expansion together amplified cyclone-induced floods in Southeast Asia to unprecedented levels. Cyclone Senyar made landfall in Indonesia and Malaysia on November 26-27, while Dithawru struck Sri Lanka earlier in November, causing extensive damage and over 1,600 deaths. The study highlights rainfall intensities rising up to 160% in Sri Lanka and 50% in Malaysia compared to pre-industrial baselines, underscoring a structural climate shift rather than isolated weather anomalies.

    Escalating Cyclone Rainfall in a Warming Climate

    1. Global Temperature Rise: Increases atmospheric moisture-holding capacity as temperatures have risen by 1.3°C since the mid-1800s.
    2. Moisture Amplification: Each 1°C rise enables the atmosphere to hold 7% more moisture, intensifying rainfall.
    3. Cyclone Energy Supply: Elevated sea surface temperatures in the North Indian Ocean provided additional latent heat for cyclone formation.
    4. Rainfall Extremes: Five-day rainfall events in Sri Lanka intensified by 160%, while extreme rainfall in Malaysia increased by 50%.

    Sea Surface Temperature Anomalies and Storm Intensification

    1. Above-Normal SSTs: Sea surface temperatures during Cyclone Senyar were 0.2°C higher than the 1991-2020 average.
    2. Storm Development: Warmer oceans increased evaporation rates, strengthening storm systems and prolonging rainfall duration.
    3. Frequency Shift: The study identifies a rise in extreme rainfall frequency rather than mere intensity spikes.

    Deforestation as a Flood Multiplier

    1. Forest Cover Decline: Sri Lanka lost 90% of forest cover between 1900 and 2020.
    2. Hydrological Impact: Reduced infiltration and increased surface runoff amplified landslides and flash floods.
    3. Human Impact: Rainfall-induced landslides in Sri Lanka caused over 600 deaths.
    4. Indonesia Case: Nearly 25% of old-growth forests on palm oil plantations were cleared between 1991 and 2020, reducing natural flood buffers.

    Rapid Urbanisation and Exposure Expansion

    1. Population Exposure: Rising numbers of people reside in high-intensity flood-risk zones across Sri Lanka and Indonesia.
    2. Infrastructure Stress: Roads, railways, and cropland expansion increased surface sealing and runoff velocity.
    3. Flood Pathways: Inadequate drainage and altered land gradients intensified urban flooding during Cyclone Senyar.

    Flood Impacts Beyond Rainfall

    1. Economic Losses: Sustained economic losses estimated between $6-7 billion, equivalent to 3-5% of GDP in affected regions.
    2. Agricultural Damage: More than 137,000 acres of agricultural land damaged due to floods and infrastructure failures.
    3. Secondary Hazards: Flooding triggered dam breaches, canal destruction, and landslides, compounding disaster severity.

    Attribution Science and Policy Significance

    1. Event Attribution: Confirms climate change as a decisive factor in amplifying rainfall and flood impacts.
    2. Shift in Disaster Pattern: Floods no longer limited to monsoon cycles but increasingly driven by short-duration extreme events.
    3. Policy Gap: Highlights inadequate land-use planning and ecosystem protection in climate adaptation strategies.

    Conclusion

    The study establishes that cyclone disasters in Southeast Asia are no longer episodic weather events but outcomes of sustained climate warming, ecological degradation, and unplanned urban growth. Addressing future flood risks requires integrating climate mitigation, forest conservation, and land-use planning into disaster governance frameworks.

    PYQ Relevance

    [UPSC 2023] The Intergovernmental Panel on Climate Change (IPCC) has predicted a global sea level rise of about one metre by AD 2100. What would be its impact in India and the other countries in the Indian Ocean region? 

    Linkage: The article reinforces IPCC projections by showing how warming oceans and climate change amplify coastal flooding risks in the Indian Ocean region. Sea-level rise acts as a risk multiplier, intensifying cyclone impacts, floods, and ecosystem loss in India and neighbouring countries.

  • Are methane emissions in India being missed?

    Introduction

    Methane is a short-lived but highly potent greenhouse gas, with 84-86 times the warming impact of CO₂ over 20 years. India is among the world’s largest methane emitters, primarily from waste, agriculture, and fossil fuel systems. However, weak monitoring systems, infrequent data updates, and reliance on modelling assumptions have led to substantial underestimation of actual emissions.

    Why in the News?

    Satellite datasets have, for the first time, revealed that methane emissions from Indian landfills, oil and gas infrastructure, and urban waste sites are significantly underreported, sometimes by a factor of ten. This challenges long-standing inventory-based estimates and highlights a systemic gap between ground reporting and atmospheric reality, making methane a missed but high-impact climate mitigation opportunity.

    Why is methane a critical climate concern for India?

    1. High Global Warming Potential: Methane traps significantly more heat than carbon dioxide in the short term, accelerating near-term warming.
    2. Multi-sectoral Sources: Emissions arise from landfills, wastewater, oil and gas leaks, and organic waste decomposition.
    3. Urban Climate Impact: Large cities generate concentrated methane hotspots due to unmanaged solid waste.
    4. Policy Leverage: Rapid methane reduction delivers faster climate benefits than long-term CO₂ mitigation.

    How have satellite observations changed methane assessment?

    1. Independent Measurement: Satellites measure atmospheric methane directly, bypassing assumptions used in inventories.
    2. High Spatial Resolution: New platforms identify emissions down to individual landfills and infrastructure sites.
    3. First-of-its-Kind Evidence: Indian sites show emissions up to 10x higher than reported estimates.
    4. Comparative Accuracy: Satellite data highlights discrepancies between national inventories and real emissions.

    What gaps exist in India’s current methane inventories?

    1. Model-Based Estimates: Inventories rely on default emission factors and outdated waste generation data.
    2. Infrequent Updates: Sector-wise methane data is updated irregularly at national and state levels.
    3. Source Aggregation: Individual hotspots are masked under regional averages.
    4. Limited Ground Validation: Physical measurement is rare due to cost, logistics, and technical complexity.

    What do case studies from Indian cities reveal?

    1. Delhi (Bhalswa Landfill): Satellite data showed emissions nearly 10 times higher than older estimates.
    2. Mumbai: Emissions from urban waste approached ~0.96 million tonnes, far exceeding theoretical calculations.
    3. Ahmedabad: State estimates at 0.73 million tonnes, with Pirana landfill alone emitting ~0.60 million tonnes.
    4. City-Specific Variability: Differences driven by landfill design, waste composition, and management practices.

    Why is landfill methane particularly underestimated?

    1. Waste Heterogeneity: Indian landfills mix organic, plastic, and industrial waste.
    2. Unengineered Dumps: Most sites lack liners, gas capture systems, or leachate control.
    3. Invisible Emissions: Methane leaks remain undetected without advanced monitoring.
    4. Urban Scale: Mega-cities generate continuous methane flows, not episodic spikes.

    What are the limits of satellite-only monitoring?

    1. Attribution Challenges: Satellites detect plumes but not exact causes.
    2. Complex Urban Signals: Dense cities create overlapping emission sources.
    3. Limited Temporal Coverage: Some emissions remain intermittent or weather-dependent.
    4. Need for Integration: Satellite data requires ground verification for enforcement.

    How does integrated monitoring improve governance outcomes?

    1. Targeted Enforcement: Identifies precise leak points for corrective action.
    2. Policy Feedback Loop: Enables rapid response instead of delayed reporting cycles.
    3. Institutional Coordination: Links urban bodies, pollution boards, and climate agencies.
    4. Cost Efficiency: Directs resources toward highest-impact mitigation sites.

    Conclusion

    Methane emissions in India are not merely underestimated but structurally obscured by outdated inventories and weak monitoring frameworks. Satellite detection has exposed a significant mitigation opportunity, particularly in urban waste systems. Integrating satellite data with ground-level governance can transform methane control into one of India’s fastest climate gains.

    PYQ Relevance

    [UPSC 2022]  Discuss global warming and mention its effects on global climate. Explain the control measures to bring down the level of greenhouse gasses which cause global warming in the light of the Kyoto Protocol 1997. 

    Linkage: This PYQ directly links to methane as a high-impact greenhouse gas and tests understanding of non-CO₂ mitigation, where the article highlights systematic underestimation of methane emissions in India and the need for improved monitoring to achieve climate control commitments.

  • India is focusing on PM10 but PM 2.5 is the real threat

    Introduction

    Air pollution in India is no longer episodic or seasonal; it is a structural public health emergency. While global best practices increasingly rely on health-based air quality standards, India’s regulatory architecture continues to emphasise coarser particulate matter (PM10) due to administrative convenience and visible enforcement outcomes. This regulatory bias weakens India’s ability to reduce disease burden, undermines scientific policymaking, and distorts progress assessment under the National Clean Air Programme (NCAP).

    Why in the News?

    A new comparative study by the Sustainable Futures Collaborative (SFC) highlights that India’s air pollution control framework remains disproportionately focused on PM10, while PM2.5, responsible for deeper health damage. remains inadequately addressed. The report is significant because it systematically contrasts India’s regulatory pathway with countries such as China, Mexico, Brazil, Poland, South Korea, and Germany, revealing a structural mismatch between India’s monitoring priorities and the actual toxicity of pollutants. 

    The Scientific Hierarchy of Harm in Particulate Matter

    1. PM2.5 Toxicity: Penetrates deep into the lungs and bloodstream, causing cardiovascular and respiratory diseases.
    2. PM10 Characteristics: Larger particles with lower systemic penetration and comparatively lesser health impact.
    3. Policy Mismatch: Regulatory attention remains fixed on PM10 despite PM2.5 being the primary health risk.
    4. Outcome: Misalignment between pollution control metrics and actual disease burden.

    Regulatory Bias Towards PM10 in India

    1. Monitoring Focus: NCAP progress is measured primarily through PM10 reductions.
    2. Administrative Ease: PM10 reductions are easier to demonstrate through visible actions like road sweeping and construction controls.
    3. Institutional Incentives: City authorities prefer pollutants that show quicker compliance outcomes.
    4. Policy Consequence: PM2.5 mitigation receives limited planning, funding, and enforcement priority.

    Geography and Urban Form as Pollution Amplifiers

    1. Delhi’s Topography: Located on a plateau surrounded by mountains, restricting pollutant dispersion.
    2. Atmospheric Stagnation: Winter inversion traps pollutants close to the ground.
    3. Regional Inflows: Pollutants from surrounding regions add to local emissions.
    4. Result: Structural accumulation of PM2.5 beyond city-level control measures.

    International Regulatory Pathways Compared

    1. China: Transitioned from PM10 to PM2.5 standards after public health pressure; implemented national emission standards and fuel quality upgrades.
    2. Mexico: Introduced health-based air quality standards following judicial and civil society intervention.
    3. Poland: Adopted EU emission norms after civil resistance and local political change.
    4. Common Feature: Strong national regulation, judicial pressure, and health-based standards.
    5. Indian Contrast: Fragmented authority, weak enforcement, and delayed regulatory evolution.

    Institutional Capacity Constraints in India

    1. State Pollution Control Boards (SPCBs): Resource-poor and understaffed.
    2. Monitoring Load: Engineers responsible for air, water, and waste compliance simultaneously.
    3. Outsourcing Dependence: Compliance monitoring outsourced to private agencies, creating conflicts of interest.
    4. Regulatory Gap: Limited accountability and weak on-ground enforcement.

    Monitoring Deficit and Data Blindness

    1. Ground Monitoring: Insufficient real-time PM2.5 monitoring infrastructure.
    2. Compliance Illusion: Cities meet PM10 reduction targets while PM2.5 levels remain hazardous.
    3. NCAP Limitation: PM2.5 reduction not central to non-attainment city evaluation.
    4. Outcome: Policy success measured through incomplete indicators.

    Policy Instruments and Their Limitations

    1. Smog Guns: Symbolic interventions with minimal impact on PM2.5.
    2. Construction Controls: Effective for PM10, marginal for PM2.5.
    3. Road Dust Management: Visibility-driven policy with limited health outcomes.
    4. Structural Failure: Absence of emission source targeting for fine particulates.

    Conclusion

    India’s air pollution strategy suffers not from lack of intent, but from misaligned priorities and weak institutional design. By privileging PM10 over PM2.5, policymakers risk managing visibility rather than mortality. Without a decisive shift towards health-based air quality standards, strengthened monitoring capacity, and PM2.5-centric regulation, India’s pollution control efforts will continue to underperform despite visible compliance gains.

    PYQ Relevance

    [UPSC 2021] Describe the key point of the revised Global Air Quality Guidelines [AQGs] recently released by the World Health Organisation [WHO].How are these different from its last update in 2005? What changes in India’s National Clean Air Programme are required to achieve these revised standards ?

    Linkage: This PYQ directly aligns with the article’s core argument that India’s NCAP remains PM10-centric, whereas WHO AQGs prioritise PM2.5 due to higher health risks. The article provides analytical grounding to argue why India’s air quality framework requires a shift to health-based PM2.5 standards rather than visibility-based PM10 compliance.

  • Gallbladder Cancer in the Gangetic Belt 

    Why in the News

    • New analysis calls gallbladder cancer (GBC) an “invisible epidemic” in India’s Gangetic belt, especially among women.
    • Despite high prevalence, GBC is not a national health priority, poorly monitored, and driven by environmental pollution.

    Key Highlights

    1. High-Burden Geography

    • India accounts for ~10% of global GBC cases.
    • Highest incidence in Uttar Pradesh, Bihar, West Bengal, Assam.

    2. Environmental Drivers

    • Arsenic, cadmium, lead contamination in groundwater.
    • Industrial effluent discharge into rivers.
    • Pesticide residues, adulterated oils, contaminated fish.
    • Chronic exposure through water, food, soil.

    3. Gendered Impact

    • ~70% of GBC patients are women.
    • Factors contributing:
      • Reuse of cooking oil
      • Consumption of unrefrigerated food
      • High exposure to contaminated water during domestic chores
    • 80%+ diagnosed at Stage III/IV, when surgery is not viable.

    4. Socio-Economic Burden

    • Treatment costs ₹8–12 lakh → debt, treatment abandonment.
    • Hotspots overlap with districts having high poverty and poor sanitation.

    5. Governance Failures

    • Cancer registries cover only 10% of the population → clusters remain invisible.
    • Weak enforcement of pollution laws.
    • No mandatory cancer reporting.
    Which of the following can be found as pollutants in the drinking water in some parts of India? (2013)

    (1). Arsenic 

    (2). Sorbitol 

    (3). Fluoride 

    (4). Formaldehyde 

    (5). Uranium 

    Select the correct answer using the codes given below. 

    (a) 1 and 3 only (b) 2, 4 and 5 only (c) 1, 3 and 5 only (d) 1, 2, 3, 4 and 5

  • UNEA-7: Rift Over UNEP’s Medium-Term Strategy and Funding Crunch

    Why in the news?

    The seventh UN Environment Assembly (UNEA-7) begins in Nairobi amid deep divisions over the UN Environment Programme’s (UNEP) Medium-Term Strategy (MTS) 2026–2030 and a significant decline in core funding. The MTS acts as UNEP’s operational mandate guiding global work on climate, biodiversity, pollution and land restoration.

    UPSC Prelims Pointers

    About UNEP

    • Headquarters: Nairobi, Kenya
    • Established: 1972 (Stockholm Conference outcome)
    • Governing body: UN Environment Assembly (UNEA)
    • Works on: climate, biodiversity, pollution, land, chemicals, resource efficiency, environmental governance.

    About UNEA

    • Meets biennially.
    • World’s highest-level decision-making body on environment.
    • Each member state of the UN has one vote.

    UNEP’s Environment Fund (EF)

    • Voluntary, but based on an indicative scale of contributions.
    • Provides core, unearmarked funding.
    • Decline in EF impacts UNEP’s operational independence.

    Medium-Term Strategy (MTS)

    • 5-year framework guiding programmatic priorities.
    • Needed for budget approval.
    • Current debate concerns the 2026–2030 MTS text.

    Triple Planetary Crisis

    • Climate change
    • Biodiversity loss
    • Pollution and waste

    Plastics Treaty Process

    • Negotiated under the Intergovernmental Negotiating Committee (INC).
    • UNEP serves as secretariat, but mandate expansion is contested.
    Which one of the following is associated with the issue of control and phasing out of the use of ozone-depleting substances? (2015)

    (a) Bretton Woods Conference 

    (b) Montreal Protocol 

    (c) Kyoto Protocol 

    (d) Nagoya Protocol

  • Why pollution affects north Indian cities more than south and west

    Introduction

    Over 2015-2025, no northern Indian city recorded “safe” air quality even once, with Delhi emerging as the most polluted city. In contrast, cities in the south and west maintained comparatively better AQI levels. This consistent divergence reflects entrenched geographical, meteorological, and structural constraints that trap pollutants in the Indo-Gangetic Plain while aiding dispersion along the coasts.

    Why in the news

    A new assessment titled Air Quality Assessment of Major Indian Cities (2015-2025) reported that Delhi continues to be the most polluted city, with AQI stagnating at unhealthy levels. The study shows sharp regional contrasts, revealing that only southern and western cities showed sustained air quality improvements, making this a significant environmental governance concern.

    Persistent Regional Air Quality Divide

    Why northern cities remain severely polluted

    1. Consistent high pollution: Northern cities experienced prolonged severe pollution episodes across the decade.
    2. Limited “healthy days”: None recorded AQI within safe thresholds in 2025.
    3. Stagnant improvement: Even when AQI dipped (e.g., 2019), levels remained far above healthy limits.

    How southern and western cities compare

    1. Cleaner AQI bands: Chennai, Chandigarh, Visakhapatnam, and Mumbai maintained AQI between 80-140.
    2. Steady progress: These cities displayed clear improvements between 2015-2025.
    3. Best performer: Bengaluru recorded the best AQI among all 11 cities.

    Why Delhi Emerges as the Worst Performer

    Data trends

    1. Peak AQI: Delhi saw its worst AQI in 2016 (over 250).
    2. Temporary dips: AQI improved in 2019 but did not meet healthy standards.
    3. Current status: AQI stagnated at 180.5 in 2025, indicating persistent failure to achieve safe limits.

    Structural challenges

    1. Urban surface roughness: Dense built-up surfaces inhibit wind flows and pollutant dispersion.
    2. Trapping effect: Reduced ventilation leads to prolonged retention of pollutants.

    Why Secondary Northern Cities Remain Highly Polluted

    Cities in focus: Lucknow, Varanasi, Ahmedabad, and Pune showed:

    1. Prolonged elevated AQI: Frequent high pollution days with slow improvement.
    2. Mixed progress: Improvements after 2019, but still above healthy limits.
    3. Heavy pollutant load: Emissions + weak dispersion exacerbate poor quality.

    Why Southern & Western Cities Perform Better

    1. Favourable winds: Sea breezes in coastal cities aid pollutant dispersal.
    2. Better atmospheric ventilation: Stronger monsoon winds and less winter stagnation.
    3. Urban characteristics: Less surface roughness compared to Delhi’s dense built-up terrain.

    Outcome

    1. Improved AQI stability
    2. Lower incidence of sharp pollution spikes

    Geography and Winter Inversion: The Deciding Factors

    Geographical lock-in

    1. Indo-Gangetic Basin: Landlocked region bounded by the Himalayas prevents outflow of pollutants.
    2. Pollutant entrapment: Cold northern boundary and flat terrain acts like a “pollution bowl”.

    Winter inversion

    1. Temperature inversion effect: Warm air traps cold, dense air near the surface and this leads to pollutants settling close to ground level.
    2. Seasonal peak: December-February shows intensified pollution due to reduced boundary layer height.

    Built environment factor

    1. Surface roughness: Urban canyons in Delhi slow wind speed, increasing stagnation.

    Seasonal Wind Patterns and Air Dispersion

    Why southern/western cities improve during monsoon

    1. Strong monsoon flows disperse pollutants effectively.
    2. Regular ventilation cycles prevent accumulation.

    Why northern cities worsen in winter

    1. Weak westerly winds
    2. Lower atmospheric mixing height
    3. Persistent fog, cold air trapping, and stagnation

    Conclusion

    The decade-long air quality analysis underscores a structural, region-specific pollution challenge rooted in geography, climate, and urban form. Northern cities, especially those in the Indo-Gangetic Basin, remain trapped in severe winter pollution cycles, while southern and western cities benefit from favourable winds and dispersion conditions. Any meaningful pollution mitigation strategy must therefore be region-sensitive and climatologically informed.

    PYQ Relevance

    [UPSC 2021] Describe the key points of the revised Global Air Quality Guidelines (AQGs) released by the World Health Organisation (WHO). How are these different from its last update in 2005? What changes in India’s National Clean Air Programme are required to achieve these revised standards?

    Linkage: This topic is important for UPSC as it highlights India’s deep regional air-quality disparities and the structural limits of current pollution-control policies. It links directly to GS-3 themes of air pollution, WHO AQGs, NCAP reforms, and the recurring winter inversion-driven smog episodes in north Indian cities.

  • SC ruling on post-facto clearances sets environmental law back by decades

    Introduction

    The Environmental Impact Assessment (EIA) is a preventive system requiring environmental clearance before a project begins. In 2025, the Supreme Court’s Vanashakti judgment banned all post-facto clearances as unconstitutional. In a new 2:1 ruling, the Court has now recalled that decision, warning that continuing the ban would cause “devastating” consequences and jeopardise major public investments. This marks a clear shift away from earlier strictures on environmental approvals.

    Why in the news?

    The Supreme Court’s recent endorsement of post-facto environmental clearances marks a sharp break from earlier rulings where such permissions were held illegal. For the first time, industries operating without prior approval may regularise their violations by paying penalties. This undermines the preventive purpose of Environmental Impact Assessments (EIAs), weakens compliance in a country already facing severe pollution challenges. The ruling enables violators to bypass mandatory safeguards like public hearings and ecological assessments, allowing large-scale industries to operate first and seek approval later.

    Understanding Ex Post Facto Environmental Clearances

    Meaning and Basic Idea

    • Retrospective approvals: Permissions granted after a project has already started construction, expansion, or operation without the mandatory prior Environmental Clearance (EC).
    • Departure from preventive logic: Converts a forward-looking safeguard into a mechanism to regularise completed violations.

    Intended Purpose: Rare exceptions: Initially justified only for unusual situations where procedural lapses occurred without deliberate violation.

    Actual Use: Regularisation tool: Gradually used to “legalise” ongoing or completed activities that had bypassed due environmental scrutiny.

    Legal Context

    1. EPA, 1986 as foundation: The Environment (Protection) Act establishes prior approval as the norm for activities affecting the environment.
    2. EIA 1994 & 2006 notifications: Both frameworks emphasise that major projects, industrial, mining, construction, must undergo assessment before commencement.

    Supreme Court’s Stand in the Vanashakti Judgment (2025)

    Key Findings

    1. Invalidation of government provisions: Struck down specific notifications and office memoranda that enabled retrospective clearances.
    2. Violation of environmental principles: Held that such clearances contradict the precautionary principle, which seeks to prevent harm at the outset.

    Judicial Observations

    1. Labelled as serious illegality: The Court stated that post-facto approvals erode environmental rule of law.
    2. Restriction on future permissions: Directed that no further mechanisms be created to enable or replicate retrospective ECs. 

    How Does the Ruling Change India’s Environmental Safeguards?

    1. Shift from Prevention to Regularisation: India’s environmental law is built on prior approval, but the ruling legitimises post-violation approvals. This weakens deterrence and changes the core architecture of environmental governance.
    2. Dilution of Public Hearings: Many industrial activities will now bypass public consultations, one of the most important safeguards under the EIA process.
    3. Weakening of the No-Fault Liability Principle: Earlier, industries operating without clearance faced closure; now they may continue operating after paying monetary penalties.
    4. Increased Environmental Risk: Projects threatening forests, rivers, and air quality gain legal pathways to operate retrospectively, exacerbating existing ecological crises.

    How Has Policy Drift in Recent Years Enabled Post-Facto Approvals?

    1. Draft EIA Notification 2020: Attempted to institutionalise post-facto approvals and reduce public participation, an approach the ruling now indirectly validates.
    2. Forest Conservation Act Amendments (2023): Redefined “forests” to exclude large tracts of land, enabling diversion without scrutiny and bypassing earlier safeguards.
    3. Coastal Regulation Zone (CRZ) Dilution (2018): Relaxed no-development zones and allowed extensive construction in vulnerable coastal areas.
    4. Expansion of Exemptions: Over 45 industrial categories have been exempted from prior clearances in the past decade.
    5. Legalisation of Violations: Historical decisions like TN Godavaraman protected forests strictly, but recent changes enable easier diversion and commercial use.

    Why Is the Ruling Especially Concerning for India’s Current Environmental Crisis?

    1. Extreme Pollution Levels: With 83 of the world’s 100 most polluted cities in India, any weakening of safeguards directly harms public health.
    2. Children’s Health Impact: Delhi’s children lose up to 10 years of lung function, highlighting the urgency of strict compliance.
    3. Carcinogenic Exposure: Farmers in Punjab and Haryana inhale toxic particulates every winter, worsening respiratory health.
    4. Hospital Overload: Urban hospitals deal with chronic respiratory disease surges every winter.
    5. Climate-Driven Disasters: Cyclones, erosion, and floods already strain ecosystems; weaker laws increase vulnerability.

    How Does the Ruling Affect Democratic Accountability?

    1. Reduced Public Participation: By enabling post-facto approvals, the ruling sidelines communities, especially those in pollution-affected regions.
    2. Bypassing Transparency: Industries may avoid public hearings and statutory scrutiny.
    3. Weakening of Citizen Rights: The apex court’s earlier stance held the environment as part of Article 21’s right to life; this shift undermines that framework.
    4. Centralisation of Power: State-level mechanisms become redundant if industries secure clearances retrospectively.

    What Long-Term Risks Does the Judgment Create?

    1. Systematic Legal Erosion: A decade-long pattern of exempting industries and diluting norms is now legitimised judicially.
    2. Encouragement of Violations: Industries may prefer paying a penalty over compliance, cheaper and faster.
    3. Increased Ecological Degradation: Forests, rivers, coasts, and air quality may deteriorate further due to weakened oversight.
    4. Regulatory Capture: Industries gain disproportionate influence over environmental decision-making.
    5. Undermining Global Climate Commitments: India’s commitments under the Paris Agreement require stronger, not weaker, compliance frameworks.

    Conclusion

    The Supreme Court’s endorsement of post-facto clearances marks a turning point in India’s environmental jurisprudence. While the ruling attempts to balance economic development and compliance, it risks normalising illegality and weakening safeguards that exist to protect public health, ecological integrity, and constitutional rights. At a time of worsening pollution and climate vulnerability, India needs stronger, not diluted, environmental governance.

    PYQ Relevance

    [UPSC 2014] What role do environmental NGOs and activists play in influencing Environmental Impact Assessment (EIA) outcomes for major projects in India? Cite four examples with all important details.

    Linkage: With post-facto clearances weakening formal EIA safeguards, NGOs become vital watchdogs ensuring accountability. This topic links directly to environmental governance, EIA dilution, and current judicial-policy debates.

  • How Delhi’s air quality monitors work and why their readings can falter

    INTRODUCTION

    Delhi operates a dense network of 40 Continuous Ambient Air Quality Monitoring Stations (CAAQMS) that serve as automated laboratories tracking eight key pollutants. These stations guide the daily AQI, enable pollution-control measures and emergency responses, and form the backbone of environmental governance. However, recent judicial scrutiny and scientific studies highlight significant gaps in equipment suitability, calibration, meteorological sensitivity, and data reliability, creating a critical governance challenge.

    WHY IN THE NEWS 

    The Supreme Court recently demanded clarity on whether Delhi’s air-quality monitoring equipment is suited to city-specific pollution and meteorological conditions. This scrutiny is significant because Delhi heavily depends on AQI data for health advisories and regulatory actions, yet multiple stations fail to generate adequate, validated data on many days. A CAG report and recent scientific studies show systematic errors, including 30-40% overestimation of PM2.5 under high humidity, raising concerns about the credibility of pollution data itself.

    How Delhi’s Air Quality Monitoring System Functions

    1. CAAQMS Network: Operates 40 automated, temperature-controlled stations functioning as compact laboratories across different city zones.
    2. Regulatory Basis: Functions under CPCB’s 2012 guidelines, which define calibration steps, quality-control procedures, and uniform monitoring standards.
    3. Pollutant Coverage: Tracks eight pollutants, PM2.5, PM10, NO₂, SO₂, CO, O₃, NH₃, Pb, ensuring representative citywide measurement.
    4. Instrumentation Setup: Stations contain racks of analysers, pumps, and data loggers, with sampling inlets mounted on masts above the roof to capture ambient air.

    How Pollutants Are Measured Inside the Stations

    1. Beta Attenuation Monitors (BAM): Use beta ray attenuation to measure particulate concentration by assessing signal weakening through collected particulate mass.
    2. Gaseous Pollutant Monitors: Use optical and chemiluminescent methods, depending on pollutant type, to detect gas behaviour under specific wavelengths.
    3. National Standards: Measurements follow NAAQS procedures, including “gravimetric, wet-chemical and automatic instrument-based techniques” ensuring comparable data across India.

    Factors That Distort or Corrupt Monitoring Readings

    1. Equipment Performance: AQI depends on validated data; CPCB requires 16 hours of reliable data per day for at least three pollutants, including PM2.5 or PM10.
    2. System Failures: Calibration lapses, power outages, and extreme weather cause routine station downtime.
    3. CAG Findings: A report tabled in Parliament revealed several stations failed to generate adequate, valid, real-time data, especially for pollutants like lead, Ammonia, etc.
    4. Location-Based Distortions: Stations placed near buildings, trees, or exhaust vents risk skewed results due to poor dispersion.
    5. Meteorological Disruptions: Severe weather disrupts data transmission, reducing continuity in real-time updates.

    What Scientific Studies Reveal About Measurement Accuracy

    1. Variability with Humidity: CSIR–NPL’s 2021 analysis showed PM2.5 measurements vary with RH, particle mass loading, boundary layer height, and ventilation effects.
    2. Overestimation Threshold: When RH > 60%, BAM monitors exhibited 30-40% overestimation of PM2.5 because water absorption artificially increases mass signal attenuation.
    3. High-Pollution Episodes: Dust-heavy conditions can cause a factor up to 5 underestimation, as heavy loading disturbs air beam pathways.
    4. USEPA Insights: Notes that “high filter loading can lead to flow perturbations,” and “excessive particulate accumulation” disrupts instrument stability.
    5. Recommended Corrections: Scientists recommend site-specific correction factors, which were shown to reduce overestimation errors from 46% to under 2%.

    Why This Issue Matters for Governance and Public Health

    1. Policy Dependence on Data: Emergency actions (GRAP stages, school closures, construction bans) rely on AQI accuracy.
    2. Public Health Impact: Misreporting distorts exposure assessments, health risk communication, and hospital preparedness.
    3. Environmental Justice: Vulnerable groups (elderly, children, labourers) depend on reliable alerts for safe mobility.
    4. Accountability: Data reliability determines CPCB, DPCC and state-level regulatory performance.

    CONCLUSION

    Delhi’s air pollution management depends critically on trustworthy, scientifically robust, and well-maintained monitoring infrastructure. While the city has one of India’s largest automatic monitoring networks, recent judicial scrutiny and scientific findings reveal persistent calibration errors, equipment inconsistencies, and meteorological vulnerabilities. Ensuring accuracy requires standardised maintenance, site-specific correction factors, stronger institutional oversight, and resilient instrumentation capable of performing reliably under Delhi’s complex pollution environment.

    PYQ Relevance

    [UPSC 2021] Describe the key points of the revised Global Air Quality Guidelines (AQGs) released by WHO (2021). How are these different from the 2005 update? What changes in India’s National Clean Air Programme are required to achieve these standards?

    Linkage: The question links directly to GS-III themes of environmental pollution, health-based standards, and regulatory capacity. It is highly relevant as India’s NCAP, NAAQS and AQI-based governance must realign with WHO’s stricter 2021 guidelines to ensure credible monitoring, policy effectiveness, and public health protection.