šŸ’„Join UPSC 2027,2028 Mentorship (July Batch) + XFactor Notes & Microthemes PDF

Subject: Geography

  • Give a geographical explanation of the distribution of off-shore oil reserves of the world. How are they different from the on-shore occurrences of oil reserves?

    Petroleum reserves are found in sedimentary basins, where organic matter is trapped under pressure. Offshore reserves account for ~30% of global crude oil production. Their distribution is linked to continental shelf geology, passive margins, and deep-water basins.

    Geographical distribution

    The Persian Gulf (Middle East)- result of the collision between the Arabian and Eurasian plates, which created perfect “anticline” traps for oil. Eg- Safaniya field (Saudi Arabia), largest offshore oil field in the world.

    The Gulf of Mexico (North America)- It is characterized by salt domes that trap oil in the surrounding porous rock.

    The North Sea (Europe)- Situated between the UK, Norway, and Denmark. This region is a rift basin, with deep depressions where organic matter could settle.

    The South Atlantic Margins (Brazil & West Africa)- formed when South America and Africa drifted apart.

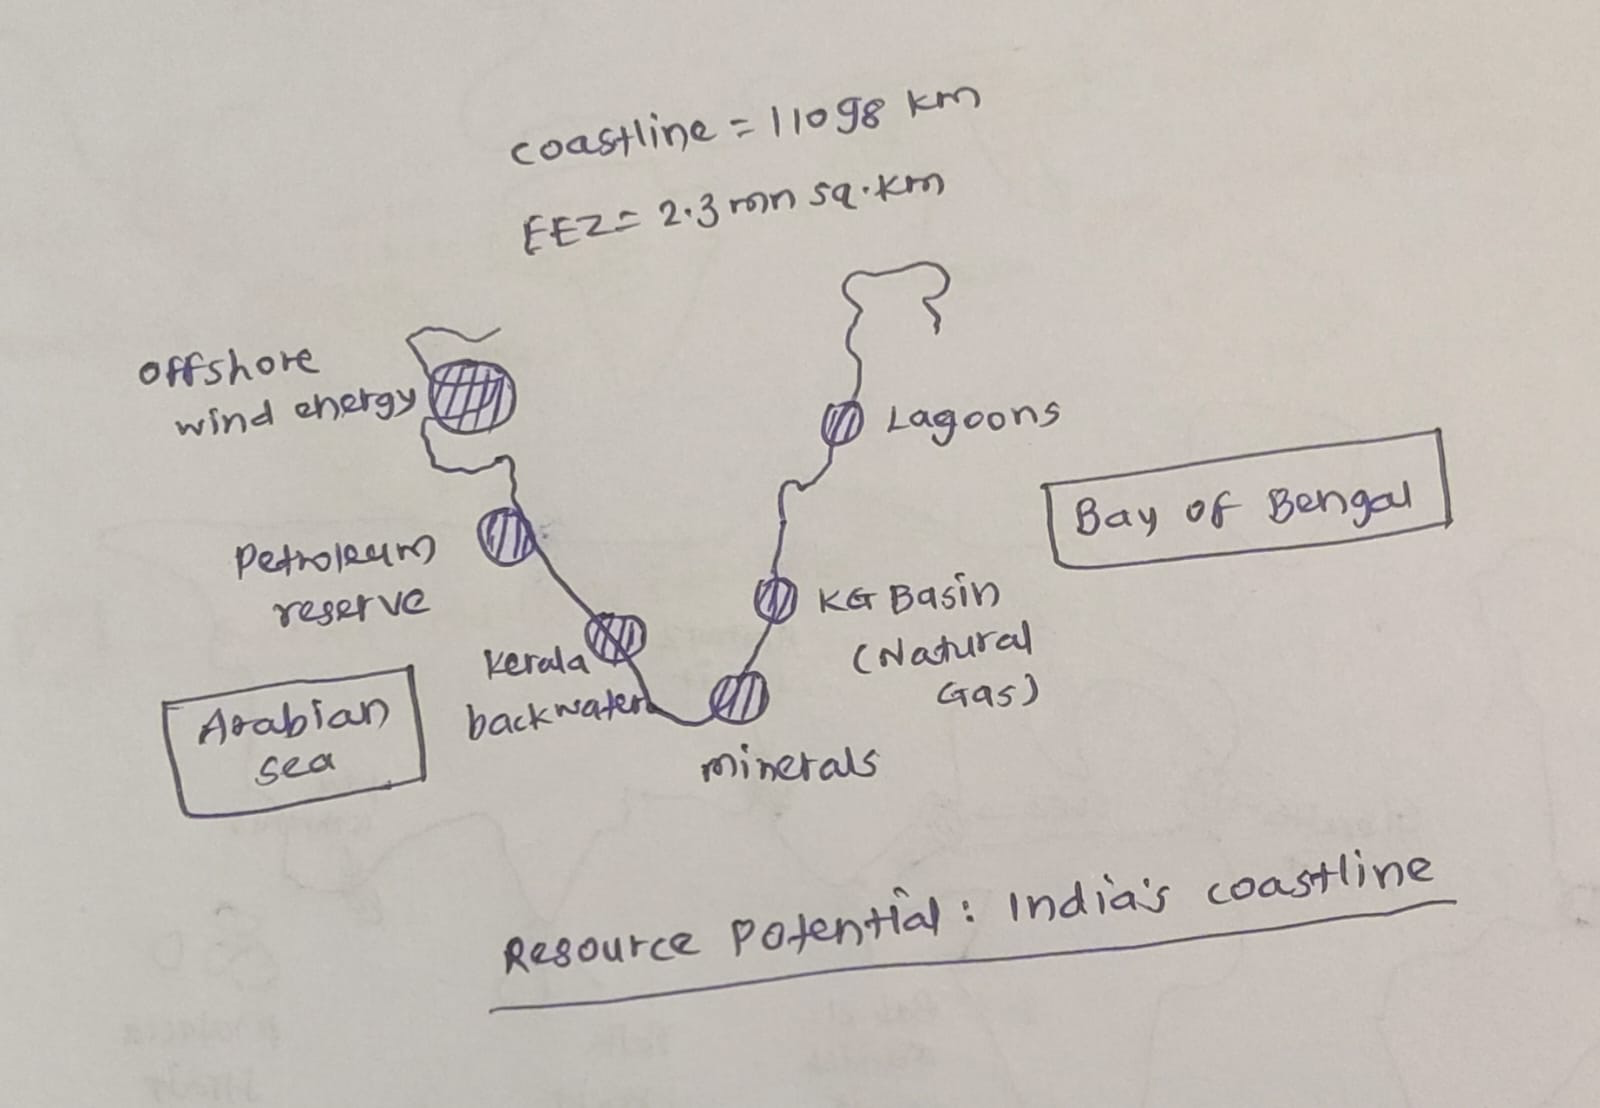
    Southeast Asia & India- in the South China Sea and India’s Mumbai High and Krishna-Godavari (KG) Basin

    Difference between off-shore and on-shore oil reserves

    Implications of uneven distribution of mineral oils in the world

    Energy security challenges – Oil-deficient countries face high import bills and current account deficits. Eg- India imports ~85% of its crude oil requirement.

    Resource Curse in Oil-rich Nations (Paradox of Plenty) – Overdependence on oil leads to limited economic diversification. Eg- Venezuela’s economic crisis.

    Energy trade is one of the key drivers of global geopolitics. Eg- US sanctions on Russian and Iran oil trade

    Competition for oil resources leads to wars and regional instability. Eg- Gulf Wars, Saudi-Iran rivalry.

    Oil-rich regions face oil spills, land degradation, and marine pollution. Eg- Niger Delta pollution.

    Global Carbon Emissions – oil and gas industry is responsible for over 5 billion tonnes of CO2 equivalent in direct emissions annually (15% of total energy-related emissions)

    In the long run, reducing oil dependence through clean energy, strategic reserves, and diversified supply chains is essential for ensuring equitable and sustainable global development.

  • How can Artificial Intelligence (AI) and drones be effectively used along with GIS and RS techniques in locational and areal planning?

    Locational and aerial planning involves selecting optimal sites for infrastructure and managing land use through spatial analysis. The integration of AI, drones, GIS, and Remote Sensing makes planning more efficient, accurate, and sustainable.

    Technological Synergy

    Drones & RS- Satellites provide the macro-view (regional scale), while Drones provide the micro-view (site scale) with high-resolution imagery and LiDAR.

    GIS acts as the central “brain” where all spatial data is layered, stored, and visualized.

    AI processes the massive data from drones/RS to automatically detect patterns, classify land, and predict future trends.

    Role of AI with GIS and RS in Planning

    Automated Land Use Classification- Eg- ISRO’s Bhuvan portal uses AI to automate the Land Use Land Cover (LULC) mapping across India.

    Infrastructure Corridor Optimization- Eg- The PM Gati Shakti platform integrates 200+ GIS layers to plan multi-modal connectivity projects across India.

    Predictive Urban Growth- AI analyzes historical RS data to predict future urban sprawl, helping in proactive zoning.

    Optimal Site Selection for Renewables- AI evaluates GIS layers like slope, solar radiation, and grid proximity to identify high-yield locations.

    Traffic and Mobility Planning- AI analyzes real-time GIS traffic data to optimize the location of new flyovers or metro stations.

    Environmental Risk Assessment- AI simulates flood or landslide scenarios based on RS topographical data to designate “no-build” zones.

    Precision Agriculture Planning- AI analyzes multispectral RS data to determine the best locations for warehouses based on crop yield forecasts. Eg- FASAL project uses AI to forecast district-level yields.

    Illegal Construction Detection- AI compares time-series satellite images to automatically flag unauthorized changes in land use.

    Retail and Logistics Locational Planning- Eg- Amazon and Flipkart use spatial AI to decide the location of “Dark Stores” for 10-minute deliveries.

    Role of Drones with GIS and RS in Planning

    High-Resolution Cadastral Mapping- Drones create centimeter-level accurate maps for property titling.

    3D Digital Twins of Cities- Drones use LiDAR to create 3D replicas of urban areas for detailed architectural planning.

    Real-Time Construction Monitoring- Eg- NHAI has mandated drone surveys for all highway projects to monitor progress.

    Disaster Damage Assessment- In areas inaccessible to RS due to cloud cover, drones provide immediate imagery for relief planning.

    Mining Area Surveillance- Wg- using drones to prevent illegal iron ore mining.

    Coastal Zone Management- Drones map shoreline erosion and mangrove health with high precision for environmental planning.

    Transmission Line Planning- Eg- PowerGrid Corporation of India uses drones for the inspection and locational planning of pylons in hilly terrains.

    Hydrological Planning- Eg- Under the Jal Shakti Abhiyan, drones map micro-watersheds for water conservation planning.

    Challenges

    High initial cost of technology and data processing infrastructure

    Shortage of skilled geospatial and AI professionals

    Data integration issues between multiple agencies due to different formats and standards delay implementation.

    Regulatory restrictions on drone operations

    Data privacy – High-resolution mapping of urban areas raises privacy issues.

    Inadequate real-time data sharing due to low inter-agency coordination

    Lack of decentralised planning capacity at local level – ULBs and PRIs lack funds and functionaries.

    Way Forward

    Implement National Geospatial Policy 2022 for open access and standardised datasets

    Capacity building at state and local levels – Establish district-level geospatial planning units

    Promote public-private partnerships for geospatial infrastructure

    Integrate Bhuvan, Digital India Land Records, and urban GIS databases

    Simplify drone regulations under Drone Rules 2021 for planning use


    These measures can improve evidence-based spatial planning and resource optimisation in India.

    Environmental Geography

  • Discuss the distribution and density of population in the Ganga River Basin with special reference to land, soil and water resources.

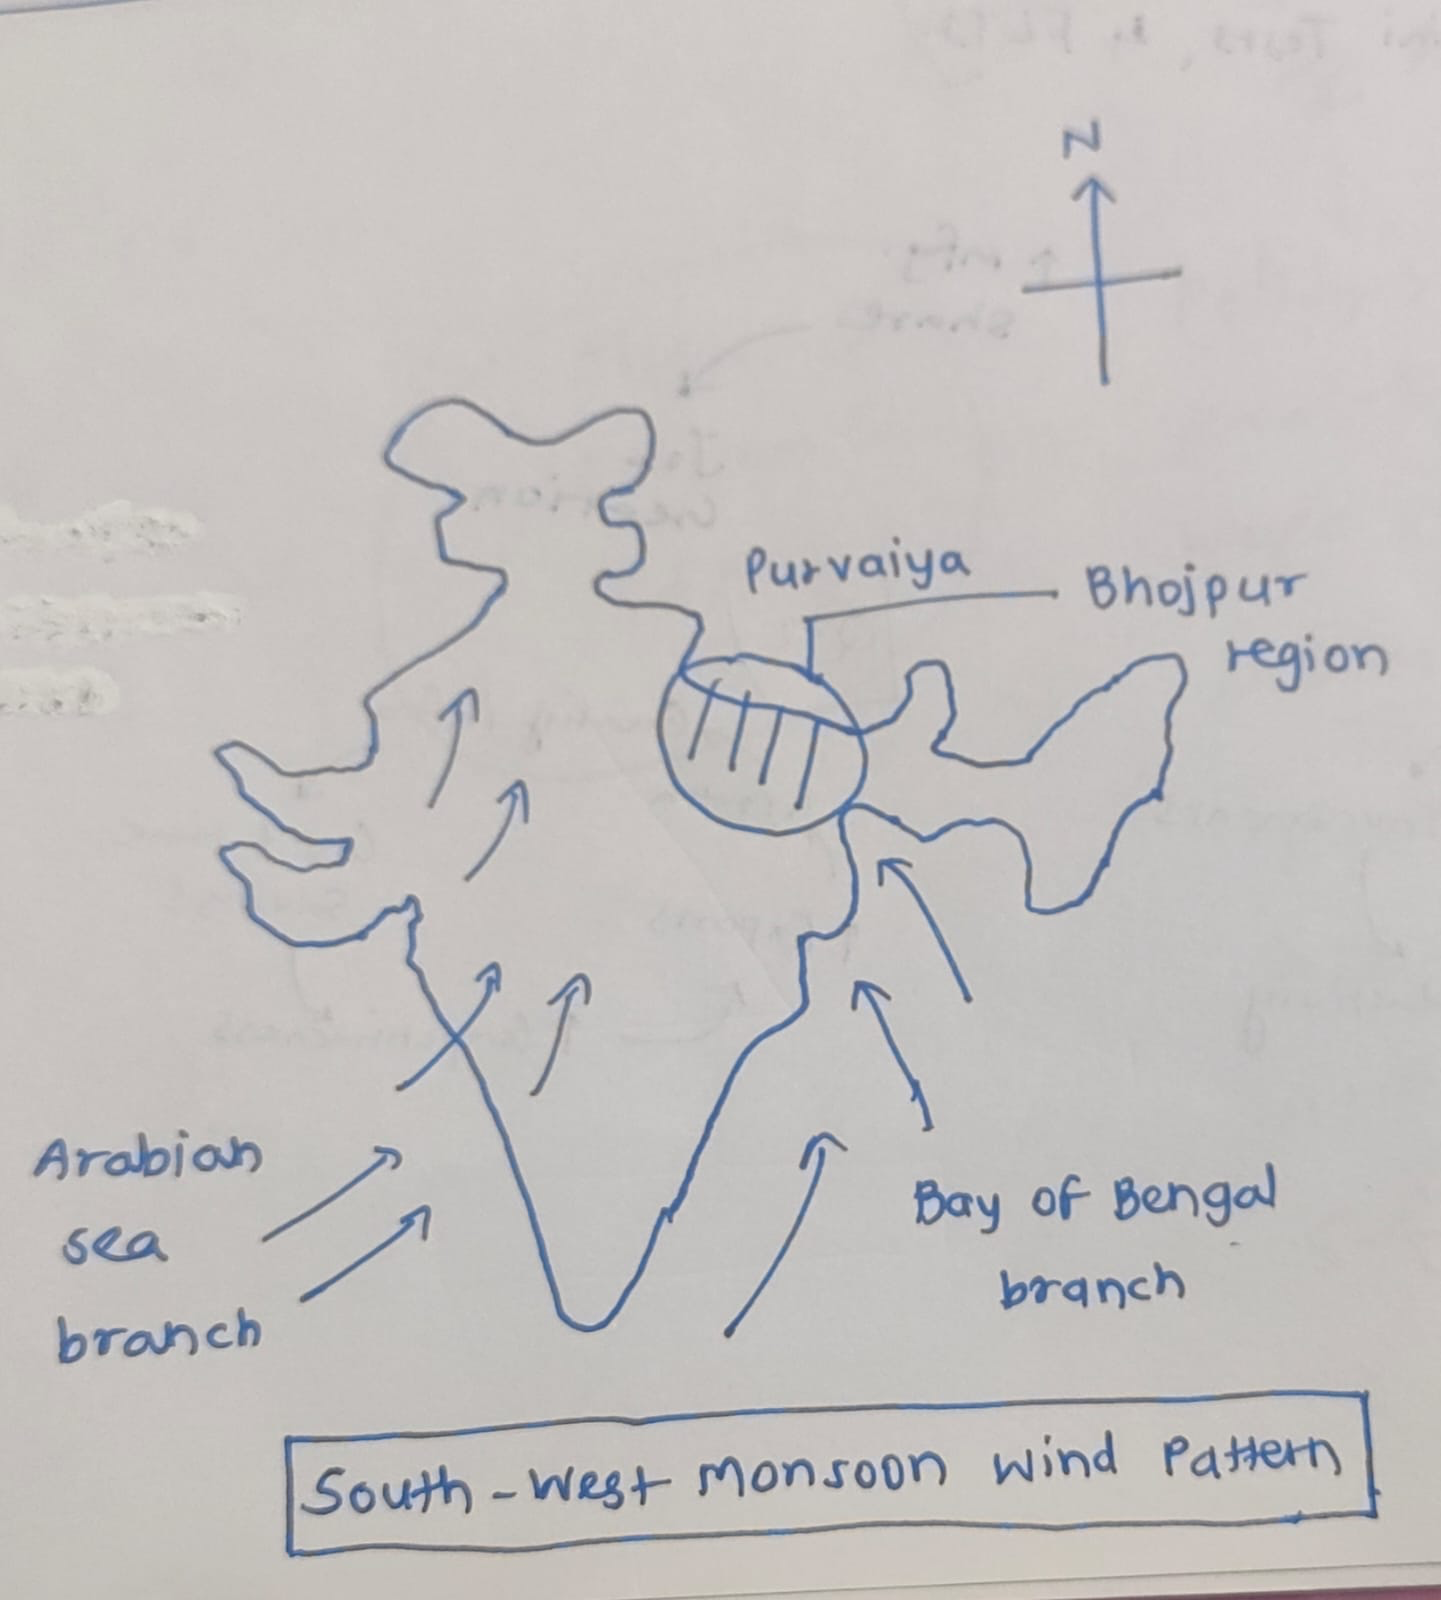
    The Ganga River Basin houses around 43% of India’s population (600 million) in about 26% of its geographical area. The average population density exceeds 520 persons/km².

    Distribution and Density of Population

    Upper Ganga Basin

    Characterized by low density (approx. 150-300 persons/km²).

    Rugged terrain and steep slopes restrict large-scale habitation to river valleys like Dehradun and Haridwar.

    Middle Ganga Plain – “demographic heartland” with very high density (800-1,100+ persons/km²).

    Lower Ganga Plain – extremely high density (exceeding 1,000-1,300 persons/km²), particularly in the deltaic regions and the Kolkata Metropolitan Area.

    Impact of Land on Distribution and Density of Population

    Extensive level plains support agriculture, transport, and urban expansion. Eg- eastern Uttar Pradesh and north Bihar.

    A high proportion of cultivable land supports intensive agricultural activity. Eg- Rice-wheat belt of the middle Ganga plain.

    Deltaic plains – Urban and industrial concentration. Eg- Kolkata-Howrah region in the lower Ganga plain.

    Piedmont and Tarai zone – Forests converted into agricultural land increased settlement. Eg- Tarai region of Uttarakhand and Uttar Pradesh.

    Himalayan Foothills-In the Upper Basin (Uttarakhand), rugged terrain restricts population to valley floors. Eg- Dehradun and Haridwar

    Ease of Habitation-The vast, flat alluvial plains allow for the construction of dense transport networks. Eg- National Highway 19 corridor connects mega-cities like Delhi, Kanpur, and Kolkata.

    Gentle Slope-A gradient of barely 20cm/km facilitates large-scale urban sprawl. Eg- The rapid expansion of cities like Noida and Ghaziabad

    Doab Regions-The fertile land between two rivers (Doabs) shows the highest density. Eg- The Ganga-Yamuna Doab

    Impact of soil on distribution and density of population

    Alluvial Dominance-Over 70% of the basin is covered by nutrient-rich alluvium, supporting 80% of its population.

    Soil suitable for diverse crops – Rice, wheat, sugarcane, pulses and jute support a dense population. Eg- Jute cultivation in West Bengal delta.

    Khadar (New Alluvium)-Annually replenished by floods, these soils support intensive agriculture. Eg- North Bihar plains sustain a density of over 1,100 persons/km² due to its high productivity.

    Bhangar (Old Alluvium)-Stable, older soils support the wheat-sugar cane belt and high rural density of Western Uttar Pradesh.

    Multi-cropping Potential-Eg- Farmers in the Lower Ganga Basin (West Bengal) grow three rice crops (Aman, Aus, Boro), sustaining very high rural populations.

    Deltaic Silt-The nutrient-dense silt in the Sunderbans and Bengal delta supports high-intensity fishing and farming. Eg- High densities in districts like South 24 Parganas despite the risk of cyclones.

    Impact of water on distribution and density of population

    Perennial river system – Reliable water for domestic and agricultural use supports dense settlements. Eg- Kanpur on Ganga bank.

    Extensive canal irrigation supports agricultural intensification and increases rural density. Eg- Upper Ganga Canal in western Uttar Pradesh.

    Groundwater Availability-Eg- The widespread use of tubewells in the Bihar plains allows for dense human clusters away from the main river.

    Inland water transport supports urban growth. Eg- Eg- National Waterway-1 along the Ganga.

    Major Challenges

    Very high population pressure on land – Average landholding size in Bihar and eastern UP is less than 1 hectare.

    Frequent floods – Displacement and loss of livelihood. Eg- Annual floods in north Bihar.

    Groundwater depletion – Over-extraction for irrigation in western and central UP.

    Water pollution – Eg- Industrial and domestic waste in Kanpur-Varanasi stretch.

    Declining soil fertility due to overuse of fertilisers. Eg- Green Revolution areas of western UP.

    Unplanned urbanisation – Pressure on land and water resources

    Climate variability – Irregular monsoon and heat stress impact agriculture productivity and public health.

    Efficient land use planning, flood management, groundwater regulation, and soil conservation are essential for maintaining the region’s demographic and ecological balance.

    Society

    Salient Features

  • Explain briefly the ecological and economic benefits of solar energy generation in India with suitable examples.

    India has emerged as a global leader in solar energy with over 140 GW of installed solar capacity (Nov 2025) and ranks 3rd in the world in solar capacity and generation.

    Ecological Benefits

    Carbon Sequestration

    By replacing coal-fired thermal power, which is the primary source of CO-2 emissions. Every 1 GW of solar power reduces CO2 emissions by approximately 1.5 million tonnes annually.

    Supports India’s NDC targets – 500 GW non-fossil capacity by 2030 and net-zero by 2070.

    Water Conservation – Use 95% less water than thermal power plants. Shifting to solar saves roughly 2.5 liters of water per kWh generated.

    Preservation of Fragile Ecosystems – Installing panels on reservoirs reduces water evaporation and algae growth. Eg- Omkareshwar Floating Solar Park (Madhya Pradesh).

    Agrivoltaic Biodiversity – “Solar farming” allows crops to grow beneath panels, creating a micro-climate that reduces soil moisture loss.

    Reduction Air Pollution – Unlike fossil fuels, solar generation releases zero SOx, NOx, or particulate matter (PM 2.5).

    Soil Reclamation – Solar parks built on saline or degraded “wastelands,” prevent further soil erosion. Eg- Khavda Hybrid Park in the Rann of Kutch

    Transition to Circular Economy – Eg- Draft Solar Waste Management Rules mandate recycling of end-of-life panels.

    Protection of Glacial Regions – Eg- Solar projects in Ladakh (13 GW planned) can reduce black carbon deposits on glaciers, which otherwise accelerate melting.

    Economic Benefits

    Cost Savings for Households – Solar tariffs are lower compared to coal based power.

    Reduction in Energy Import Bill – Solar energy helped India save roughly $4.2 billion in fuel costs in 2024-25, strengthening the Current Account Balance.

    Boost to Domestic Manufacturing (PLI Scheme) – Solar manufacturing capacity jumped from 38 GW to 74 GW in 2025, attracting ₹52,900 crore in fresh private investment.

    Agricultural Income Diversification- Under PM-KUSUM Component A, farmers can earn income by installing solar plants on unproductive land.

    Attraction of Global FDI – 100% FDI under the automatic route has made India a top destination for ESG-focused global funds.

    Rural Electrification – Solar micro-grids provide 24/7 power to remote villages where grid extension is expensive.

    Infrastructure Development – Mega solar parks bring roads, water, and connectivity to previously isolated regions.

    Export Potential– India exported $1.5 billion worth of solar equipment in 2025.

    Challenges in Solar Energy Generation

    Intermittency and Storage Gap- shortage of Battery Energy Storage Systems (BESS)

    Land Acquisition Hurdles for Mega-parks

    Lack of grid connectivity

    Import dependency- India still imports over 90% of its wafers and ingots from China.

    Limited recycling infrastructure creates a toxic waste risk (lead and cadmium).

    Poor Financial Health of DISCOMs- delayed payments to solar developers and deterring investment.

    Steps Taken by Governments

    PM-Surya Ghar- Muft Bijli Yojana to solarize 1 crore households by 2027

    Solar Park Scheme- A target of 40 GW across 50+ parks by March 2026.

    PM-KUSUM- Solarizing over 30 million irrigation pumps.

    PLI Scheme- to boost domestic manufacturing of high-efficiency solar modules

    A balanced strategy focusing on decentralised solar, grid expansion, storage systems, and region-specific planning is essential to achieve Panchamrit Targets.

  • How are climate change and the sea level rise affecting the very existence of many island nations? Discuss with examples.

    As per the IPCC, global mean sea level rose by 0.20 m between 1901 and 2018. It has projected a global mean SLR of 1.3 to 1.6 m by 2100 under the high-emission scenario.

    Permanent submergence of land – Eg- Kiribati has already seen two small uninhabited islets (Tebua Tarawa and Abanuea) disappear underwater.

    Coastal erosion – Wave action and storm surges remove shoreline. Eg- Shoreline retreat in the Maldives.

    Salinisation of freshwater lenses – Sea water enters groundwater and contaminates wells leading to drinking water shortage.

    Frequent flooding during high tides and storms can lead to large scale displacement. Eg- ā€œKing tideā€ flooding in Tuvalu.

    Damage to housing and public infrastructure – Eg- Majuro Airport in the Marshall Islands frequently faces flooding

    Loss of agriculture – Salinity affects soil fertility and traditional crops. Eg- Taro cultivation affected in Kiribati and Tuvalu.

    Coral reef degradation – Ocean warming and acidification damage reefs that act as wave barriers. Eg- Coral bleaching in Fiji and Maldives.

    Impact on fisheries – Changes in ocean temperature and reef systems reduce fish catch, impacting livelihood

    Climate-induced migration – Eg- Kiribati purchased land in Fiji for future resettlement.

    Way Forward

    Hard Engineering Measures

    Seawalls to block wave attack.

    Groynes – Trap sand and widen beaches. Eg- Puducherry groyne field.

    Breakwaters – Offshore barriers that reduce wave energy. Eg- Chennai port.

    Revetments – Sloped rock armour to absorb wave impact.

    Soft Engineering Measures

    Mangrove Restoration – Eg- MISHTI-based efforts in Sundarbans.

    Coral and Seagrass Restoration – Eg- Andaman reef rehabilitation.

    Integrated Coastal Zone Management (ICZM)

    Ecosystem-Based Coastal Planning – Combines geomorphology, ecology and socio-economic factors.

    Regulatory Tools (CRZ Norms) – no-development zones and hazard mapping reduce vulnerability.

    Early Warning SystemsINCOIS alerts for timely action.

    Strengthening coastal resilience and climate mitigation is essential to safeguard communities and advance SDG 13 (Climate Action) and SDG 14 (Life Below Water).

    Water

  • What are non-farm primary activities? How are these activities related to physiographic features in India? Discuss with suitable examples.

    Non-farm primary activities are those primary sector activities that involve the direct extraction or harvesting of natural resources other than crop cultivation.

    Major non-farm primary activities in India

    Mining

    Fishing and aquaculture

    Forestry and logging

    Animal husbandry and pastoralism

    Collection of minor forest produce

    Relation with physiographic features

    Mining – Concentration in plateau and mountain regions due to ancient crystalline rocks and sedimentary basins. Eg- Iron ore in Odisha-Jharkhand belt, coal in Damodar valley, bauxite in Eastern Ghats.

    Forestry – Dense forests grow in high relief and high rainfall areas. Eg- Coniferous forests in Himachal & Uttarakhand, tropical evergreen forests in Western Ghats.

    Animal Husbandry – Arid, Semi-Arid and Grassland Regions. Eg- Sheep rearing in Rajasthan, cattle in Gujarat, transhumance in Himalayas.

    Fishing – Coastal Plains and Riverine Regions. Eg- Marine fishing in Kerala & Gujarat, inland fisheries in Ganga-Brahmaputra plains, brackish water aquaculture in Andhra Pradesh and Chilika lake

    Minor Forest Produce in Central Indian Highlands and North-East hills. Eg- Tendu leaves in Madhya Pradesh, lac in Jharkhand.

    Horticulture and Plantation – Grows in hill slopes and high rainfall areas. Eg- Tea in Assam & Darjeeling, spices in Kerala.

    This reflects the intimate relationship between natural resource endowment and livelihood patterns, and highlights the need for region-specific, sustainable development strategies.


  • ⁠What are Tsunamis? How and where are they formed? What are their consequences? Explain with examples.

    A tsunami is a series of large ocean waves generated by the sudden displacement of a massive volume of water, usually due to undersea earthquakes, volcanic eruptions, landslides, or meteorite impacts.

    Tsunami Formation Process

    Tectonic Plate Movement – Occurs mainly at subduction zones where one plate sinks beneath another.

    Sudden Seafloor Displacement due to vertical uplift or subsidence of seabed

    Energy Transfer to Water Column leading to upward push.

    Wave Propagation in Deep Ocean – Waves travel at high speeds (up to 700-800 km/h) with low height.

    Wave Shoaling Near Coast – As depth decreases, wavelength decreases and height increases

    Consequences of Tsunamis

    Social Consequences

    Mass casualties – Over 2,30,000 deaths in 2004 Indian Ocean tsunami.

    Large-scale displacement – Millions displaced in Indonesia and Sri Lanka (2004).

    Health crises – Water-borne diseases in relief camps.

    Psychological trauma – Long-term PTSD among survivors in Japan (2011).

    Economic Consequences

    Infrastructure destruction – Ports, roads, airports damaged. Eg- Severe infrastructure loss in Fukushima (2011).

    Loss of livelihoods – Fisheries and tourism collapse.

    High reconstruction costs – Japan’s 2011 losses estimated over $200 billion.

    Environmental Consequences

    Coastal ecosystem damage – Eg- Coral reef degradation in Andaman & Nicobar (2004).

    Soil salinization – Agricultural lands turned infertile.

    Secondary disasters. Eg- Fukushima nuclear accident (2011).

    Groundwater Contamination- Saltwater and sewage penetrate freshwater aquifers

    While they cannot be prevented, early warning systems, ecological buffers, and resilient coastal planning can significantly reduce their human and economic toll.

  • Consider the following statements

    Consider the following statements:
    Tributary River – Main River
    1. Chambal: Narmada
    2. Sone: Yamuna
    3. Manas: Brahmaputra.

  • Consider the following statements

    Consider the following statements:
    1. Ajman is one of the seven Emirates of the UAE.
    2. Ras al-Khaimah was the last Sheikhdom to join the UAE.