💥Join UPSC 2027,2028 Mentorship (July Batch) + XFactor Notes & Microthemes PDF

Subject: Geography

  • Role of dams in Uttarakhand floods

    The article explains the link between the disasters in the Uttarakhand and the construction of dams.

    How dams exacerbate disasters

    • The use of explosives has repeatedly been questioned for dam construction, and the construction of other infrastructure projects, such as roads, in the fragile Himalayan State.
    • Other than this, deforestation takes place when dams are constructed.
    • The construction material that is supposed to be dumped on separate land is often dumped into the rivers.

    The Chopra Committee report after Kedarnath flood

    • The Chopra Committee report of 2014 brings more clarity on how dams exacerbate a disaster such as floods.
    • Its report mentions how dams exacerbated the 2013 deluge, mainly as riverbeds were already raised from the disposed muck at the dam construction sites.
    • The report presents evidence to prove that dams are not only damaged in floods, they also cause immense damage in downstream areas.
    • This is because as floodwaters damage a barrage, they increase the destructive capacity of the water that flows downstream of the barrage.
    • In an affidavit submitted on December 5, 2014 in the Supreme Court, the Union Ministry of Environment, Forest and Climate Change acknowledged the adverse impact of dams in the 2013 floods.

    Impact of climate change and threat of earthquakes

    • Himalayan glaciers are receding and disintegrating as a result of climate change, and the snow cover in the Himalayas is also thinning.
    • Research shows an increase in number and volume of glacial lakes as a result of of increased temperatures.
    • For dams, this means rapid increase or decrease in the reservoir water level.
    • It also means that the projections on the life of a dam reservoir may not stand due to erratic events, such as floods, that could rapidly fill a reservoir with muck and boulders brought along with the floods.
    • In terms of earthquake risk, Uttarakhand lies in Seismic Zone-IV (severe intensity) and Seismic Zone-V (very severe intensity).
    • Ignoring this, many dams have been constructed in zones that are under high risk of witnessing severe earthquakes.

    Consider the question “Examine the role played by the dams in exacerbating the disasters in the Himalayan states”

    Conclusion

    It is clear that dams worsen disasters, and for this to be ignored by the State authorities is unfortunate.

  • Flash floods and their mitigation

    This newscard is an excerpt from the original article published in the Indian Express.

    What are Flash floods?

    • A flash flood is a rapid flooding of low-lying areas: washes, rivers, dry lakes and depressions.
    • It may be caused by heavy rain associated with a severe thunderstorm, hurricane, tropical storm, or meltwater from ice or snow flowing over ice sheets or snowfields.

    Take a glimpse of the series of disasters in Uttarakhand

    Chamoli example

    • Flash flood incident in Uttarakhand is another warning of the dangers that a Himalayan state like Uttarakhand faces from natural processes like landslides, snow avalanches cloudbursts or lake bursts.
    • As we saw in 2013 in the same state, such processes can trigger much bigger disasters and cause massive destruction.
    • But it is possible to work towards minimising the threat of such incidents and reduce their impact.

    Role of glacial lakes

    • There are over 1,000 glaciers in Uttarakhand. Almost all of them are receding. Most of the glaciers also have debris cover.
    • When glaciers retreat due to rising temperatures, the snow melts but the debris remains. This debris aids in the formation of lakes.

    Cause: Retreat of glaciers

    • Glaciers have reduced considerably in mass and surface area since the little ice age period.
    • This has led to the formation of a large number of glacial lakes all across the Himalayas.
    • Many of these high-altitude lakes are potentially dangerous, because of their potential to cause flash floods in the event of a breach.

    How big is the threat?

    • Over the years, the frequency of formation of these lakes has increased.
    • But despite that, there are not many GLOF (glacial lake outburst flood) events happening in Uttarakhand.
    • Not as many as in Sikkim, for example. This is because Uttarakhand has very steep slopes, and the water manages to find a way out.

    What should be done?

    (a) Coherent research

    • There are a lot more glaciologists and others who are working in the area and generating data.
    • Multiple scientific groups and institutions are involved. But there is no coherent output. Lots of data are being generated but not being put to good use.
    • There has to be one agency dedicated to the job.

    (b) Monitoring

    • The first step in tackling the threat from these glacial lakes is to start monitoring them and the glaciers more actively and regularly.
    • There is a need to monitor every glacier. Glaciers in one basin do not have remarkably different properties.
    • Relying only on satellites and remote sensing is not going to be enough.
    • What is required is a consolidated state of glaciers in India, with the ability to zoom in on any of them and track the changes happening year by year.

    (c) Planning

    • Construction-related activities in the state might not have a direct link to Chamoli incident, but these are not entirely benign.
    • The Himalayas are very young mountain systems, and extremely fragile and a minor change in orientation of the rocks can be enough to trigger landslides.
    • It is important to include glaciers in any environment impact assessment for major projects such as the construction of dams.
    • The entire catchment areas should be made part of the impact assessment.

    (d) Mitigation

    • If we monitor the glaciers regularly, it would enable us to identify the lakes that need mitigation solutions.
    • Several structural and geotechnical measures can be applied, and there are successful examples where the threat from these lakes has been reduced.
    • It is possible to construct channels for the gradual and regulated discharge of water from these lakes, which will reduce the pressure on them, and minimise the chances of a breach.
    • At the same time, it also reduces the volume of water that goes into the flash flood. Also, alarm systems can be set up at the lakes that will warn the community downstream whenever an overflow happens.

    Way forward

    • It is not possible to completely prevent these kinds of incidents. But their potential to cause destruction can certainly be minimized.
    • Scientists can find a way to let the lake waters slowly drain at the nearby river at a regulated rate so that there is no flooding, and the pressure on the lake does not become unbearable.
    • Such solutions can be applied in Uttarakhand, and some work is being done.
  • Why hydel projects in the Himalayas are worrying?

    The flash flood that claimed several lives in Chamoli has caused Uttarakhand’s hydroelectric projects (HEPs) to be scrutinized closely.

    Q.How do hydropower projects pose geological and topographical threats to the ecosystem? (150W)

    Why Hydropower in Uttarakhand?

    • Uttarakhand has a tricky relationship with electricity.
    • With a landscape that’s inhospitable to thermal power grid lines and with people too poor to pay for electricity, micro and mini hydro-electric power projects were seen as the answer.
    • Between the government’s long-standing ‘power for all’ objective, and environmentalists pushing for a cleaner, renewable energy, setting up dozens of hydel power plants seemed ideal.

    Impacts of HEPs

    Limitless quarrying, deforestation, stopping the flow of rivers, and mushrooming of hydropower projects have made the Himalayas unstable.

    • Existing and under-construction hydro-power projects in Uttarakhand have led to several deleterious environmental impacts (Char Dham Committee).
    • Among the significant impacts are on the river ecosystem, forest and terrestrial biodiversity, geological environment and social infrastructure.
    • More than seven years later, some experts believe that over-exploitation of rivers and rampant damming for hydroelectric projects (HEPs) could be one of the big factors responsible for the Chamoli disaster.
    • The ‘river-bed profile’ across the major HEPs of Uttarakhand has changed significantly, suggesting the possibility of disasters in future.

    The Kedarnath floods

    • Between June 13 and 17, 2013, Uttarakhand had received an unusual amount of rainfall.
    • This led to the melting of the Chorabari glacier and the eruption of the Mandakini river.
    • The floods affected large parts of Uttarakhand, Himachal Pradesh and Western Nepal.
    • The heavy rainfall caused massive flash floods and landslides resulting in the death of residents and tourists as well as extensive damage to property.
    • Over 5,000 people were killed in the floods

    Construction still persists

    • Neglecting all warnings of the experts, rampant construction was carried out in the sensitive zones even after the 2013 Kedarnath deluge.
    • Notably, two dozen hydropower plants of Uttarakhand were rejected by the Supreme Court after the expert panel report.

    HEPs in Uttarakhand

    The rivers and basins in the state are dotted with 43 micro hydel projects. Some of them are:

    Alarms have been raised earlier

    • The Kedarnath expert committee had warned about the excessive exploitation of vulnerable regions and the need to re-study and re-evaluate the HEPs of Uttarakhand.
    • The report also objected to HEPs at an altitude of over 2000 metres.
    • The report pointed out that the potential threat of landslide, cloudburst, subsidence, flash floods has increased tremendously in the past few years and many critical zones need immediate attention.
    • The study also mentioned that a lot of anthropogenic pressure due to different activities related to HEPs was alarming and needed checks.
  • The problem of ageing dams in India

    Ageing dams threaten India’s water security, affect farmers’ income and increases the frequency of flooding. 

    What is a dam?

    • A dam is a barrier that stops the flow of water and results in the creation of a reservoir. Dams are mainly built in order to produce electricity by using water. This form of electricity is known as hydroelectricity.
    • Reservoirs created by dams not only suppress floods but also provide water for activities such as irrigation, human consumption, industrial use, aquaculture, and navigability.

    Types of Dams

    There are many dams in India, and hence there is a need to know about them as there are questions based on the dams of India. The Bank Exams like IBPS or SBI contains questions from this section.

    Based on the structure the types of dams are as mentioned below:

    1. Arch Dam: An arch dam is a concrete dam that is curved upstream in the plan. It is designed so that the hydrostatic pressure (force of the water against it) presses against the arch, causing the arch to straighten slightly and strengthening the structure as it pushes into its foundation or abutments. An arch dam is most suitable for narrow canyons or gorges with steep walls of stable rock to support the structure and stresses.
    2. Gravity Dam: Dams constructed from concrete or stone masonry are Gravity dams. They are designed to hold back water by using only the weight of the material and its resistance against the foundation to oppose the horizontal pressure of water pushing against it. These are designed in such a way that each section of the dam is stable and independent of other section.
    3. Arch-Gravity Dam: This dam has the characteristics of both an arch dam and a gravity dam. It is a dam that curves upstream in a narrowing curve that directs most of the water pressure against the canyon rock walls. The inward compression of the dam by the water reduces the lateral (horizontal) force acting on the dam.
    4. Barrages: A barrage is a type of low-head, diversion dam which consists of a number of large gates that can be opened or closed to control the amount of water passing through. This allows the structure to regulate and stabilize river water elevation upstream for use in irrigation and other systems.
    5. Embankment Dams: An embankment dam is a large artificial dam. It is typically created by the placement and compaction of a complex semi-plastic mound of various compositions of soil, sand, clay, or rock. It has a semi-pervious waterproof natural covering for its surface and a dense, impervious core.
    6. Rock-Fills Dams: Rock-fill dams are embankments of compacted free-draining granular earth with an impervious zone. The earth utilized often contains a high percentage of large particles, hence the term “rock-fill”.
    7. Concrete-face rock-fill dams: A concrete-face rock-fill dam (CFRD) is a rock-fill dam with concrete slabs on its upstream face. This design provides the concrete slab as an impervious wall to prevent leakage and also a structure without concern for uplift pressure.
    8. Earth-fill dams: Earth-fill dams, also called earthen dams, rolled-earth dams or simply earth dams, are constructed as a simple embankment of well-compacted earth. A homogeneous rolled-earth dam is entirely constructed of one type of material but may contain a drain layer to collect seep water.

    Major Dams in India

    The major dams in India have helped the inhabitants in a number of ways like:

    1. Providing adequate water for domestic, industry and irrigation purposes.
    2. Hydroelectric power production and river navigation.
    3. These major dams in India and their reservoirs provide recreation areas for fishing and boating.
    4. They have helped in the reduction of floods.

    Some facts about the issue of ageing dams

    • India is ranked third in the world in terms of building large dams.
    • Of the over 5,200 large dams built so far, about 1,100 large dams have already reached 50 years of age and some are older than 120 years.
    • The number of such dams will increase to 4,400 by 2050.
    • This means that 80% of the nation’s large dams face the prospect of becoming obsolete as they will be 50 years to over 150 years old.
    • The situation with hundreds of thousands of medium and minor dams is even more precarious as their shelf life is even lower than that of large dams.

    Impact on the storage capacity

    • As dams age, soil replaces the water in the reservoirs technically known as silt or sediment.
    • Therefore, the storage capacity cannot be claimed to be the same as it was in the 1900s and 1950s.
    • To make matters worse, studies show that the design of many of our reservoirs is flawed.
    • Almost every scholarly study on reservoir sedimentation shows that Indian reservoirs are designed with a poor understanding of sedimentation science.
    • The designs underestimate the rate of siltation and overestimate live storage capacity created.
    • Therefore, the storage space in Indian reservoirs is receding at a rate faster than anticipated.

    Consequences

    • When soil replaces the water in reservoirs, supply gets choked.
    • The net sown water area either shrinks in size or depends on rains or groundwater, which is over-exploited.
    • Crop yield gets affected severely and disrupts the farmer’s income.
    • The farmer’s income may get reduced as water is one of the crucial factors for crop yield along with credit, crop insurance and investment.
    • It is important to note that no plan on climate change adaptation will succeed with sediment-packed dams.
    • The flawed siltation rates demonstrated by a number of scholarly studies reinforce the argument that the designed flood cushion within several reservoirs across many river basins may have already depleted substantially due to which floods have become more frequent downstream of dams. 

    Consider the question “Ageing dams poses several challenges for India. Identify these challenges and suggest the measures to deal with these challenges.” 

    Conclusion

    The nation will eventually be unable to find sufficient water in the 21st century to feed the rising population by 2050, grow abundant crops, create sustainable cities, or ensure growth. Therefore, it is imperative for all stakeholders to come together to address this situation urgently.

  • What is the ‘Doomsday Clock’?

    The hands of the ‘Doomsday Clock’, a visual depiction of how vulnerable the world is to a climate or nuclear catastrophe, remained at ‘100 seconds to midnight’ for the second consecutive year — the closest it has been to the symbolic annihilation of humanity.

    Q.The ‘Doomsday Clock’ represents the hypothetical countdown to raise human consciousness against mutually assured destruction. In this light, discuss various existential threats to humanity and action taken so far.

    What is the ‘Doomsday Clock’?

    • The Bulletin of the Atomic Scientists, founded by Albert Einstein and students from the University of Chicago in 1945, created the ‘Doomsday Clock’.
    • It is held as a symbol to represent how close the world is to a possible apocalypse.
    • It is set annually by a panel of scientists, including 13 Nobel laureates, based on the threats — old and new — that the world faced in that year.
    • When it was first created in 1947, the hands of the clock were placed based on the threat posed by nuclear weapons, which the scientists then perceived to be the greatest threat to humanity.
    • Over the years, they have included other existential threats, such as climate change and disruptive technologies like artificial intelligence.

    Significance of such clock

    • The reason the scientists selected a clock is twofold — they wanted to use the imagery of an apocalypse (midnight) as well as the “contemporary idiom of a nuclear explosion” (zero countdowns) to illustrate the threats to humanity.
    • The clock was originally set to seven minutes to midnight and has since moved closer or further away from the dreaded 12 o’clock position.
    • The furthest it has been being 17 minutes after the end of the Cold War in 1991.

    Why was the clock set at ‘100 seconds from midnight’?

    • It was set at the ‘100 seconds from midnight’ position due to the prevailing climate conditions, “cyber-based disinformation”, nuclear risk and the pandemic.
    • It is the closest to Doomsday we have ever been in the history of the Clock.
    • We now face a true emergency – an absolutely unacceptable state of world affairs that has eliminated any margin for error or further delay.
  • Tide–Rainfall Flood Quotient

    To understand if a coastal city is more prone to floods caused by tidal events or extreme rainfall, a team from the IIT Bombay devised a new metric or measure called the Tide–Rainfall Flood Quotient.

    Try this PYQ:

    The 2004 Tsunami made people realize that mangroves can serve as a reliable safety hedge against coastal calamities. How do mangroves function as a safety hedge?

    (a) The mangrove swamps separate the human settlements from the sea by a wide zone in which people neither live nor venture out

    (b) The mangroves provide both food and medicines which people are in need of after any natural disaster

    (c) The mangrove trees are tall with dense canopies and serve as art excellent shelter during a cyclone or tsunami

    (d) The mangrove trees do not get uprooted by storms and tides because of their extensive roots

    Tide–Rainfall Flood Quotient

    • Using the past rainfall data, tidal data, and topography of the region one can apply this framework to pinpoint the major factor at play.
    • This quotient helps understand the main driver of the flooding events for effective disaster management.
    • It considers three geographically diverse flood-prone coastal regions – Mithi Catchment in Mumbai, , Jagatsinghpur District in Odisha, and Greater Chennai to test their new metric.
    • The new method helped classify these regions into ‘storm-tide dominated’ or ‘pluvial (rainfall) dominated’ regions.
    • In Mithi, they found a devastating impact of storm-tide reaching even up to a distance of 7 km from the coastal boundary.
    • It concluded that Mithi catchment was ‘storm-tide dominated’, while Jagatsinghpur and Chennai were ‘pluvial dominated’

    A tool for flood management

    • This metric can help disaster management experts in framing better flood risk management systems directed towards long term planning.
    • For storm-tide dominated regions, severe flood hazard can be alleviated by building coastal defence structures such as closure dams, tide breakers, and storm-surge barriers at appropriate locations.
    • The tide and surge forecasting systems in these regions should be equipped with state-of-the-art ocean circulation models.
    • On the other hand, for pluvial dominated regions, structural measures such as rainwater storage structures, lakes, and detention basins should be prioritized in the flood management plans.
  • What is Winter Solstice?

    Yesterday, December 21, was Winter Solstice, the shortest day of the year in the Northern Hemisphere. In the Southern Hemisphere, conversely, it was Summer Solstice, the year’s longest day.

    Try this MCQ:

    Q.On 21st June, the Sun

    (a) Does not set below the horizon at the Arctic Circle

    (b) Does not set below the horizon at Antarctic Circle

    (c) Shines vertically overhead at noon on the Equator

    (d) Shines vertically overhead at the Tropic of Capricorn

    Why are the hours of daylight, not the same every day?

    • The explanation lies in Earth’s tilt.
    • And it’s not just the Earth — every planet in the Solar System is tilted relative to their orbits, all at different angles.
    • The Earth’s axis of rotation is tilted at an angle of 23.5° to its orbital plane.
    • This tilt — combined with factors such as Earth’s spin and orbit — leads to variations in the duration of sunlight than any location on the planet receives on different days of the year.

    Impact of the tilted axis

    • The Northern Hemisphere spends half the year tilted in the direction of the Sun, getting direct sunlight during long summer days.
    • During the other half of the year, it tilts away from the Sun, and the days are shorter.
    • Winter Solstice, December 21, is the day when the North Pole is most tilted away from the Sun.
    • The tilt is also responsible for the different seasons that we see on Earth.
    • The side facing the Sun experiences day, which changes to night as Earth continues to spin on its axis.

    Un-impacted regions

    • On the Equator, day and night are equal. The closer one moves towards the poles, the more extreme the variation.
    • During summer in either hemisphere, that pole is tilted towards the Sun and the polar region receives 24 hours of daylight for months.
    • Likewise, during winter, the region is in total darkness for months.

    Celebrations associated with the Winter Solstice

    • For centuries, this day has had a special place in several communities due to its astronomical significance and is celebrated in many ways across the world.
    • Jewish people call the Winter Solstice ‘Tekufat Tevet’, which marks the start of winter.
    • Ancient Egyptians celebrated the birth of Horus, the son of Isis (divine mother goddess) for 12 days during mid-winter.
    • In China, the day is celebrated by families coming together for a special meal.
    • In the Persian region, it is celebrated as Yalda or Shab-e-Yalda. The festival marks the last day of the Persian month of Azar and is seen as the victory of light over darkness.
    • Families celebrate Yalda late into the night with special foods such as ajeel nuts, pomegranates and watermelon, and recite works of the 14th century Sufi poet Hafiz Shirazi.

    In Vedic tradition

    • In Vedic tradition, the northern movement of the Earth on the celestial sphere is implicitly acknowledged in the Surya Siddhanta.
    • It outlines the Uttarayana (the period between Makar Sankranti and Karka Sankranti). Hence, Winter Solstice is the first day of Uttarayana.
  • Bihar to change Kosi’s course to save the ancient site

    The Bihar government will try to divert the course of the mighty Kosi River in Bhagalpur district to save an archaeological site discovered recently.

    Tap to read more about the Himalayan Drainage System:

    Drainage System | Part 3

    Kosi River: The Sorrow of Bihar

    • The Kosi is a trans-boundary river which flows through Tibet, Nepal and India.
    • The river crosses into northern Bihar, India where it branches into distributaries before joining the Ganges near Kursela in Katihar district.
    • Its unstable nature has been attributed course changes and the heavy silt it carries during the monsoon season, and flooding in India has extreme effects.
    • It is also known as the “Sorrow of Bihar” as the annual floods affect about 21,000 km2 of fertile agricultural lands thereby disturbing the rural economy.

    Why change its course?

    • Several priceless artefacts have been found at the Guwaradih village in Naugachhia sub-division of Bhagalpur district during the excavation of a mound.
    • These items could be 2,500-years-old and could be of interest for historians if conserved.
    • The historical sites are facing threats from the Kosi floods.
    • The Kosi currently flows around 300-400 metres from the site, while its old course is about two kilometres from the village.

    Threats posed by the move

    • Environmentalists have warned that changing the Kosi’s course could be disastrous for Bihar as seen in 2008.
    • At that time, the river had breached its mud embankments at Kushaha in Nepal.
    • The Kosi frequently changes its course naturally. If its course is artificially changed, it will cause floods and erosion in new areas, leading to massive displacement of people.
    • It then caused extensive damage to life and property downstream in five densely populated districts of northeast Bihar.
    • Some 500 people were killed and four million rendered homeless.
  • How to measure a Mountain?

    China and Nepal have announced Mount Everest is 0.86 m taller than the 8,848 m accepted globally so far.

    Try this PYQ:

    Q.When you travel to the Himalayas, you will see the following:

    1. Deep gorges
    2. U-turn river courses
    3. Parallel mountain ranges
    4. Steep gradients causing land-sliding

    Which of the above can be said to be the evidences for the Himalayas being young fold mountains?

    (a) 1 and 2 only

    (b) 1, 2 and 4 only

    (c) 3 and 4 only

    (d) 1, 2, 3 and 4

    Scaling a mountains’ height

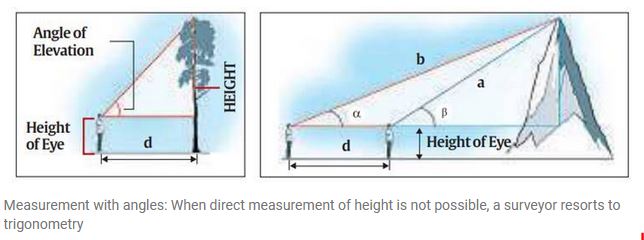
    • The basic principle that was used earlier is very simple and uses  only trigonometry which most of us are familiar with, or at least can recall.
    • There are three sides and three angles in any triangle. If we know any three of these quantities, provided one of them is a side, all the others can be calculated.
    • In a right-angled triangle, one of the angles is already known, so if we know any other angle and one of the sides, the others can be found out.
    • This principle can be applied for measuring the height of any object that does not offer the convenience of dropping a measuring tape from top to bottom.

    Accuracy issues

    • For small hills and mountains, whose top can be observed from relatively close distances, this can give quite precise measurements.
    • But for Mount Everest and other high mountains, there are some other complications.
    • These again arise from the fact that we do not know where the base of the mountain is.

    Measuring against sea level

    • Generally, for practical purposes, the heights are measured above mean sea level (MSL). Moreover, we need to find the distance to the mountain.
    • This is done through a painstaking process called high-precision levelling. Starting from the coastline, we calculate step by step the difference in height, using special instruments.
    • This is how we know the height of any city from mean sea level.

    Adjusting gravitation anomaly

    • But there is one additional problem to be contended with — gravity. Gravity is different in different places. It means that even sea level cannot be considered to be uniform at all places.
    • So, the local gravity is also measured to calculate the local sea level. Nowadays sophisticated portable gravitometers are available that can be carried even to mountain peaks.

    Technology solutions

    • These days GPS is widely used to determine coordinates and heights, even of mountains.
    • But, GPS gives precise coordinates of the top of a mountain relative to an ellipsoid which is an imaginary surface mathematically modelled to represent Earth.
    • This surface differs from the mean sea level. Similarly, overhead flying planes equipped with laser beams (LiDAR) can also be used to get the coordinates.

    How accurate are China/Nepal’s apprehensions?

    • Considering that during 1952-1954, when neither GPS and satellite techniques were available nor the sophisticated gravimeters, the task of determining the height of Mount Everest was not easy.
    • Nepal and China have said they have measured Mount Everest to be 86 cm higher than the 8,848 m that it was known to be.
    • But these have been explained in terms of geological processes that might be altering the height of Everest. The accuracy of the 1954 result has never been questioned.
    • Most scientists now believe that the height of Mount Everest is increasing at a very slow rate. This is because of the northward movement of the Indian tectonic plate that is pushing the surface up.
    • Big earthquake, like the one that happened in Nepal in 2015, can alter the heights of mountains. Such events have happened in the past.
  • What are Rossby Waves?

    Droughts in India have historically been associated with El Nino, anomalous warming of the equatorial Pacific, but Indian scientists have found some relevance in Rossby Waves.

    Q.The determinants of Indian Monsoon are no more limited to the Pacific and the Indian Ocean. Discuss.

    El-Nino alone do not cause drought

    • The study says that nearly six out of 10 droughts, in non-El Nino years occurred during the Indian summer-monsoon season in the past century.
    • They may have been driven by atmospheric disturbances from the North Atlantic region.
    • In an El Niño year, abnormally warm equatorial Pacific waters pull moisture-laden clouds away from the subcontinent.
    • But the IISc Bangalore study shows that in non-El Nino years, these droughts are a consequence of a sudden and steep drop in rainfall in late August.

    Then, how were droughts induced?

    • In an El Nino year, the rainfall deficit departure from a long-term average set in early around mid-June and progressively worsen.
    • Researchers tried to trace this drought back to a forcing agent or system that influences the behaviour over India.
    • They found, the winds that were prevalent in these non-El Niño drought years.

    Another factor: The Rossby Waves

    • The researchers noted that winds in the upper atmosphere are interacting with a deep cyclonic circulation above the abnormally cold North Atlantic waters.
    • The resulting wave of air currents called a Rossby wave, curved down from the North Atlantic squeezed in by the Tibetan plateau and hits the subcontinent around mid-August.
    • This has a suppressing effect on rainfall and throws off the monsoon that was trying to recover from the June slump.

    Now scratch your basics on Planetary Winds. “Go back to the NCERTs !”

    What are Rossby Waves?

    • They are giant meanders in high-altitude winds that have a major influence on the weather.
    • They are influenced by the Coriolis force and pressure gradient.
    • The wave’s usual course is to go from west to east, but not towards the equator.

    Points to be noted ……

    • The Indian Ocean and the Pacific Ocean seem to be at the forefront of all discussions surrounding Indian monsoon droughts.
    • Thus beyond looking at the Pacific Ocean it is important to consider other influences on the Indian monsoon from outside the tropics.
    • It is perhaps time to focus just as much on mid-latitude influences, which might aid in getting a better handle on enhanced predictability of monsoon variability.