Air Pollution
[16th July 2025] The Hindu Op-ed: How is global shipping trying to decarbonise?
PYQ Relevance:[UPSC 2022] Discuss global warming and mention its effects on the global climate. Explain the control measures to bring down the level of greenhouse gases which cause global warming, in the light of the Kyoto Protocol, 1997. Linkage: The fundamental objective behind global shipping’s decarbonization efforts is to reduce the level of greenhouse gases (GHGs) to combat global warming. The shift to green fuels like green ammonia and e-methanol by the shipping industry represents a crucial “control measure” aimed at achieving this objective. |
Mentor’s Comment: India is positioning itself as a global hub for green marine fuels like green methanol and green ammonia, aligning with global shipping’s decarbonisation goals by 2040–2050. With strong policy support, India is accelerating electrolyser manufacturing, advancing carbon capture technologies, and reviving its shipbuilding sector. By promoting green fuel exports, the country aims to seize a strategic opportunity in the global transition to clean energy and assert its maritime leadership in the emerging green shipping economy.
Today’s editorial analyses the green fuels in shipping decarbonisation. This topic is important for GS Paper III (Environment) in the UPSC mains exam.
_
Let’s learn!
Why in the News?
Recently, Global shipping is moving towards reducing carbon emissions by 2040–2050, which offers a major opportunity for India. Currently, most merchant ships run on fuels like Very Low Sulphur Fuel Oil (VLSFO), diesel, and liquefied methane gas.
What are green fuels?
|
How do green fuels aid in shipping decarbonisation?
- Reduction of Greenhouse Gas Emissions: Green fuels like green methanol and green ammonia significantly reduce or eliminate CO₂ and GHG emissions compared to traditional fossil fuels such as VLSFO and LNG. Eg: Green methanol emits about 10% of CO₂ compared to VLSFO, while green ammonia emits virtually zero greenhouse gases.
- Compatibility with Existing Systems (for Transition): Green methanol is a suitable transitional fuel requiring minimal retrofitting of existing ship engines, supporting a smooth shift from fossil fuels. Eg: Over 360 methanol-capable ships are already in service or on order, including by global giants like Maersk and CMA CGM.
- Enables Compliance with Future Emission Norms: Adoption of green fuels ensures alignment with global decarbonisation goals and helps meet emission standards set for 2040–2050 by international maritime bodies. Eg: India’s initiative to build green fuel hubs at Tuticorin and Kandla supports compliance with IMO’s emission targets.
How can India become a global hub for marine green fuel production?
- Utilising Coastal Industrial Clusters for Integrated Green Fuel Zones: India can leverage existing coastal industrial zones to integrate green fuel production with port logistics, reducing supply chain costs and boosting efficiency. Eg: The Mumbai–Pune industrial corridor near the Jawaharlal Nehru Port can be developed into a green methanol hub with co-located renewable energy, CO₂ sources, and export terminals.
- Exporting Green Fuels Through Strategic Trade Partnerships: By forging long-term green energy export agreements with fuel-deficit countries, India can secure demand and scale up production. Eg: A partnership with the European Union’s FuelEU Maritime initiative could enable India to export green methanol to European ports aiming for carbon-neutral shipping.
- Establishing Research and Innovation Centers in Maritime States: Setting up marine green fuel R&D centres in states like Tamil Nadu, Andhra Pradesh, or Odisha can drive innovation in fuel production, storage, and engine retrofits. Eg: A dedicated Marine Energy Innovation Park in Visakhapatnam could support pilot projects for green ammonia engines and advanced electrolyser technology.
What are the challenges?
- High Capital Costs and Infrastructure Requirements: Transitioning to green fuels requires significant investments in retrofitting ships, building new vessels, and developing bunkering infrastructure. Eg: Installing methanol-compatible systems or ammonia handling setups onboard involves major design changes and safety adaptations, slowing adoption.
- Limited Availability and High Price of Green Fuels: Green fuels like e-methanol and green ammonia are still expensive and scarce due to high renewable electricity costsand limited production capacity. Eg: In February, e-methanol cost $1,950/tonne in Singapore, compared to $560/tonne for VLSFO, making the shift economically difficult.
What are the policy and financial tools that are key to scaling green methanol in India?
- Sovereign Guarantees and Off-take Assurance: Government-backed sovereign guarantees reduce investment risks and enable access to low-cost international finance, while off-take agreements ensure steady demand, improving project bankability.
- Production-Linked Incentives (PLI) and Domestic Manufacturing Support: PLI schemes for electrolyser manufacturing help reduce import dependence, lower production costs, and localise the green fuel value chain.
- Carbon Capture and CCUS Incentives: Policy incentives for Carbon Capture, Utilisation, and Storage (CCUS) make it viable to obtain CO₂ from industrial sources, which is essential for green methanol production using green hydrogen.
In what ways can green fuel shipbuilding boost India’s maritime sector?
- Revival of Domestic Shipyards through High-Value Orders: Building green fuel-compatible ships can generate consistent demand for Indian shipyards, modernising infrastructure and creating skilled employment. Eg: Reviving the Hindustan Shipyard Limited (HSL) in Andhra Pradesh with contracts for green ferries and coastal cargo vessels can reinvigorate domestic shipbuilding.
- Enhancing India’s Global Ship Export Potential: Developing expertise in green shipbuilding can position India as an exporter of eco-friendly vessels to emerging markets transitioning to low-emission fleets. Eg: India can export hybrid-electric and green methanol-compatible vessels to island nations in the Indian Ocean and Africa implementing IMO emission norms.
- Strengthening India’s Role in the Green Maritime Supply Chain: Green shipbuilding can attract global OEMs and technology partners, integrating India into the international green maritime supply chain. Eg: Setting up a Green Marine Innovation Cluster in Kochi with global collaboration could turn the region into a hub for next-gen ship components and propulsion systems.
Case study:
|
Way forward:
- Develop Integrated Green Maritime Ecosystems: India should establish green fuel production, bunkering, and shipbuilding hubs along key coastal regions by combining policy incentives, infrastructure investment, and private sector participation.
- Leverage Financial Tools and Global Partnerships: Use sovereign guarantees, PLI schemes, and international green financing to scale up green methanol projects, while forging strategic trade and technology alliances with global maritime leaders.
Get an IAS/IPS ranker as your 1: 1 personal mentor for UPSC 2024

Air Pollution
Smoke and Sulphur: On sulphur dioxide emissions, public health
Why in the News?
Recently the Environment Ministry of India has recently exempted most coal-fired power plants from installing Flue Gas Desulphurisation (FGD) systems, reversing its 2015 mandate. This move weakens efforts to control sulphur dioxide (SO₂) emissions, a harmful air pollutant.
What is Flue Gas Desulphurisation (FGD) system?Flue Gas Desulphurisation (FGD) systems are air pollution control technologies used in thermal power plants to remove sulphur dioxide (SO₂) from flue gases (the exhaust emitted when coal or oil is burned). |
Why has FGD installation been exempted for most coal plants?
- Low Sulphur Content in Indian Coal: Indian coal contains naturally low sulphur, reducing the urgency to control SO₂ emissions. Eg: The expert committee stated that SO₂ levels near plants using Indian coal were already below permissible limits.
- High Installation and Operational Costs: Installing FGD systems is capital-intensive and can increase electricity tariffs. Eg: Many private power producers cited cost constraints as a barrier to following the 2015 FGD mandate.
- Limited Vendor Capacity in India: There is a shortage of FGD equipment suppliers, causing delays in implementation. Eg: From 2015–2024, only 8% of 600 units installed FGDs, primarily by NTPC (a public sector company).
- Impact of COVID-19 Pandemic: The pandemic caused supply chain disruptions and delayed project execution timelines. Eg: The Environment Ministry cited COVID-related delays for missing 2024 FGD deadlines.
- Scientific Reassessment of SO₂ Effects: New studies suggest sulphates formed from SO₂ may have a climate-cooling effect, weakening the urgency of emission controls. Eg: The Power Ministry argued that reducing sulphates could actually worsen global warming.
How does SO₂ affect health and air quality?
- Respiratory Health Impacts: Sulphur dioxide (SO₂) irritates the respiratory tract, causing issues such as asthma, bronchitis, and shortness of breath, especially among vulnerable populations like children and the elderly. In Delhi, spikes in SO₂ levels have been linked to increased hospital visits for respiratory ailments during winter months.
- Formation of Particulate Matter (PM2.5): SO₂ reacts in the atmosphere to form sulphate aerosols, a major component of PM2.5, which penetrates deep into lungs and contributes to air pollution. Industrial belts like Singrauli in Madhya Pradesh record high levels of particulate pollution, partly due to emissions from coal-fired plants.
- Reduced Visibility and Environmental Damage: SO₂ contributes to acid rain and haze, damaging crops, soil, and water sources, and reducing visibility. Areas near thermal power plants, such as in Chhattisgarh, have reported acidic soil degradation, affecting agriculture.
What does selective FGD enforcement indicate about regulation?
- Location-Based Policy Inconsistency: The decision to mandate FGD installation only near NCR and urban hotspots suggests that environmental regulations are being applied selectively, not based on uniform scientific standards, but geographical and political considerations.
- Weak Enforcement and Shifting Priorities: Exempting most coal plants despite earlier commitments reflects regulatory dilution, raising concerns about policy backtracking and the government’s willingness to compromise on environmental health in favor of industrial or economic concerns.
- Undermining Scientific Credibility and Public Trust: Ignoring the original mandate without robust public debate weakens trust in evidence-based regulation, indicating that scientific advisories are not consistently followed in policy implementation.
Why is public debate vital before policy shifts on pollution?
- Ensures Transparency and Accountability: Open public debate creates transparency, compelling policymakers to justify decisions and remain accountable to citizens.
- Strengthens Scientific Rigor: Debate enables scientific scrutiny of environmental claims, ensuring that policy changes are based on credible evidenceand expert consultation.
- Safeguards Public Health and Democratic Rights: Inclusive discussions protect public health and uphold democratic values by allowing citizens to voice concerns over pollution-related policies.
Why is public debate vital before policy shifts on pollution?
|
Way forward:
- Revise FGD Policy Through Transparent Public Consultation: Any change in environmental regulation, especially exemptions, must involve scientific review, public debate, and stakeholder consultations to ensure credibility and protect public health.
- Strengthen Pollution Monitoring and Accountability: Enhance the real-time SO₂ monitoring network, enforce uniform emission standards, and link compliance with financial or operational incentives to promote cleaner technologies across all power plants.
Mains PYQ:
[UPSC 2024] Industrial pollution of river water is a significant environmental issue in India. Discuss the various mitigation measures to deal with this problem and also the government’s initiatives in this regard.
Linkage: The article talks about the Environment Ministry’s decision to exempt most coal-fired plants from mandatory Flue Gas Desulphurisation (FGD) systems, which is a significant government initiative related to an environmental issue (sulphur dioxide emissions) and its mitigation. This is a direct and comprehensive question about environmental issues and the government’s initiatives and mitigation measures.
Get an IAS/IPS ranker as your 1: 1 personal mentor for UPSC 2024
Air Pollution
Secondary Pollutants constitute up to third of PM2.5 Pollution
Why in the News?
A recent study by the Centre for Research on Energy and Clean Air (CREA) highlights that secondary pollutants, particularly ammonium sulphate, are responsible for nearly one-third of India’s PM2.5 pollution.
What are Primary Air Pollutants?
|
About Secondary Air Pollutants:
- Definition: Secondary pollutants form in the atmosphere through chemical reactions involving primary pollutants and environmental agents like sunlight and water vapour.
- Formation Factors: Their creation depends on weather, sunlight, and existing pollutants, making them more complex.
- Key Examples:
- Ammonium sulphate and nitrate – from SO₂ and NH₃ reacting in the air.
- Ground-level ozone (O₃) – formed when NOₓ and VOCs react under sunlight.
- Acid rain components – such as sulfuric and nitric acids.
- Photochemical smog – a mix of toxic secondary pollutants in urban air.
- Impact: They contribute heavily to PM2.5 pollution and have long-lasting, widespread effects.
Highlights from CREA’s Study:
- Ammonium Sulphate Share: This secondary pollutant accounts for 34% of India’s PM2.5, averaging 11.9 μg/m³ nationwide.
- Source Link: It forms from SO₂ (mainly from coal plants) reacting with ammonia from fertilisers and waste.
- FGD Compliance: Only 8% of India’s coal plants have installed flue gas desulphurisation (FGD) units, despite regulations.
- High Exposure Zones: Within 10 km of coal plants, ammonium sulphate levels are 2.5 times higher than in distant areas.
- NCAP City Impact: In 130 cities, it contributes 20–43% of PM2.5; in 114 cities, the share exceeds 30%.
- Other Contributors: Ammonium nitrate and similar secondary compounds form up to 50% of PM2.5 in many places.
- Policy Suggestions: The study urges rapid FGD rollout, fertiliser reform, and strict pollution control enforcement.
| [UPSC 2013] Photochemical smog is a resultant of the reaction among-
Options: (a) NO 2 , O 3 and peroxyacetyl nitrate in the presence of sunlight * (b) CO 2 , O 2 , and peroxyacetyl nitrate in the presence of sunlight (c) CO, CO 2 , and NO 2 at low temperature (d) high concentration of NO 2 , O 3 and CO in the evening |
Get an IAS/IPS ranker as your 1: 1 personal mentor for UPSC 2024
Air Pollution
[16th June 2025] The Hindu Op-ed: What are flue gas desulphurisation units?
PYQ Relevance:[UPSC 2022] Discuss global warming and mention its effects on the global climate. Explain the control measures to bring down the level of greenhouse gases which cause global warming, in the light of the Kyoto Protocol, 1997. Linkage: SO2 as “one of the major greenhouse gases that cause global warming”. Flue Gas Desulphurisation (FGD) units are designed specifically to remove SO2 emissions from the combustion of fossil fuels. Therefore, FGD units serve as a direct “control measure to bring down the level of greenhouse gases” as addressed by the question. |
Mentor’s Comment: India’s top science advisory group has suggested ending the 2015 rule that made it compulsory for all coal-based power plants to install Flue Gas Desulphurisation (FGD) units. This has raised serious concerns because FGDs are key to reducing sulphur dioxide (SO₂) pollution, which causes 15% of India’s PM2.5 levels and leads to breathing problems, environmental damage, and climate change. Although installing FGDs is expensive (₹1.2 crore per MW), experts warn that dropping the plan could harm public health and clean air efforts. Worryingly, only 39 of 537 plants have installed FGDs, and deadlines keep getting pushed back.
Today’s editorial focuses on the analysis of the installation of the Flue Gas Desulphurisation (FGD) units in a thermal power plant. This content is very relevant to GS Paper III (Environment, Science and Technology) Mains.
_
Let’s learn!
Why in the News?
A group of experts, led by Principal Scientific Advisor Ajay Sood, has recently suggested that India should cancel the 10-year-old rule that requires all coal-based thermal power plants to install Flue Gas Desulphurisation (FGD) units.
Why India should cancel the 10-Year-Old Rule (2015 FGD Mandate)?
- High Installation Cost Burden: Installing FGD units costs around ₹1.2 crore per MW, which can significantly raise power generation costs and electricity tariffs. Eg: For 97,000 MW of new capacity, the cost would be about ₹97,000 crore, making power less affordable.
- Delayed and Poor Implementation: Despite the 2015 rule, compliance has been dismal—only 39 out of 537 plants had FGDs installed by 2025. Eg: Repeated deadline extensions (up to 2029) show lack of feasibility and institutional capacity.
- Limited Local Air Quality Impact in Some Areas: In certain regions, the contribution of SO₂ emissions from TPPs to PM2.5 levels is relatively small. Eg: In Delhi, most air pollution comes from other sources like vehicles and construction, so FGDs at distant plants may offer minimal benefit.
What is a Flue Gas Desulphurisation (FGD) unit?
|
How does it reduce SO₂ emissions from thermal power plants?
- Chemical Neutralisation Reaction: FGD units use alkaline substances like limestone or lime to react with acidic SO₂ in flue gas, converting it into stable, non-toxic compounds. Eg: In wet limestone FGD, SO₂ reacts with limestone slurry to form gypsum (CaSO₄·2H₂O), a harmless industrial byproduct.
- Efficient Scrubbing Techniques: Technologies like wet scrubbers or dry sorbent injection physically remove SO₂ from exhaust gases before release into the atmosphere. Eg: Dry sorbent injection sprays powdered lime into the flue gas stream, which binds with SO₂ and is later captured by filters.
- Controlled Emission Discharge: FGD ensures that the treated flue gas released into the environment has significantly lower SO₂ levels, complying with environmental norms. Eg: Power plants near coasts use sea water FGD, where sea water absorbs SO₂ and is then treated before being discharged safely.
Why are SO₂ emissions harmful?
- Respiratory and Health Issues: Sulphur dioxide (SO₂) irritates the respiratory system, causing problems like asthma, bronchitis, and lung damage, especially in children and the elderly. Eg: Studies in urban industrial areas show a direct link between SO₂ exposure and increased hospital admissions for respiratory illnesses.
- Formation of Secondary Particulate Matter (PM2.5): SO₂ reacts in the atmosphere to form fine particulate matter (PM2.5), which can penetrate deep into lungs and enter the bloodstream, posing serious health risks. Eg: According to studies, 80% of PM2.5 from coal combustion is due to secondary particles formed from SO₂.
- Contribution to Acid Rain: SO₂ combines with water vapor in the atmosphere to form sulphuric acid, leading to acid rain that damages soil, crops, forests, and aquatic ecosystems. Eg: Regions near coal-fired plants have reported acidic lakes and damaged crops due to acid rain deposition.
- Environmental Degradation: High SO₂ levels can corrode buildings, especially monuments made of limestone or marble, and degrade overall air and water quality. Eg: The Taj Mahal has shown signs of yellowing, partly attributed to SO₂-related pollution.
- Climate and Visibility Impact: Though SO₂ itself is not a greenhouse gas, it leads to formation of aerosols, affecting cloud formation, reducing visibility, and causing climate imbalance. Eg: In industrial belts, hazy skies and temperature variations are linked to SO₂-derived aerosols.
What is the status of FGD installation in India (2025)?
|
Way forward:
- Prioritised FGD Installation: Expedite FGD implementation in high-emission and densely populated zones to balance cost and health impact.
- Policy and Financial Support: Provide targeted subsidies or incentives to TPPs and integrate FGD costs into long-term tariff planning for smoother adoption.
Get an IAS/IPS ranker as your 1: 1 personal mentor for UPSC 2024
Air Pollution
Dynamic Route Planning for Urban Green Mobility (DRUM)
Why in the News?
IIT Kharagpur has made a web app called Dynamic Route Planning for Urban Green Mobility (DRUM) to help people choose travel routes that are not just fast but also have cleaner air and better energy use.
About DRUM:
- Purpose: It is a navigation tool that prioritises air quality and energy efficiency, offering a greener alternative to traditional mapping apps.
- Data Usage: DRUM uses real-time data on air pollution and traffic conditions to recommend optimal routes.
- Sources: Pollution information is collected from the Central Pollution Control Board (CPCB) and the World Air Quality Index.
Important Features:
- Routing Logic: DRUM applies a rank-based elimination method that prioritizes time, followed by distance, pollution exposure, and energy use.
- Technical Tools: The app uses GraphHopper for route generation and Mapbox for live traffic updates.
- Route Options: Users can choose from 5 routes — shortest, fastest, least pollution (LEAP), least energy use (LECR), and a balanced suggested route.
- Live Updates: It retrieves real-time route data when a query is entered, not through scheduled updates.
- Performance: In Delhi trials, the LEAP route cut pollution exposure by over 50%, and the LECR route reduced energy use by up to 28%.
- Non-Motorized Inclusion: DRUM will expand to serve cyclists, pedestrians, and other non-motorized users.
- Predictive Upgrade: DRUM 2.0, currently in development, will use machine learning to forecast pollution and traffic and recommend best routes and departure times.
| [UPSC 2025] Consider the following types of vehicles:
I. Full battery electric vehicles II. Hydrogen fuel cell vehicles III. Fuel cell electric hybrid vehicles How many of the above are considered as alternative (powertrain) vehicles? Options: (a) Only one (b) Only two (c) All the three* (d) None |
Get an IAS/IPS ranker as your 1: 1 personal mentor for UPSC 2024
Air Pollution
Rising ‘Black Carbon’ heating Himalayan Snow: Study
Why in the News?
A recent study by the think-tank Climate Trends has revealed that levels of black carbon in the Himalayas have been rising steadily over the past two decades.
About Black Carbon (BC):
- What is it: Black carbon is a fine particulate pollutant formed from the incomplete combustion of biomass and fossil fuels.
- Impact: It is a short-lived climate pollutant and the second-largest contributor to global warming after carbon dioxide.
- Lifespan: Unlike CO₂, black carbon stays in the atmosphere for short periods and can be quickly reduced if emissions stop.
- Warming Mechanism: As an aerosol, it absorbs sunlight, heats the atmosphere, and reduces albedo when deposited on snow and ice, leading to faster melting.
- Health Effects: Exposure increases the risk of heart disease, birth complications, and premature death.
- Major Sources in India:
-
- Residential Biomass Burning: Accounts for 47% of BC emissions, including cow dung and straw burning.
- Industries and Vehicles: Industries contribute 22%, while diesel vehicles add 17%.
- Other Sources: Open burning contributes 12%, and other minor sources 2%.
- High-Emission States: Madhya Pradesh and Maharashtra are major emitters due to agricultural and forest fires.
- Biofuel Usage: Alone contributes nearly 42% of India’s total BC emissions.
Key Findings from the Study (2000–2023):
- Snow Temperature Rise: Himalayan snow surface temperature rose from -11.27°C to -7.13°C over two decades.
- Regional Trends: The Eastern Himalayas were warmest, followed by the Central and Western regions.
- BC Influence: Deposits of black carbon lower snow reflectivity, increase heat absorption, and accelerate glacier melt.
- Population Risk: Glacier loss threatens the freshwater supply for nearly 2 billion people downstream.
- Increase in Snow Depth: Despite warming, average snow depth rose from 0.059 m to 0.117 m.
- Reasons: This is due to more snowfall, changing precipitation, and wind redistribution.
- Regional Comparison: The Western Himalayas showed highest snow depth, linked to elevation and winter storms, while the Eastern and Central Himalayas had less snow due to proximity to BC sources.
| [UPSC 2017] Consider the following statements:
1. Climate and Clean Air Coalition (CCAC) to Reduce Short-Lived Climate Pollutants is a unique initiative of G20 group of countries; 2. The CCAC focuses on methane, black carbon and hydrofluorocarbons. Which of the statements given above is/are correct? Options: (a) 1 only (b) 2 only* (c) Both 1 and 2 (d) Neither 1 nor 2 |
Get an IAS/IPS ranker as your 1: 1 personal mentor for UPSC 2024
Air Pollution
Expert Committee recommends ending mandatory Flue Gas Desulphurisation (FGD)
Why in the News?
A high-powered committee chaired by Principal Scientific Advisor (PSA) Ajay Sood has proposed that India should discontinue the mandatory use of Flue Gas Desulphurisation (FGD) units in most coal-fired Thermal Power Plants (TPPs).
Why mandatory FGDs are opposed?
|
About Flue Gas Desulphurisation (FGD):
- Purpose: FGD is a technology used to remove sulphur dioxide (SO₂) from flue gases produced by burning coal and oil, especially in thermal power plants.
- Environmental Benefit: It helps prevent acid rain, which harms crops, buildings, soils, and aquatic ecosystems.
- Chemicals Used: Common absorbents include limestone (CaCO₃), lime (CaO), and ammonia (NH₃).
- Types of Systems:
-
- Dry Sorbent Injection: Cost-effective, but less efficient.
- Wet Limestone-Based: Effective and used in large plants, produces gypsum.
- Seawater-Based: Uses alkaline seawater, ideal for coastal areas.
FGD Mandate in India:
- Current Status: FGD units are being installed in 537 coal-based thermal power units, but 92% of India’s 600 plants still lack them.
- Committee Recommendation: An expert panel advised exempting 80% of plants from FGD requirements due to feasibility issues.
- Implementation Barriers: Limited vendors available; High costs and risk of increased electricity tariffs.
| [UPSC 2023] Consider the following:
1. Carbon monoxide 2. Nitrogen oxide 3. Ozone 4. Sulphur dioxide Excess of which of the above in the environment is/are cause(s) of acid rain? Options: (a) 1, 2 and 3 (b) 2 and 4 only* (c) 4 only (d) 1, 3 and 4 |
Get an IAS/IPS ranker as your 1: 1 personal mentor for UPSC 2024
Air Pollution
[13th May 2025] The Hindu Op-ed: How is shipping industry tackling emissions?
PYQ Relevance:[UPSC 2022] Discuss global warming and mention its effects on the global climate. Explain the control measures to bring down the level of greenhouse gases which cause global warming, in the light of the Kyoto Protocol, 1997. Linkage: The shipping industry’s contribution to GHG emissions (approximately 1 billion metric tonnes annually, about 2.8% of total global emissions) and the IMO’s efforts to reduce these emissions to align with goals like the Paris Agreement. The question’s focus on international climate agreements (Kyoto Protocol) is relevant to the IMO’s regulatory efforts. |
Mentor’s Comment: The adoption of the Net Zero Framework, which is based on Market-Based Measure (MBM) by the International Maritime Organization (IMO) to regulate and reduce greenhouse gas (GHG) emissions from international shipping, marking a historic shift in global climate governance. It highlights the geopolitical negotiations, competing national interests, and the struggle to balance environmental effectiveness with economic fairness in formulating a global carbon levy on shipping emissions.
Today’s editorial talks about regulation of greenhouse gas (GHG) emissions from international shipping. This topic is useful for GS Paper II (International Relations and Policy Making) and GS Paper III (Environment).
_
Let’s learn!
Why in the News?
At the Marine Environment Protection Committee (MEPC-83) session of the IMO, a major step was taken by approving a new system to cut shipping emissions.
What is the International Maritime Organisation (IMO)?The International Maritime Organization (IMO) is a United Nations specialized agency responsible for regulating international shipping, promoting maritime safety, environmental protection, legal matters, and technical cooperation among member states. |
Why is it a landmark step?
- First Legally Binding Global Emission Levy: Shipping is the first industry with a mandatory, global emissions levy under the MARPOL treaty—unlike aviation (ICAO) or manufacturing, which follow voluntary or regional norms.
- Equity Through CBDR-RC: The mechanism incorporates equity—ZNZ fuel users are rewarded, while underperformers bear the financial burden, aligning with developing countries’ interests.
- Clear, Time-Bound Targets: IMO sets concrete milestones: 40% cut in carbon intensity by 2030, 70% by 2040, and net-zero by 2050—unlike ICAO’s vague goals.

What were the challenges while taking this step?
- Resisted by the Oil-Exporting Nations: Countries like Saudi Arabia, which depend heavily on fossil fuel exports, opposed stringent carbon levies, fearing these would harm their economies. They resisted the transition to green fuels, advocating for minimal changes.
- Developed vs. Developing Countries: Developed nations like the EU supported aggressive emission reductions, while developing countries like China pushed for a market-driven approach to preserve competitiveness and avoid excessive financial burdens.
How is the shipping industry tackling emissions as per the IMO?
- Reduction of GHG emissions: The International Maritime Organization (IMO) has implemented measures like the Energy Efficiency Design Index and the Ship Energy Efficiency Management Plan to reduce carbon emissions from ships.
- Targets for carbon intensity: The IMO has set a goal to reduce carbon intensity by at least 40% by 2030 (compared to 2008 levels) and 70% by 2040, with the ultimate aim of achieving net-zero emissions by 2050.
- Green technologies and fuel alternatives: The IMO is pushing for cleaner fuels and innovative technologies for emissions reduction, including efforts in alternative fuels such as green hydrogen.
What is the Net Zero Framework adopted by the IMO?The Net Zero Framework is a Market-Based Measure (MBM) to reduce emissions in the shipping industry. It aims to implement a mandatory emissions levy on global shipping to ensure that the sector meets net-zero targets by 2050. How would it work?
|
How will the Market-Based Measure (MBM) framework impact India’s maritime sector and trade costs by 2030 and 2050?
- Trade Costs: The MBM framework is likely to increase shipping costs due to carbon pricing and fuel surcharges, making Indian exports less competitive. Eg: Textile and agricultural exports from India to Europe may become costlier by 2030 due to EU’s Emission Trading System (ETS) expansion to maritime transport.
- Equity Concerns: Uniform carbon levies do not consider developmental disparities, placing a higher burden on countries like India with limited historical emissions. Eg: India has argued at the IMO that MBMs should reflect Common But Differentiated Responsibilities (CBDR), as it is still building infrastructure and trade capacity.
- Green Shipping Transition: To comply with decarbonization norms by 2050, India must shift to alternative fuels (e.g., green hydrogen, ammonia) and upgrade port infrastructure, requiring massive investments. Eg: Jawaharlal Nehru Port Trust may need to install green bunkering facilities and electrified cargo handling systems.
- Technological and Financial Gaps: Lack of access to clean technology and climate finance may hinder India’s ability to transition smoothly, increasing dependence on foreign solutions. Eg: Advanced nations may dominate green shipbuilding, while Indian shipyards lag due to lack of R&D support and capital.
- Opportunity for Green Growth: If supported with international finance and technology transfer, MBMs can stimulate domestic innovation and green job creation in maritime sectors. Eg: India’s “Green Ports” initiative could align with MBM goals and boost employment in clean energy, retrofitting, and logistics.
Way forward:
- Differentiated Levy Design: IMO should adopt a flexible carbon pricing model that reflects Common But Differentiated Responsibilities (CBDR), allowing developing countries like India room to grow while contributing to climate goals. Eg: Tiered levy based on national capacities and emission intensity.
- Technology Transfer & Climate Finance: Establish dedicated funding mechanisms for green shipping innovation, infrastructure upgrades, and capacity building in developing nations. Eg: An IMO-led global Green Maritime Fund supported by developed countries.
Get an IAS/IPS ranker as your 1: 1 personal mentor for UPSC 2024
Air Pollution
Hydrogen versus Battery: The Cost of Clean Public Transport
Why in the News?
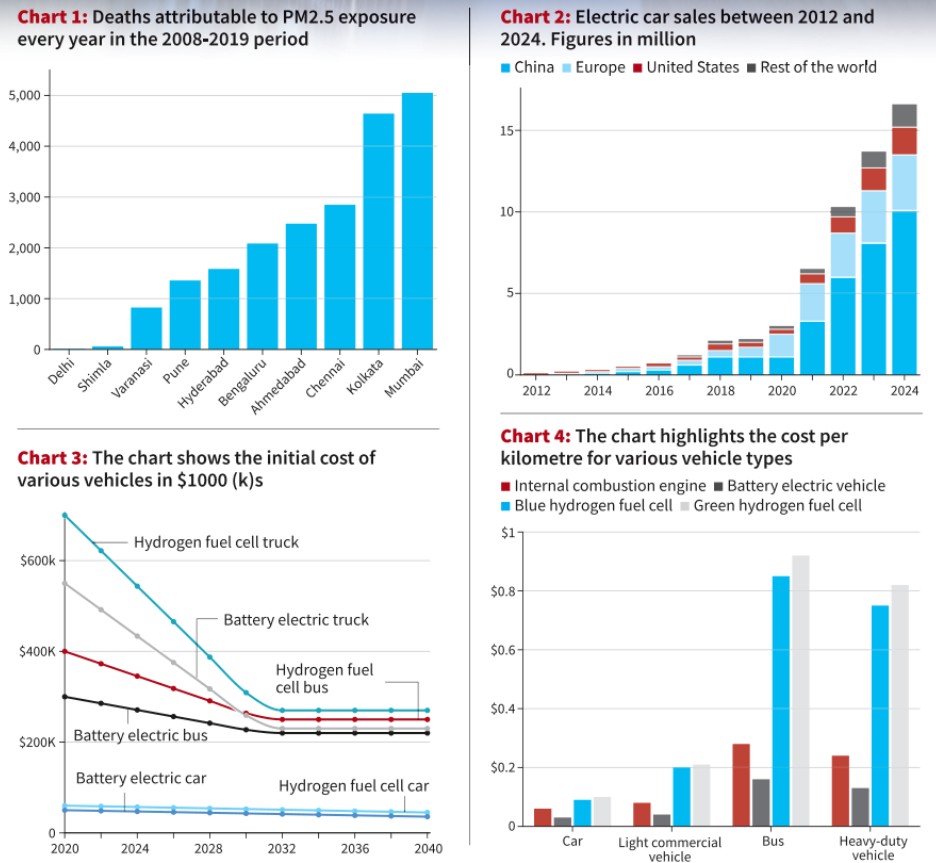
In India, a study published in The Lancet found that between 2008 and 2019, breathing in high levels of PM2.5 air pollution for short periods caused around 30,000 deaths each year in 10 major cities—making up about 7.2% of all deaths in those areas.
What are the major health impacts of urbanisation-related air pollution in Indian cities, as reported by the Lancet study?
|
Why are Fuel Cell Electric Vehicles (FCEVs) considered more suitable for long-distance travel and extreme conditions despite their low adoption?
- Longer Driving Range: FCEVs offer greater range than battery electric vehicles (BEVs) due to the higher energy density of hydrogen fuel. Eg: Hydrogen-powered vehicles can travel 500–700 km on a single tank, ideal for intercity transport.
- Quick Refuelling Time: FCEVs can be refuelled in just 5–15 minutes, similar to petrol or diesel vehicles, unlike BEVs which may take hours to recharge. Eg: Hydrogen buses can be quickly refuelled during breaks, making them suitable for continuous long-haul operations.
- Better Performance in Cold Weather: FCEVs are less affected by cold temperatures, which often reduce the efficiency and range of battery-powered vehicles. Eg: FCEVs are more reliable in regions with harsh winters like high-altitude or Himalayan areas.
- Lighter Vehicle Weight: Hydrogen fuel cells are generally lighter than large lithium-ion battery packs, improving efficiency and payload capacity. Eg: Fuel cell trucks can carry more cargo weight over rugged terrain compared to heavier BEVs.
- Ideal for Heavy-Duty and Rugged Use: Due to their durability and efficiency, FCEVs are well-suited for buses, trucks, and long-range vehicles on varied terrains. Eg: Countries like Japan and South Korea are deploying hydrogen buses for public transport in hilly and industrial regions.
Which countries and regions are leading in global electric car sales and how does India compare?
| Country/Region | 2023 EV Sales | Market Share | Key Highlights |
| China | 9.05 million | 37% of total car sales | World’s largest EV market; accounts for ~58% of global EV consumption |
| Europe | 3.02 million | 24% of total car sales | Strong adoption in countries like Norway, Germany, and the Netherlands |
| United States | 1.39 million | 9.5% of total car sales | Third-largest EV market globally |
| India | 80,000 | ~5% of total car sales | Rapid growth; EV sales nearly doubled in 2023; leading in electric three-wheeler sales |
When will hydrogen vehicle costs match battery-electric vehicles?
- Cost Convergence Expected by 2030: Experts predict that the initial purchase cost of hydrogen Fuel Cell Electric Vehicles (FCEVs) will match that of BEVs by around 2030, due to advancements in hydrogen fuel cell technology and mass production. Eg: A hydrogen-powered bus may cost the same as a battery-electric bus by 2030, narrowing today’s 20–30% cost gap.
- Technology and Manufacturing Scale-Up: As production scales up, the cost of fuel cells, hydrogen storage systems, and related components is expected to fall significantly. Eg: Mass production of hydrogen tanks and cheaper catalysts could lower vehicle costs similar to how lithium-ion battery costs declined over time.
- Infrastructure Development and Government Support: Increased investment in hydrogen refuelling infrastructure and government subsidies are crucial for cost parity. Eg: Japan and South Korea are funding hydrogen highways and offering tax incentives to make hydrogen cars more affordable.
- Operational Costs to Remain High: While initial costs may match BEVs by 2030, running costs are expected to remain significantly higher beyond that due to fuel prices. Eg: Operating a green hydrogen bus currently costs around $0.91/km, compared to $0.17/km for electric buses.
- Limited Market Segments for Parity: Cost matching is likely only in specific segments like heavy-duty transport, not across all vehicle categories. Eg: Long-haul hydrogen trucks may achieve cost parity with electric trucks sooner than passenger cars due to their high utility.
What are the steps taken by the Indian Government?
|
Way forward:
- Enhance R&D and Subsidies: Support innovation and provide financial incentives to reduce the cost of hydrogen vehicles and fuel.
- Build Targeted Infrastructure: Develop hydrogen refuelling stations along key freight corridors and urban hubs.
Mains PYQ:
[UPSC 2024] How do electric vehicles contribute to reducing carbon emissions and what are the key benefits they offer compared to traditional combustion engine vehicles?
Linkage: Electric vehicles (which often implies BEVs) and their role in reducing carbon emissions, aligning with the “clean public transport”.
Get an IAS/IPS ranker as your 1: 1 personal mentor for UPSC 2024
Air Pollution
Greenhouse Gases Emissions Intensity (GEI) Targets
Why in the News?
The Environment Ministry has released the Draft Greenhouse Gas Emissions Intensity (GEI) Target Rules, 2025, as part of the government’s efforts to reduce greenhouse gas emissions (GHGs) from energy-intensive sectors.
About Greenhouse Gases Emissions Intensity (GEI):
- GHGs trap heat in the Earth’s atmosphere, contributing to global warming.
- Major GHGs include carbon dioxide (CO2), methane (CH4), nitrous oxide (N2O), and synthetic fluorinated gases (CFCs, HCFCs).
- GEI measures the amount of GHGs emitted per unit of output (e.g., per tonne of product like cement or aluminium).
- It uses tCO2e (tonnes of CO2 equivalent) to account for the impact of all GHGs.
- Reducing GEI is vital to mitigate climate change, promoting the use of cleaner technologies in industries to lower environmental footprints.
Key Provisions of Draft GEI Target Rules, 2025:
- Target Setting for Industries: Specific emission intensity reduction targets are set for energy-intensive sectors like aluminium, cement, and pulp and paper, for the periods 2025-26 and 2026-27.
- Baseline Emissions & Gradual Reduction: Baseline GHG emissions for 2023-24 are established, with targets for gradual reduction over time.
- Carbon Credit Trading Scheme (CCTS): Industries meeting GEI targets will earn carbon credits that can be traded on India’s carbon market. Those failing to meet targets will need to buy credits or face penalties.
- Sector-Specific Applicability: Targets apply to 13 aluminium plants, 186 cement plants, 53 pulp and paper plants, and 30 chlor-alkali plants.
- Penalties & Incentives: Non-compliant industries must buy carbon credits or face penalties. The rules encourage clean technologies, like using biomass instead of coal in production.
- Alignment with Paris Agreement: The rules support India’s climate commitments, aiming for a 45% reduction in emissions intensity of GDP by 2030 compared to 2005 levels.
- Monitoring & Compliance: The Bureau of Energy Efficiency (BEE) will oversee the carbon credit market, ensuring compliance through regular progress reports from industries.
| [UPSC 2022] Climate Action Tracker’ which monitors the emission reduction pledges of different countries is a:
Options: (a) Database is created by coalition of research organisations* (b) Wing of “International Panel of Climate Change” (c) Committee under “United Nations Framework Convention on Climate Change” (d) Agency promoted and financed by United Nations Environment Programme and World Bank |
Get an IAS/IPS ranker as your 1: 1 personal mentor for UPSC 2024
Air Pollution
Air pollution in India — where does it come from?
Why in the News?
Millions of people die early because of dirty air. But where does this air pollution come from?

Where do the majority of sulphur dioxide (SO2) emissions in India come from?
- Energy Production: The largest source of sulphur dioxide (SO2) emissions in India is energy production, primarily from coal-fired power plants. Eg, coal contains sulphur impurities that are released when it is burned, contributing significantly to SO2 pollution.
- Industrial Activities: Industries like cement production, steel manufacturing, and chemical plants also release SO2. Eg, the cement industry, which uses fossil fuels, is a major emitter of this pollutant.
What are the main sources of nitrogen oxides (NOx) emissions?
- Transportation: The largest source of nitrogen oxides (NOx) emissions is transportation, particularly from the exhaust of cars and trucks. Eg, diesel-powered vehicles, which burn fuel less efficiently, produce higher NOx emissions.
- Energy Production: The burning of coal and gas for electricity generation also significantly contributes to NOx emissions. Eg, power plants that burn coal release large amounts of NOx during the combustion process.
- Industrial Activities: Industrial processes such as manufacturing and chemical production also emit NOx. Eg, refineries and other heavy industries use high-temperature processes that release NOx as a byproduct.
What sectors are the biggest contributors to methane (CH4) emissions?
- Agriculture: The largest source of methane emissions, particularly from livestock digestion (enteric fermentation) and rice paddies. Eg, cows and other ruminants produce methane during digestion, and flooded rice fields emit methane as organic matter decomposes anaerobically.
- Waste Management: Methane is released from organic waste decomposing in landfills under anaerobic conditions. Eg, food waste rotting in landfills produces significant methane emissions.
- Fossil Fuel Extraction: Methane is emitted during the extraction, transport, and use of fossil fuels, especially natural gas. Eg, methane leaks from oil and gas pipelines, as well as from coal mines, contributing to atmospheric emissions.
How does agriculture contribute to ammonia (NH3) emissions and their health impacts?
- Agriculture: The application of nitrogen-based fertilizers is a major source of ammonia emissions. Eg, the use of urea fertilizers in crop fields results in ammonia volatilization when applied to the soil, contributing to air pollution.
- Livestock Waste: Ammonia is released from animal manure, especially from large-scale livestock farming. Eg, in intensive dairy and poultry farms, ammonia is emitted from urine and feces, leading to air and water pollution.
- Health Impacts: Ammonia contributes to the formation of fine particulate matter (PM2.5), which can cause respiratory issues, asthma, and premature deaths. Eg, exposure to ammonia-laden air in farming areas has been linked to increased health risks such as lung diseases and cardiovascular problems.
What are the steps taken by the Indian Government?
|
Way forward:
- Shift to Clean Energy: Expand renewable energy use and enforce cleaner technologies in the power and industrial sectors to cut SO₂ and NOₓ emissions.
- Strengthen Enforcement & Awareness: Ensure strict implementation of air quality norms and raise public awareness on pollution-reducing practices.
Mains PYQ:
[UPSC 2022] Discuss in detail the photochemical smog, emphasising its formation, effects and mitigation.
Linkage: Formation of a significant type of air pollution, photochemical smog, which is formed from primary pollutants like Nitrogen oxides (from transport and industry) reacting in the presence of sunlight [209, external knowledge]. Understanding the formation requires knowing the precursor pollutants and their sources.
Get an IAS/IPS ranker as your 1: 1 personal mentor for UPSC 2024
Air Pollution
Particulate Matter Emission Trading Scheme in Gujarat
Why in the News?
A new study highlights the success of Surat’s Particulate Matter Emission Trading Scheme (PM-ETS), the world’s first market-based system for trading particulate emissions.
The scheme has reduced pollution by 20-30%, providing insights into its potential to improve air quality in industrial areas.
About Particulate Matter Emission Trading Scheme in Gujarat:
- This PM ETS was launched in Surat, Gujarat in 2019.
- It is the world’s first pilot project targeting particulate pollution using a market-based emissions trading system.
- It is India’s first emissions trading initiative for any pollutant.
- The scheme aims to reduce emissions from industries using solid (coal, lignite) and liquid fuels (diesel) by controlling fine particulate matter (PM).
- How It Works?
- Cap-and-Trade: Regulators set a cap on total emissions, and industries are issued permits (1 kg of particulate matter per permit).
- Permit Allocation: 80% of permits are given for free; 20% are sold via auctions.
- Market Trading: Permits can be bought or sold to meet emission targets. A ceiling price (Rs 100/kg) and floor price (Rs 5/kg) are set.
- Compliance: Non-compliant industries face fines double the ceiling price for each excess emission.
Successes of PM-ETS:
- Reduction in Emissions: Participating plants cut emissions by 20-30% compared to traditional methods.
- Improved Compliance: 99% compliance in participating plants.
- Cost-Effective: The system allowed industries to choose the most cost-effective methods for compliance.
Limitations of PM-ETS:
- Over-reliance on Free Permits: Smaller plants may struggle as the number of free permits decreases.
- Supply Chain Limitations: Tightened caps could increase costs for industries not reducing emissions.
- Market Manipulation: Concerns over unfair permit trading.
- Geographical Constraints: Limited to Surat, restricting broader impact.
| [UPSC 2011] Regarding “carbon credits’’, which one of the following statements is not correct?
(a) The carbon credit system was ratified in conjunction with the Kyoto protocol. (b) Carbon credits are awarded to countries or groups that have reduced greenhouse gases below their emission quota. (c) The goal of the carbon credit system is to limit the increase of carbon dioxide emission. (d) Carbon credits are traded at a price fixed from time to time by the United Nations environment programs. * |
Get an IAS/IPS ranker as your 1: 1 personal mentor for UPSC 2024
Air Pollution
What is Flue Gas Desulphurisation (FGD)?
From UPSC perspective, the following things are important :
Prelims level: Flue Gas Desulphurisation (FGD)
Why in the News?
The Union Environment Ministry’s 2015 policy mandating the installation of Flue Gas Desulphurisation (FGD) equipment in all of India’s 537 coal-fired plants has been scrutinised by a recent study commissioned by the Office of the Principal Scientific Adviser.

About Flue Gas Desulphurisation (FGD) in Power Plants
- FGD is used to remove sulfur dioxide (SO₂) from flue gases in coal-fired power plants.
- The process involves passing exhaust gases through a scrubbing system using absorbents like ammonia, sodium sulfite, or limestone.
- Methods:
- Wet Limestone Scrubbing: Gases pass through a scrubber tower with a slurry of water and limestone.
- Dry Sorbent Injection: Uses a dry alkaline agent to neutralize SO₂.
- Sea Water-Based Systems: Utilizes seawater’s natural alkalinity to absorb SO₂.
- FGD can remove up to 95% of sulfur dioxide, reducing SO₂ emissions significantly.
- Reduces sulfur emissions, major contributors to acid rain and air pollution.
- FGD Gypsum, a byproduct, can be used in industries like cement manufacturing.
Recent Study on FGD in Power Plants
- A study by NIAS critiques India’s FGD policy, recommending limited FGD installations for plants using imported or high-sulfur coal.
- 92% of coal in Indian plants has low sulfur content (0.3%-0.5%), meaning FGD may not significantly improve local air quality.
- Widespread FGD installation could increase power and water consumption, and result in 69 million tonnes of additional CO₂ emissions by 2030.
- Removing SO₂ (cooling agent) while increasing CO₂ emissions may accelerate climate change.
- Recommendations: Installing electrostatic precipitators (₹25 lakh per MW) can reduce 99% of particulate matter (PM), offering a more cost-effective and impactful solution.
| [UPSC 2024] According to the Environmental Protection Agency (EPA), which one of the following is the largest source of sulphur dioxide emissions?
(a) Locomotives using fossil fuels (b) Ships using fossil fuels (c) Extraction of metals from ores (d) Power plants using fossil fuels* |
Get an IAS/IPS ranker as your 1: 1 personal mentor for UPSC 2024
Air Pollution
How govern-mentality exacerbates the problem of farmers’ stubble burning
Why in the News?
A new study by researchers Sujit Raghunathrao Jagadale and Javed M. Shaikh from IIM Amritsar looks at the issue of stubble burning by examining how government policies and market systems are failing to manage the problem effectively.

Why do farmers continue stubble burning despite its harm to air quality?
- Cost-Effective Method: Stubble burning is the cheapest way for farmers to clear their fields after harvesting. Eg: Farmers burn stubble to quickly prepare their land for the next crop, especially for wheat, without incurring high labor or machinery costs.
- Lack of Affordable Alternatives: There are limited affordable and efficient alternatives to stubble burning. Eg: Farmers often do not have access to technology or subsidies for machines that can manage stubble, such as Happy Seeder or bio-decomposers.
- Government’s Focus on High-Yield Crops: The Minimum Support Price (MSP) policy incentivizes the cultivation of wheat and rice, leading to monocropping. Eg: Farmers are encouraged to grow rice continuously, which results in an abundance of stubble that needs to be disposed of quickly.
- Debt and Economic Pressure: Many farmers face financial pressures, including debt and low returns on their crops, which makes burning stubble a way to save time and money. Eg: Farmers often sell their crops to middlemen at low prices, leaving them with insufficient income to invest in sustainable farming practices.
- Lack of Strong Enforcement or Support: Although stubble burning is penalized, enforcement of laws is weak, and farmers often feel the state does not provide adequate support for eco-friendly methods. Eg: Despite penalties, farmers feel little pressure to change practices when there is insufficient governmental support or infrastructure for alternatives.
How does India’s MSP policy influence stubble burning?
- Encourages Monocropping: The MSP policy promotes the cultivation of high-yield crops like rice and wheat, leading to monocropping, which results in a large amount of stubble that must be cleared. Eg: Farmers in Punjab often grow rice followed by wheat, creating a cycle where large quantities of rice stubble need to be burned to prepare the soil for the next crop.
- Limits Crop Diversification: The MSP system prioritizes wheat and rice over other crops, making it economically unfeasible for farmers to switch to more sustainable practices or crops that would reduce stubble burning. Eg: Despite the potential for growing other crops, farmers focus on rice and wheat to benefit from MSP, leaving them with stubble that they have no economically viable option to manage.
- Financial Constraints: The MSP rates for crops like rice and wheat have remained stagnant, making it harder for farmers to invest in alternatives to stubble burning, such as machinery or composting. Eg: With wheat MSP seeing only minimal increases, farmers struggle to cover costs for labor and inputs, leading them to resort to stubble burning as the most cost-effective option to clear fields.
What has the government done in this situation?
|
Way forward:
- Promote Crop Diversification: Encourage farmers to shift from paddy to less water-intensive and non-stubble-generating crops through assured procurement and better MSP for alternative crops. Eg: Incentivize crops like millets and pulses to reduce stubble generation.
- Strengthen Support and Infrastructure: Scale up access to sustainable stubble management technologies and ensure timely financial and logistic support to small and marginal farmers. Eg: Expand reach of Happy Seeder and bio-decomposer solutions through local cooperatives and custom hiring centers.
Mains PYQ:
[UPSC 2015] Mumbai, Delhi and Kolkata are the three Mega cities of the country but the air pollution is much more serious probelm in Delhi as compared to the other two. Why is this so?
Linkage: Delhi’s severe air pollution, especially at certain times of the year, is caused by a combination of its location in the Indo-Gangetic Plain, nearby states burning crop stubble, and weather conditions that trap pollutants.
Get an IAS/IPS ranker as your 1: 1 personal mentor for UPSC 2024
Air Pollution
[pib] Indian researchers introduce ‘Toxicity Standard’ of PM2.5 Pollution
Why in the News?
A recent study conducted in Kolkata shows that the toxicity value of PM2.5 experiences a sudden jump when the pollution level reaches around 70 µg/m³.
About PM2.5
- PM2.5 refers to fine particulate matter with a diameter of 2.5 micrometers or smaller.
- It is a major air pollutant linked to respiratory and cardiovascular diseases. Long-term exposure increases the risk of lung cancer, heart disease, asthma, and other health issues.
- Major sources include vehicle exhaust, industrial emissions, construction dust, biomass burning, and solid waste burning, contributing to both outdoor and indoor pollution.
- WHO recommends that the annual average PM2.5 concentration should NOT exceed 5 µg/m³, and the 24-hour average should not exceed 15 µg/m³ for more than 3-4 days per year.
PM2.5 on Govt. Focus: National Clean Air Program (NCAP)
|
About the Notified Toxicity Standard for PM2.5
- A new toxicity standard for PM2.5 in Kolkata sets the critical threshold at 70 µg/m³.
- Below this level, toxicity remains stable, but it sharply increases once the concentration exceeds 70 µg/m³.
- It emphasizes reducing pollution sources, particularly biomass and solid waste burning, which contribute significantly to high PM2.5 levels and increased toxicity in Kolkata.
- Policy Recommendation: To reduce health risks, air quality control measures should aim to keep PM2.5 levels below 70 µg/m³.
| [UPSC 2022] In the context of WHO Air Quality Guidelines, consider the following statements:
1. The 24-hour mean of PM2.5 should not exceed 15 µg/m3 and annual mean of PM2.5 should not exceed 5 µg/m3. 2. In a year, the highest levels of ozone pollution occur during the periods of inclement weather. 3. PM10 can penetrate the lung barrier and enter the bloodstream. 4. Excessive ozone in the air can trigger asthma. Which of the statements given above are correct? (a) 1, 3 and 4 (b) 1 and 4 only (c) 2, 3 and 4 (d) 1 and 2 only |
Get an IAS/IPS ranker as your 1: 1 personal mentor for UPSC 2024
Air Pollution
Study identifies sources of PM2.5 in northern India
From UPSC perspective, the following things are important :
Prelims level: PM 2.5
Why in the News?
A recent study published in Nature Communications has analyzed the sources and health impacts of PM2.5 pollution in Northern India, particularly in the Indo-Gangetic Plain.
About PM2.5
- PM2.5 (Particulate Matter ≤2.5 microns) refers to tiny air pollutants small enough to penetrate deep into the lungs and enter the bloodstream.
- These fine particles come from both natural sources (like dust storms and wildfires) and human activities (like burning fossil fuels and industrial emissions).
- PM2.5 poses severe health risks, contributing to respiratory diseases, heart conditions, and reduced lung function.
- The oxidative potential of PM2.5 is an important indicator of its toxicity and ability to cause cellular damage.
Key Findings of the Study
- Major Sources of PM2.5 in Northern India:
- The study analyzed PM2.5 pollution across five locations in the Indo-Gangetic Plain, including Delhi and Kanpur.
- Delhi: PM2.5 is mainly from vehicular emissions, fossil fuel burning, and residential heating.
- Outside Delhi: It consists of ammonium sulfate, ammonium nitrate, and biomass-burning aerosols.
- PM2.5 Toxicity and Health Risks:
- PM2.5 toxicity is linked to organic aerosols from inefficient combustion of biomass and fossil fuels.
- Traffic emissions and residential fuel burning significantly contribute to PM2.5-related health risks.
- Traffic as a Major Contributor:
- Hydrocarbon-like organic aerosols (HOA) from vehicular emissions were highest at urban roadside sites in Delhi (8 μg/m³).
- HOA accounts for 50% of fossil fuel-derived aerosols, increasing to 40% in warmer months.
- Winter Pollution Due to Residential Heating and Cooking:
- Cow dung combustion for heating and cooking in winter increases organic aerosols, with levels 10 times higher than in summer due to biomass burning and shallow boundary layers.
- India’s PM2.5 Toxicity Among the Highest Globally:
- The study found that PM2.5 oxidative potential (toxicity) in Indian cities is up to 5 times higher than in Chinese and European cities.
PYQ:[2016] In the cities of our country, which among the following atmospheric gases are normally considered in calculating the value of the Air Quality Index?
Select the correct answer using the code given below: (a) 1, 2 and 3 only |
Get an IAS/IPS ranker as your 1: 1 personal mentor for UPSC 2024
Air Pollution
[27th February 2025] The Hindu Op-ed: Coal power is costing India up to 10% of its rice and wheat crops
PYQ Relevance:Q) “In spite of adverse environmental impact, coal mining is still inevitable for Development”. Discuss. (UPSC CSE 2017) |
Mentor’s Comment: UPSC mains have always focused on the diverse environmental impact of coal (2017), and environmental impacts of coal-fired thermal plants(2014).
India relies on coal for 65% of its electricity due to its low cost and large reserves. Coal-fired power plants release harmful gases like CO₂, SOx, NOx, and particulate matter, causing pollution and climate issues. Using Low NOx Burners with Over Fire Air technology can reduce NOx emissions by 45-80% without affecting power generation.
Today’s editorial discusses pollution caused by coal-fired power plants in India. This information is relevant for GS Paper 3 in the UPSC Mains exam.
_
Let’s learn!
Why in the News?
New research from Stanford University in the US shows that coal-fired power plants are reducing India’s rice and wheat production, causing up to a 10% loss in several states.
Why did the researchers focus on nitrogen dioxide (NO₂) emissions?
- Phytotoxic Effects on Crops: NO₂ is phytotoxic, meaning it directly harms plant health by interfering with cellular functions and enzymatic activities. Example: In agricultural areas near coal plants, NO₂ exposure leads to lower chlorophyll levels, reducing plant vitality and yield.
- Formation of Secondary Pollutants: NO₂ contributes to the formation of ground-level ozone, which further damages crops by limiting photosynthesis and causing oxidative stress. Example: Increased ozone formation near coal hubs like Chhattisgarh exacerbates crop loss during peak growing seasons.
- Limited Existing Research in India: While global studies link NO₂ to agricultural damage, there was no systematic study at the power-plant level in India. Example: This research fills the gap by connecting NO₂ emissions from coal plants directly to wheat and rice yield losses.
- Satellite Data Availability: Advanced satellites like TROPOMI allow precise tracking of NO₂ concentrations, making it easier to study the pollutant’s widespread effects. Example: Researchers used satellite-derived vegetation indices (NIRv) to measure crop health across polluted regions.
- High Contribution from Coal Plants: Coal-fired power plants are a major source of NO₂ emissions, especially in industrial and agricultural belts. Example: In Chhattisgarh, around 19% of monsoon-season NO₂ comes from coal plants, causing significant crop damage.
How does this pollutant impact plant health and crop yield?
- Disruption of Photosynthesis: NO₂ reduces the amount of sunlight available for photosynthesis by forming secondary pollutants like particulate matter. This limits energy production in plants. Example: In areas near coal plants, reduced sunlight exposure leads to a 5-10% decline in rice and wheat yields in states like West Bengal and Madhya Pradesh.
- Cellular and Enzymatic Damage: NO₂ interferes with crucial cellular processes and enzymatic functions, weakening plant growth and reducing their ability to absorb nutrients. Example: Crops exposed to high NO₂ levels in Chhattisgarh show slower growth and lower productivity, especially during peak seasons.
- Ozone Formation and Oxidative Stress: NO₂ contributes to ground-level ozone, which causes oxidative stress in plants, leading to leaf damage and reduced crop yields. Example: In Uttar Pradesh, where overall NO₂ levels are high, wheat crops suffer significant losses due to ozone-induced stress during the winter season.
Which states show the highest agricultural losses?
- Chhattisgarh: The most affected region with the highest share of NO₂ pollution from coal plants (19% during the monsoon and 12.5% in winter). It is a major hub for coal-fired power generation, leading to severe air pollution and crop yield losses.
- West Bengal: There are significant NO₂ exposure from coal plants that affects 5.7% of cropland, with yield losses between 5-10% and even greater than 10% in some areas. The proximity of coal plants to fertile agricultural zones increases the impact on rice and wheat production.
- Madhya Pradesh: About 5.9% of cropland near coal plants experiences 5-10% yield losses, while 11.9% of agricultural land could face losses exceeding 10%.
- Uttar Pradesh: High overall NO₂ pollution, but only a small portion originates from coal-fired power plants. The other industrial sources dominate NO₂ emissions, yet coal plants still add to the burden on winter wheat yields.
- Tamil Nadu: Low overall NO₂ levels but a large share comes from coal plants, disproportionately affecting local agriculture. The concentration of coal-fired power plants contributes a substantial portion of the region’s air pollution.
What steps have been taken by the Indian government?
- Increased Budget Allocation for Coal Sector: The 2025-2026 Union Budget has increased the allocation for the Ministry of Coal by 255% over the revised estimates of FY 2024-2025, reflecting a focus on managing coal resources and addressing environmental concerns.
- Pollution Control Mandates: The government has introduced emission norms for coal-fired power plants, requiring the installation of pollution control equipment like Flue Gas Desulphurization (FGD) to reduce nitrogen oxides (NO₂) and other pollutants.
- Renewable Energy Promotion: Policies such as the National Solar Mission and incentives for renewable energy aim to reduce coal dependency and minimize air pollution while promoting cleaner energy alternatives.
Way forward:
- Strengthen Emission Regulations: Implement stricter NO₂ emission limits for coal-fired power plants, enforce regular monitoring, and expedite the adoption of advanced pollution control technologies like selective catalytic reduction (SCR).
- Promote Sustainable Agriculture and Clean Energy: Support farmers in NO₂-affected regions with resilient crop varieties and promote a transition to renewable energy through increased investment in solar and wind infrastructure.
Get an IAS/IPS ranker as your 1: 1 personal mentor for UPSC 2024
Air Pollution
Parliamentary Panel recommends Paddy Residue MSP to curb Stubble Burning
From UPSC perspective, the following things are important :
Mains level: Pollution related issues; MSP;
Why in the News?
Recently, a parliamentary committee, led by Rajya Sabha MP Milind Deora, has suggested setting a minimum support price (MSP) for paddy residue. This aims to discourage farmers from burning stubble, which is a major cause of air pollution in Delhi.
What were the observations made by the Parliamentary standing committee?
- Stubble Burning as a Key Cause of Air Pollution: The committee acknowledged that stubble burning in Punjab and Haryana significantly contributes to Delhi’s air pollution during winter.
- Farmers’ Constraints: Farmers burn stubble due to a short window (25 days) between paddy harvesting and wheat sowing.
- State-wise Disparities: Punjab generates 16.1 million tonnes of non-basmati paddy straw annually, while Haryana generates only 4.04 million tonnes. Punjab also reported 10,990 stubble-burning incidents in 2023-24, compared to Haryana’s 1,406.
- Existing Government Schemes: The Central government provides subsidies for crop residue management machinery, but high fuel costs make their usage unfeasible for many farmers.
- Incentive Gap: Haryana provides higher financial support (₹7,000/acre for crop diversification, ₹4,000 for direct seeding of rice), whereas Punjab offers only ₹1,500 for direct seeding.
- Technological Gaps: Even after mechanized harvesting, 10-15 cm of stubble remains in fields, which cannot be manually cleared due to labour shortages.
What recommendations were given by the Panel?
- Minimum Price for Paddy Residue: Establish a mechanism to determine a minimum price for paddy residue, similar to the Minimum Support Price (MSP) for crops, in consultation with the Commission for Air Quality Management (CAQM). The benchmark price should be announced before the Kharif season to reflect residue collection costs.
- Promote Short-Duration Paddy Varieties: Urge state governments to promote short-duration paddy varieties instead of long-duration ones like PUSA 44.
- Unified National Policy: Implement a unified national policy to integrate agricultural residue into bioenergy generation, ensuring inter-ministerial coordination.
- Real-time Forecasting: Establish real-time mapping of crop acreage and forecasting of crop maturity and weather patterns to estimate land under cultivation and assess district-wise crop yields for better planning.
- Storage Facilities: Set up interim storage facilities in districts where industries or end-users are not available within a 20–50 km range to facilitate efficient crop residue collection and transport.
- Incentives and Subsidies: Provide incentives for the transportation of stubble to discourage in-field burning and subsidize machinery for in-situ paddy straw management. Farmers should get a 50 percent subsidy for machinery and 80 percent for establishing centers for renting out machines for managing paddy straw.
- Technological Advancements: Develop technology that combines the work of harvesters and cutters to completely clear stubble from fields and promote early-maturing crop varieties.
What is Delhi govt’s 20-point Winter Action Plan?
- Real-Time Monitoring and Special Task Force: The plan includes the use of drones for real-time monitoring of pollution hotspots, marking a shift from manual inventory methods. Additionally, a special task force will be formed to oversee pollution control efforts and ensure compliance with regulations across various sectors.
- Control Measures for Pollution Sources: The action plan emphasizes controlling dust pollution through increased water sprinkling, deployment of anti-smog guns, and strict regulations on construction sites. It also addresses vehicular emissions by promoting work-from-home policies and considering the implementation of an odd-even vehicle rationing scheme during high pollution days.
- Public Participation and Emergency Measures: The plan encourages public involvement through campaigns and initiatives aimed at reducing pollution, such as banning firecrackers and promoting eco-friendly practices.
- Emergency measures like artificial rain are also proposed to mitigate severe pollution events expected around Diwali and during stubble burning seasons.
Way forward:
- Sustainable Agricultural Practices & Farmer Incentives: Strengthen financial incentives for crop residue management, promote widespread adoption of short-duration paddy varieties, and enhance technological solutions for complete stubble removal to reduce reliance on burning.
- Integrated Pollution Control & Public Awareness: Implement a coordinated air quality management framework involving real-time monitoring, stricter enforcement of emission norms, and large-scale public participation campaigns to promote eco-friendly practices and behavioural change.
Mains PYQ:
Q Mumbai, Delhi and Kolkata are the three Mega cities of the country but the air pollution is much more serious probelm in Delhi as compared to the other two. Why is this so? (UPSC IAS/2015)
Get an IAS/IPS ranker as your 1: 1 personal mentor for UPSC 2024
Air Pollution
[7th February 2025] The Hindu Op-ed: The saga of regulating India’s thermal power emissions
PYQ Relevance:Q) Describe the benefits of deriving electric energy from sunlight in contrast to the conventional energy generation. What are the initiatives offered by our government for this purpose? (UPSC CSE 2020) |
Mentor’s Comment: UPSC mains have always focused on Environmental Impact Assessment studies (2015), and conventional energy generation (2020).
On December 30, 2024, the MoEFCC extended the deadline for thermal plants to meet SO₂ emission norms by three years without explanation. Originally set for December 31, 2024, this delay affects 20 GW of plants near densely populated areas. These norms were set in 2015 to tighten particulate matter limits and introduced SO₂ norms for the first time, aligning them with standards in countries like Australia, China, and the U.S., despite the short timeline for compliance.
Today’s editorial talks about the revised emission norms for Indian thermal plants and impact of these norms. This content will help in GS Paper 3.
_
Let’s learn!
Why in the News?
On December 30, 2024, India’s Ministry of Environment, Forest and Climate Change (MoEFCC) changed the Environment Protection Rules, extending the deadline for thermal power plants to meet sulphur dioxide (SO₂) emission standards by three years without providing any explanation.
What are the revised emission norms for Indian thermal plants?
Note: The categories for compliance with SO₂ emission norms for Indian thermal power plants are based on location and environmental impact. |
What are the challenges around implementing the flue gas desulphurisation (FGD) technology?
- Technical and Financial Hurdles: The implementation of FGD technology has faced delays primarily due to high costs, inadequate supply chains, and operational complexities. Many plants tendered contracts for FGDs but did not progress at a pace necessary to meet earlier deadlines.
- Debate on Necessity: Recent studies commissioned by NITI Aayog and conducted by CSIR-NEERI have questioned the urgency and necessity of FGD installations for improving air quality, suggesting that focus should instead be on particulate emissions. This has led to confusion and varied interpretations of compliance requirements among stakeholders.
How successful has India been in implementing emission norms for thermal power plants?
- Limited Progress: As of late 2024, only about 22 GW of thermal capacity had installed FGDs, which is less than 8% of the total coal-fired power generation capacity in India. The overall progress has been slower than anticipated since the introduction of the norms.
- Compliance Monitoring Issues: There is a lack of transparency regarding adherence to existing norms, as pollution control boards have not consistently verified compliance. This raises concerns about the effectiveness of regulatory oversight.
What are the economic and environmental consequences of noncompliance and what measures are in place to address this?
- Health Impacts: The extension of compliance deadlines poses risks to public health, especially in densely populated areas like Delhi-NCR, where air pollution is already a critical issue. SO₂ is known to contribute to respiratory and cardiovascular diseases.
- Financial Burden on Consumers: Electricity regulators have allowed thermal plants to pass on the costs of installing FGDs to consumers, regardless of whether emission norms are met. This means consumers may end up paying for pollution control equipment that remains unused due to extended compliance timelines.
- Environmental Compensation: For non-compliance beyond specified timelines, MoEFCC has introduced an environmental compensation scheme that penalizes plants based on their duration of non-compliance. This includes fees that escalate over time but may not be sufficient to incentivize timely compliance.
Way forward:
- Strict Enforcement & Incentives – Strengthen regulatory oversight with real-time emissions monitoring, enforce penalties for non-compliance, and provide financial incentives or subsidies to accelerate FGD adoption.
- Balanced Policy Approach – Address technical and financial barriers by improving supply chains, supporting domestic FGD manufacturing, and ensuring a phased yet firm transition while prioritising high-risk areas.
Get an IAS/IPS ranker as your 1: 1 personal mentor for UPSC 2024
Air Pollution
India’s emissions inventory & efforts at mitigation
From UPSC perspective, the following things are important :
Mains level: Initiatives related to climate change;
Why in the News?
India recently shared a report about its efforts to fight climate change. The report includes details about how much greenhouse gases (GHG) the country produces and the steps it has taken to reduce these emissions as part of its global climate promises.
What is the Biennial Update Report (BUR)?
|
What are the BUR-4’s highlights and submissions on emissions inventory?
- Total GHG Emissions: In 2020, India’s total GHG emissions were reported at 2,959 million tonnes of CO2 equivalent. After accounting for land use, land-use change, and forestry (LULUCF), net emissions were 2,437 million tonnes, reflecting a 7.93% decrease from 2019 levels.
- Reduction in Emissions Intensity: The report indicates that from 2005 to 2020, India’s emissions intensity of GDP decreased by 36%. This metric measures GHG emissions per unit of economic output, highlighting improved energy efficiency and a shift towards renewable energy sources.
- Sectoral Contributions: The energy sector was the largest contributor to emissions, accounting for 75.66%, with electricity production alone responsible for 39% of total emissions. Agriculture contributed 13.72%, while industrial processes and waste management accounted for 8.06% and 2.56%, respectively.
What does BUR-4 say about the status of India’s climate commitments?
- The BUR-4 outlines India’s commitment to its Nationally Determined Contributions (NDCs) under the Paris Agreement, aiming for a 45% reduction in GDP emission intensity by 2030 compared to 2005 levels.
- The report notes that between 2005 and 2021, India created an additional carbon sink of approximately 2.29 billion tonnes of CO2 equivalent through enhanced forest and tree cover, contributing significantly to its climate goals.
What has the report said about India’s tech needs for climate-conscious growth? (Way forward)
- Advanced Technologies for Low-Carbon Growth: The report emphasizes the necessity for adopting cutting-edge technologies across various sectors, including solar energy, wind energy, bioenergy, electric vehicles, and carbon capture and storage.
- Capacity Building: Strengthening institutional frameworks and workforce capabilities is essential for effective implementation of climate policies and programs. This involves training personnel and developing skills necessary to manage and operate advanced technologies.
- Financial and Technological Support: The BUR-4 identifies a significant gap in technology transfer from developed countries, which hampers India’s ability to implement necessary climate solutions. India calls for increased international cooperation to facilitate technology transfer, eliminate intellectual property barriers, and provide financial assistance to support its climate initiatives.
- Integration of Technology in Key Sectors: The report highlights the importance of integrating advanced technologies into critical sectors that contribute to emissions, such as agriculture and energy.
Mains PYQ:
Q ‘Clean energy is the order of the day.’ Describe briefly India’s changing policy towards climate change in various international fora in the context of geopolitics. (UPSC IAS/2022)
Get an IAS/IPS ranker as your 1: 1 personal mentor for UPSC 2024
Air Pollution
Beijing’s War Against Air Pollution
From UPSC perspective, the following things are important :
Mains level: Air Pollution; Climate Change; Urbanization and it’s Challenges;
Why in the News?
In 2015, Beijing had an annual average Air Quality Index (AQI) of 144, comparable to Delhi’s current average of 155 in 2024. However, Beijing has since achieved a one-third reduction in its pollution levels, with the most notable decline occurring between 2013 and 2017.
Why discuss Beijing in the context of Delhi?
The comparison between Beijing and Delhi is significant due to their shared status as capitals of emerging economies facing severe air pollution challenges.
- Similar Pollution Levels: In 2015, Beijing had an average AQI of 144, comparable to Delhi’s current average of 155 for 2024. This similarity highlights the potential for improvement in Delhi, as Beijing has successfully reduced its pollution levels significantly since then.

- Common Sources of Pollution: Both cities experience high pollution from similar sources, including vehicular emissions, coal combustion, and industrial activities. The regional contributions to air quality issues are also significant in both cases, particularly during winter months.
- Need for Collective Action: Just as Beijing required a coordinated effort across its region to combat pollution, Delhi must engage neighboring areas in a collective strategy to effectively address its air quality crisis.
What did Beijing do and how did it achieve it?
- Phased and Strategic Planning: Implemented a 20-year anti-pollution programme in three phases (1998-2017) with local government autonomy and public participation to ensure gradual and sustainable progress.
- 1998-2008: Initial groundwork.
- 2009-2012: Strengthening regulations.
- 2013-2017: Aggressive measures termed the “war against air pollution.
- Energy Sector Transition: Shifted from coal to cleaner energy by renovating power plants, eliminating coal boilers, and replacing residential coal heating, reducing major emissions.
- Transportation Reforms: Upgraded public transport infrastructure, introduced emission controls in vehicles, and phased out polluting vehicles with subsidies, reducing transportation-based pollutants.
- Regional Collaboration and Investment: Partnered with five neighboring provinces for coordinated pollution control and increased financial investment sixfold to implement targeted measures effectively.

- Financial Investment: A sixfold increase in investment over four years supported these initiatives, allowing for significant infrastructure improvements and regulatory enforcement.
As a result of these efforts, major pollutants like sulfur dioxide and PM2.5 saw significant reductions (e.g., PM2.5 decreased by 59% between 2013-2017).


What can Delhi learn from the Beijing experience?
- Integrated Public Transport System: Establishing an efficient bus-metro system to reduce reliance on private vehicles is essential. Upgrading the bus fleet and enhancing last-mile connectivity can significantly improve public transport accessibility.
- Energy Transition: Similar to Beijing’s shift away from coal, Delhi should diversify its energy sources by promoting renewable energy options like solar power while reducing dependence on coal-fired plants.
- Regional Coordination: Pollution control efforts should extend beyond city limits to include neighboring regions, fostering collaboration similar to Beijing’s regional initiatives.
- Public Advocacy for Clean Air: Encouraging citizen engagement in demanding accountability from the government can build political will for implementing necessary changes.
- Political Will and Consistency: Addressing air pollution requires sustained political commitment and a long-term action plan rather than ad hoc measures that fail to tackle root causes.
Way forward:
- Strengthen Policy Implementation and Regional Collaboration: Formulate and enforce a comprehensive, long-term pollution control policy with coordinated efforts involving Delhi and its neighboring states to address regional pollution sources effectively.
- Promote Sustainable Infrastructure and Public Engagement: Invest in renewable energy, green public transport, and urban planning while fostering public participation and advocacy for clean air to ensure accountability and sustained progress.
Mains PYQ:
Q Mumbai, Delhi and Kolkata are the three Mega cities of the country but the air pollution is much more serious probelm in Delhi as compared to the other two. Why is this so? (UPSC IAS/2015)
Get an IAS/IPS ranker as your 1: 1 personal mentor for UPSC 2024
Air Pollution
Commission for Air Quality Management (CAQM)
From UPSC perspective, the following things are important :
Prelims level: Commission for Air Quality Management (CAQM)
Why in the News?
Delhi has been experiencing severe air pollution for 10 days, leading the Supreme Court to criticize the Commission for Air Quality Management (CAQM) for its poor response.
About Commission for Air Quality Management (CAQM):
| Details | |
| About |
Structure:
|
| Functions |
|
| Powers | Jurisdiction: Over air quality issues in NCR, including Delhi, Punjab, Haryana, Uttar Pradesh, and Rajasthan.
Powers:
|
PYQ:[2018] How is the National Green Tribunal (NGT) different from the Central Pollution Control Board (CPCB)? 1. The NGT has been established by an Act whereas the CPCB has been created by an executive order of the Government. 2. The NGT provides environmental justice and helps reduce the burden of litigation in the higher courts whereas the CPCB promotes cleanliness of streams and wells and aims to improve the quality of air in the country. Which of the statements given above is/are correct? (a) 1 only (b) 2 only (c) Both 1 and 2 (d) Neither 1 nor 2 |
Get an IAS/IPS ranker as your 1: 1 personal mentor for UPSC 2024
Air Pollution
Is Delhi’s AQI 500 or 1500?
From UPSC perspective, the following things are important :
Mains level: Air Pollution; Climate Change; Urbanization and it’s Challenges;
Why in the News?
The Central Pollution Control Board (CPCB) recorded an average AQI of 494 (Severe plus category) for Delhi where the different scales and methods explain the gap.
The Central Pollution Control Board (CPCB) recorded an average AQI of 494 (Severe plus category) for Delhi where the different scales and methods explain the gap.
A study by the Centre for Science and Environment reveals that:
What is the AQI Crisis in North India and What is the role of Climatic Conditions?
What are the challenges in Monitoring AQI?
|
Why does India need a sustainable and health-centric framework?
- Long-Term Strategies: Efforts must go beyond immediate fixes and focus on sustainable practices that consider the interconnectedness of air quality management and climate change adaptation. This includes integrating scientific research into policy-making and resource allocation.
- Public Health Prioritization: A health-centric approach should prioritize the well-being of citizens by implementing measures that reduce exposure to harmful pollutants, particularly for vulnerable populations such as children and the elderly.
- Multidisciplinary Solutions: Addressing air quality issues necessitates collaboration across various sectors, including transportation, urban planning, and public health. This multidisciplinary approach can foster innovative solutions tailored to local contexts while addressing broader climatic challenges.
Conclusion: Northern India’s AQI crisis highlights the urgent need for sustainable, health-centric air quality management. The government should address the pollution through multidisciplinary solutions aligned with SDG 3 (Good Health) and SDG 13 (Climate Action), ensuring healthier lives and climate-resilient communities for future generations.
Mains PYQ:
Q Describe the key points of the revised Global Air Quality Guidelines (AQGs) recently released by the World Health Organisation (WHO). How are these different from its last update in 2005? What changes in India’s National Clean Air Programme are required to achieve revised standards? (UPSC IAS/2021)
Get an IAS/IPS ranker as your 1: 1 personal mentor for UPSC 2024
Air Pollution
Lahore: The World’s most Polluted City
From UPSC perspective, the following things are important :
Prelims level: PM2.5, IQAir Report
Why in the News?
- Lahore was declared the world’s most polluted city by air quality monitor IQAir, with an Air Quality Index (AQI) of 394, considered hazardous by global standards.
- Delhi ranks 2nd, recording an AQI of 204, also classified as “very unhealthy.”
- Lahore’s AQI value exceeds the World Health Organisation (WHO) guideline by over 55.6 times.

Primary Causes of Lahore’s Severe Air Pollution:
|
Who Ranks the Most Polluted Cities of the World and How?
- IQAir, a Swiss air quality monitoring company, ranks the most polluted cities based on real-time air quality data.
- The rankings focus on the concentration of PM2.5 particles, which are small enough to penetrate the lungs and pose serious health risks.
- Cities are ranked using the AQI scale (0-500), with AQI above 300 indicating hazardous pollution levels.
- IQAir uses data from government agencies, monitoring stations, and low-cost sensors across various regions.
- Real-time monitoring allows IQAir to provide up-to-date information about air pollution levels in cities around the world.
- The data is compared with WHO standards, which recommend PM2.5 levels below 5 micrograms per cubic meter for healthy air quality.
PYQ:[2021] Describe the key points of the revised Global Air Quality Guidelines (AQGs) recently released by the World Health Organisation (WHO). How are these different from its last update in 2005? What changes in India’s National Clean Air Programme are required to achieve revised standards? [2015] Mumbai, Delhi and Kolkata are the three Mega cities of the country but the air pollution is much more serious probelm in Delhi as compared to the other two. Why is this so? |
Get an IAS/IPS ranker as your 1: 1 personal mentor for UPSC 2024
Air Pollution
SC raps CAQM over failure to curb Delhi’s Pollution
From UPSC perspective, the following things are important :
Prelims level: CAQM
Why in the News?
The Supreme Court has criticized the Commission for Air Quality Management (CAQM) for its lack of concrete action to curb stubble burning in states neighboring Delhi.
Key issues as per SC:
- Non-Compliance and Ineffectiveness: The Supreme Court criticized the CAQM for failing to enforce the CAQM Act, highlighting a lack of concrete measures against stubble burning in Punjab and Haryana.
- Lack of Accountability: The Court questioned the CAQM’s accountability, emphasizing the need for concrete actions and consequences for officials who fail to enforce anti-pollution laws.
- Staffing and Representation Issues: The Court expressed concerns over staffing shortages in pollution control boards and inadequate representation in CAQM sub-committees, hindering effective operation.
- Scepticism on Pollution Reduction Claims: Despite claims of improved air quality and reduced stubble burning, the Court remained doubtful, citing ongoing instances of stubble burning and demanding detailed explanations from the CAQM.
About the Commission for Air Quality Management (CAQM):
| Details | |
| Formation |
|
| Objective | To manage air quality in the NCR and adjoining areas comprehensively |
| Composition | Headed by a full-time chairperson, with members from various states, ministries, and sectors like agriculture, industry, transport, and construction |
| Powers | Authority to issue directions, inspect industries, entertain complaints, restrict industries, and shut down non-compliant units |
| Jurisdiction | National Capital Region (NCR) and adjoining areas in Punjab, Haryana, Uttar Pradesh, and Rajasthan |
| Functions | Coordinates and monitors air quality, sets pollution control parameters, identifies violators, monitors industries, and can overrule state directives |
PYQ:[2018] How is the National Green Tribunal (NGT) different from the Central Pollution Control Board (CPCB)? 1. The NGT has been established by an Act whereas the CPCB has been created by an executive order of the Government. 2. The NGT provides environmental justice and helps reduce the burden of litigation in the higher courts whereas the CPCB promotes cleanliness of streams and wells and aims to improve the quality of air in the country. Which of the statements given above is/are correct? (a) 1 only (b) 2 only (c) Both 1 and 2 (d) Neither 1 nor 2 [2022]The most significant achievement of modern law in India is the constitutionalization of environmental problems by the Supreme Court.” Discuss this statement with the help of relevant case laws. [2015] Mumbai, Delhi and Kolkata are the three Mega cities of the country but the air pollution is much more serious problem in Delhi as compared to the other two. Why is this so? |
Get an IAS/IPS ranker as your 1: 1 personal mentor for UPSC 2024
Air Pollution
India’s first ‘Teal Carbon’ study
From UPSC perspective, the following things are important :
Prelims level: Teal Carbon
Why in the News?
India’s first study on teal carbon was conducted at Keoladeo National Park (KNP) in Rajasthan’s Bharatpur district.
Highlights of the Study
|
What is Teal Carbon?
| Details | |
| Definition | Carbon stored in non-tidal freshwater wetlands, including in vegetation, microbial biomass, and organic matter. |
| Key Sources | Peatlands, freshwater swamps, natural freshwater marshes. |
| Global Storage | Approximately 500.21 petagrams of carbon (PgC). |
| Threats | Pollution, land-use changes, water extraction, and degradation of wetlands. |
| Comparison | Distinct from black and brown carbon, which are produced by incomplete combustion of organic matter. |
| Benefits of Teal Carbon Ecosystems |
|
| Conservation Importance | Effective conservation of wetlands can enhance teal carbon pools, contributing to climate regulation and environmental sustainability. |
PYQ:[2021] What is blue carbon? (a) Carbon captured by oceans and coastal ecosystems. (b) Carbon sequestered in forest biomass and agricultural soils. (c) Carbon contained in petroleum and natural gas. (d) Carbon present in atmosphere. |
Get an IAS/IPS ranker as your 1: 1 personal mentor for UPSC 2024
Air Pollution
How can traffic which causes air pollution be controlled?
From UPSC perspective, the following things are important :
Mains level: Challenges related to air pollution in India;
Why in the News?
India has 83 of the world’s 100 most polluted cities. Air pollution caused 2.1 million deaths, with 99% breathing air below WHO standards.
Share of Road Transport in India’s CO2 Emissions as per the International Energy Associates
- Road transport is responsible for approximately 12% of India’s total CO2 emissions. Within this sector, heavy vehicles are a significant contributor to particulate matter (PM2.5) emissions, which are particularly harmful due to their ability to penetrate deep into the lungs and enter the bloodstream.
- Studies indicate that heavy vehicles contribute to about 60-70% of total vehicular PM emissions and 40-50% of total Nitrogen Oxide (NOx) emissions in urban areas. This highlights the critical role that road transport plays in India’s overall air pollution problem.
Why has the vehicular scrapping policy not been effective in States like Karnataka and Maharashtra?
- Insufficient Scrapping Facilities: Both states have a limited number of registered vehicle scrapping facilities (RVSFs). For instance, Karnataka has only two authorized RVSFs located in Devanahalli and Koratagere, which are unable to handle the volume of vehicles eligible for scrapping.
- Voluntary Compliance: The policy’s reliance on voluntary participation has resulted in low engagement from vehicle owners. For example, the policy targets around 20 lakh vehicles for scrapping, but without mandatory compliance, many older, polluting vehicles continue to operate on the roads
- Lack of Awareness and Less Incentives: There is a lack of awareness regarding the benefits of scrapping old vehicles among the public. Although the policy offers incentives, such as tax relief for scrapping vehicles may not be sufficient to encourage widespread participation.
- Bureaucratic delays: The implementation of the scrapping policy has faced bureaucratic delays and inconsistencies. In Maharashtra, despite announcing incentives for scrapping old vehicles, the actual impact has been limited due to slow bureaucratic processes and a lack of effective enforcement.
Steps taken:
The Bureau of Energy Efficiency (BEE) has taken several significant steps towards enhancing fuel efficiency and reducing carbon emissions in the transport sector through the implementation of the Corporate Average Fuel Economy (CAFE) norms.
- Introduction of CAFE Norms: The BEE has proposed the CAFE III and CAFE IV norms, which aim to set stringent targets for carbon emissions from passenger vehicles.
- CAFE III, effective from 2027 to 2032, sets a target of 91.7 grams of CO2 per kilometer, while CAFE IV, from 2032 to 2037, aims for 70 grams of CO2 per kilometer. These targets are designed to drive innovation and encourage the adoption of cleaner technologies in the automotive sector.
- Transition to WLTP Testing: A significant step is the commitment to transition from the Modified Indian Driving Cycle (MIDC) to the World Light Duty Vehicle Testing Procedure (WLTP) by March 31, 2027.
- The WLTP provides a more accurate and globally harmonized measure of a vehicle’s fuel consumption and emissions, ensuring that the targets reflect real-world driving conditions more effectively.
- Penalties for Non-Compliance: The BEE has outlined financial penalties for manufacturers that fail to meet the established fuel efficiency standards.
- For instance, if a manufacturer’s average fuel efficiency exceeds the limit by up to 0.2 liters per 100 km, a penalty of ₹25,000 per vehicle applies. If it exceeds by more than 0.2 liters, the penalty increases to ₹50,000 per vehicle.
Way forward:
- Enhance Infrastructure and Accessibility: Need to increase the number of registered vehicle scrapping facilities (RVSFs) across states like Karnataka and Maharashtra to make the process more accessible.
- Strengthen Policy Enforcement and Incentives: Transition from voluntary to mandatory compliance for the scrapping of old and polluting vehicles. This can be supported by enhancing public awareness campaigns that highlight the environmental and financial benefits of vehicle scrapping.
Mains PYQ:
Q Mumbai, Delhi and Kolkata are the three Megacities of the country but air pollution is a much more serious problem in Delhi as compared to the other two. Why is this so? (UPSC IAS/2015)
Get an IAS/IPS ranker as your 1: 1 personal mentor for UPSC 2024
Air Pollution
Why Denmark has taxed cattle burps and farts?
From UPSC perspective, the following things are important :
Prelims level: Why Are Methane Emissions a Problem?
Mains level: Significance of tax
Why in the news?
Denmark will impose a tax on its livestock farmers for the greenhouse gases (GHGs) emitted by their cows, sheep, and pigs from 2030.
What is it?
Denmark plans to impose a tax on livestock farmers for greenhouse gases (GHGs) emitted by their cows, sheep, and pigs starting in 2030.
- Tax Rates: Farmers would initially pay about $43 per metric ton of carbon dioxide equivalent produced by their livestock, increasing to around $108 by 2035.
- Actual Cost: Due to a 60% income tax deduction, the actual cost per ton will start at 120 kroner ($17.3) and rise to 300 kroner ($43) by 2035.
- Use of Tax Collection: The funds collected from the tax between 2030 and 2031 will be returned to the industry to support its green transition. The handling of proceeds will be revisited in 2032. The proposal includes the development of over 600,000 acres of new forest areas.
How Do Cows and Sheep Produce Methane?
- Ruminants like cows, sheep, goats, and buffaloes have a specialized digestive system with four stomach compartments, including the rumen. In the rumen, partially digested food ferments, producing methane.
- Methane is released primarily through burping and farting as the animals regurgitate and chew cud to complete the digestive process. Ruminant digestive systems are responsible for 27% of all methane emissions from human activity.
Why Are Methane Emissions a Problem?
- Climate Impact: Methane is a potent greenhouse gas, responsible for 30% of warming since preindustrial times, second only to carbon dioxide. Over a 20-year period, methane is 80 times more potent at warming than carbon dioxide.
- Ground-Level Ozone: Methane is the primary contributor to ground-level ozone formation, a highly irritating gas just above the Earth’s surface, contributing to 1 million premature deaths annually.
- Rising Levels: Atmospheric methane levels have dramatically increased in recent years, with the NOAA reporting a record 17 parts per billion increase in 2021, surpassing the previous record set in 2020.
Way forward:
- Dietary Adjustments: Introduce feed additives, such as seaweed or other natural supplements, that can reduce methane emissions during digestion in ruminants. This approach can significantly lower methane production without negatively impacting livestock health or productivity.
- Improved Manure Management: Utilize advanced manure management practices, such as anaerobic digestion, to capture and convert methane emissions from decomposing animal waste into biogas. This not only reduces methane emissions but also provides a renewable energy source.
Mains PYQ:
Q Describe the major outcomes of the 26th session of the Conference of the Parties (COP) to the United Nations Framework Convention on Climate Change (UNFCCC). What are the commitments made by India in this conference? (UPSC IAS/2021)
Get an IAS/IPS ranker as your 1: 1 personal mentor for UPSC 2024
Air Pollution
India is the World’s Second Largest emitter of Nitrous Oxide
From UPSC perspective, the following things are important :
Prelims level: Nitrous Oxide pollution
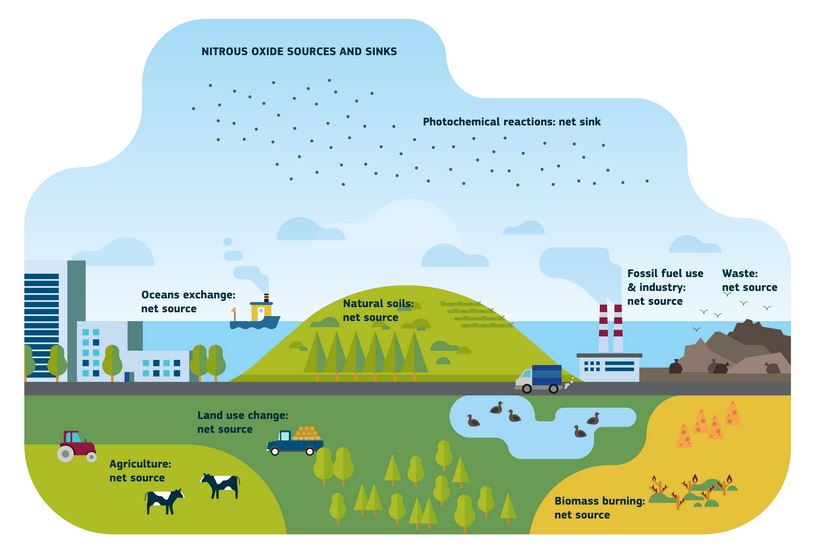
Why in the News?
- India ranks as the world’s second-largest contributor (after China) to nitrous oxide (N2O), a potent greenhouse gas (GHG), accounting for approximately 11% of global man-made emissions in 2020 as per data published in the journal Earth System Science Data.
- The top five country emitters by volume of anthropogenic N2O emissions in 2020 were China (16.7%), India (10.9%), the United States (5.7%), Brazil (5.3%), and Russia (4.6%).
About Nitrous Oxide
Sources of Emission:
Impact on Climate Change:
Environmental and Health Effects:
|
Global Nitrous Oxide Emissions
- Atmospheric Concentration: The concentration of atmospheric N2O reached 336 parts per billion in 2022, about 25% above pre-industrial levels.
- Next to Carbon Emissions: In comparison, the concentration of carbon dioxide was 417 parts per million in 2022.
- Persistent Lifespan: Once emitted, N2O stays in the atmosphere for longer than the average human lifespan (117 years), making its climate and ozone impacts long-lived.
- Contribution to Climate Change: These emissions are responsible for 6.4% of the effective radiative forcing of greenhouse gases and have added about 0.1°C to current global warming.
- Impact of Nitrogen Fertilizers: N2O emissions from human activities have increased by 40% in the past four decades, with agricultural production using nitrogen fertilizers and animal manure contributing 74% of total anthropogenic N2O emissions in the last decade.
Call for Action and Future Outlook
- Scientists warn that anthropogenic N2O emissions must decline by at least 20% relative to 2019 levels by 2050 to align with net-zero emission pathways consistent with the Paris Agreement.
- Nitrogen fertilizers, which are heavily subsidized in India, contribute significantly to N2O emissions. Urgent reforms are needed to promote alternative production systems and mitigate emissions.
India’s Policy Initiatives to Curb Nitrogen Pollution
- Nutrient-Based Subsidy (NBS) (2010): This policy encourages the adoption of controlled-release fertilizers to enhance nutrient management efficiency.
- Soil Health Cards (2015): Provided to farmers, these cards offer insights into soil nutrient levels and tailored fertilizer recommendations, promoting balanced nutrient application.
- Bharat Stage (BS VI) Emission Standards (2016): These stringent regulations for vehicles and industries aim to reduce the emission of nitrogen oxides and particulate matter, thereby mitigating air and water pollution.
- Nano Urea (2021): Marketed by the Indian Farmers Fertiliser Cooperative Limited (IFFCO), Nano Urea is a patented fertilizer approved for commercial use, designed to curb excessive and indiscriminate conventional urea use while boosting crop yields.
PYQ:[2016] Why does the Government of India promote the use of ‘Neem-coated Urea’ in agriculture? (a) Release of Neem oil in the soil increases nitrogen fixation by the soil microorganisms (b) Neem coating slows down the rate of dissolution of urea in the soil (c) Nitrous oxide, which is a greenhouse gas, is not at all released into the atmosphere by crop fields (d) It is a combination of a weedicide and a fertilizer for particular crops |
Get an IAS/IPS ranker as your 1: 1 personal mentor for UPSC 2024
Air Pollution
[pib] Sub-Committee for GRAP reviews the Air Quality scenario in New Delhi
From UPSC perspective, the following things are important :
Prelims level: GRAP and its implementation, AQI;
Why in the News?
- Delhi’s Air Quality Index (AQI) registered at 243, falling under the ‘Poor’ category, as reported by the Central Pollution Control Board (CPCB).
- In response to this, the Sub-Committee under the Commission for Air Quality Management in NCR & Adjoining Areas (CAQM) convened to assess the situation and strategize under the Graded Response Action Plan (GRAP).
About Graded Response Action Plan (GRAP)
|
Implementation of GRAP:
- The Commission for Air Quality Management in NCR & Adjoining Areas (CAQM) took over the responsibility of implementing GRAP in 2021.
- Before 2021, the SC appointed Environment Pollution (Prevention and Control) Authority (EPCA) would instruct states to enforce GRAP measures.
- The CAQM recommendations depend on the Air Quality Index (AQI) and meteorological predictions provided by the Indian Institute of Tropical Meteorology (IITM) and the India Meteorological Department (IMD).
Revised measures to implement:
| Air Quality Stage | AQI Range | Measures to be implemented |
| Stage I (Poor) | 201-300 | Enforce NGT/Supreme Court’s order on over-aged diesel/petrol vehicles. |
| Stage II (Very Poor) | 301-400 | Implement rigorous actions to combat air pollution at identified hotspots. |
| Stage III (Severe) | 401-450 | Impose strict restrictions on BS III petrol and BS IV diesel vehicles. Suspend physical classes in schools for primary grade children up to Class 5 in certain areas. |
| Stage IV (Severe Plus) | >450 | Prohibit the entry of four-wheelers registered outside Delhi, except for electric vehicles, CNG vehicles, and BS-VI diesel vehicles. |
Current Air Quality Scenario: Factors Contributing
- The GRAP sub-committee noted the following natural causes exacerbating dust suspension across the National Capital Region (NCR):
- Fluctuating wind patterns,
- Higher convection rates, and
- Arid weather conditions.
- Additionally, increased instances of agricultural residue burning and forest fires in neighboring states were identified as potential contributors to deteriorating air quality.
Action Plan suggested by GRAP Sub-Committee
- Intensive Drives at Pollution Hotspots: The concerned Pollution Control Boards (PCBs) and NCR committees were tasked with conducting rigorous inspections at major pollution hotspots, prioritizing dust abatement measures.
- Enhanced Dust Control Measures: Measures such as increased deployment of water sprinklers and mechanical road sweeping equipment were recommended to mitigate dust levels.
- Preventing Open Burning: Vigilance against instances of open burning, including municipal solid waste (MSW) and agricultural residue, was emphasized to curb further pollution.
- Strict Enforcement: Dust Control & Management Cells (DCMCs) and enforcement teams were instructed to intensify monitoring and enforcement efforts at construction sites and road projects.
- Inspections and Compliance: Flying Squads of CPCB were directed to conduct thorough inspections and take appropriate action against violators of environmental regulations.
PYQ:[2016] In the cities of our country, which among the following atmospheric gases are normally considered in calculating the value of Air Quality Index? 1. Carbon dioxide 2. Carbon monoxide 3. Nitrogen dioxide 4. Sulphur dioxide 5. Methane Select the correct answer using the codes given below: (a) 1, 2 and 3 only (b) 2, 3 and 4 only (c) 1, 4 and 5 only (d) 1, 2, 3, 4 and 5 |
Get an IAS/IPS ranker as your 1: 1 personal mentor for UPSC 2024
Air Pollution
What is Carbon Farming? | Explained
From UPSC perspective, the following things are important :
Prelims level: Carbon Farming;
Mains level: Significance and challenges of Carbon farming;
Why in the News?
The goal of carbon farming is to mitigate climate change by reducing the amount of carbon dioxide (CO2) and other greenhouse gases in the atmosphere.
BACK2BASICS:What is meant by Carbon Farming?
|

Significance of Carbon Farming:
- Mitigation of Climate Change: Carbon farming practices such as rotational grazing, agroforestry, conservation agriculture, and integrated nutrient management help sequester atmospheric carbon dioxide into the soil and vegetation, thereby mitigating climate change by reducing greenhouse gas emissions and enhancing carbon storage.
- Soil Health Improvement: Carbon farming enhances soil health by increasing soil organic carbon levels, improving soil structure, fertility, water retention, and resilience to drought and extreme weather events. Practices like zero tillage, cover cropping, and crop residue management minimize soil disturbance and enhance organic content.
- Biodiversity Conservation: Agroforestry, agroecology, and land restoration practices promote biodiversity conservation by diversifying plant and animal species, providing habitat for wildlife, and restoring degraded ecosystems.
- Sustainable Agriculture: Carbon farming promotes sustainable agricultural practices by minimizing environmental impacts, conserving natural resources, and enhancing the long-term productivity and resilience of agricultural systems.
Challenges in Carbon farming:
- Water Availability: Carbon farming can be challenging in hot and dry areas. Limited water availability can hinder plant growth and restrict the potential for carbon sequestration through photosynthesis, affecting practices like cover cropping.
- Plant Selection: The selection of plant species is crucial, as not all species trap and store carbon in the same amounts or equally effectively. Fast-growing trees and deep-rooted perennial grasses are generally better at carbon sequestration, but may not be suitable for arid environments.
- Financial Resources: Small-scale farmers in developing countries may particularly lack the resources to invest in sustainable land management practices and environmental services.
- Policy Support: Sufficient policy support is essential for the widespread adoption of carbon farming practices. This includes incentives, subsidies, regulations, and technical assistance to encourage and facilitate the implementation of carbon farming at the local, national, and international levels.
What are some carbon farming schemes worldwide?
- Voluntary Carbon Markets: Carbon trading in the agriculture sector has gained importance globally, especially in countries like the U.S., Australia, New Zealand, and Canada. Voluntary carbon markets, such as the Chicago Climate Exchange, provide platforms for incentivizing carbon mitigation activities in agriculture.
- Kenya’s Agricultural Carbon Project: Supported by the World Bank, Kenya’s Agricultural Carbon Project exemplifies efforts to address climate mitigation, adaptation, and food security challenges in economically developing countries through carbon farming initiatives.
- ‘4 per 1000’ Initiative: Launched during the COP21 climate talks in 2015 in Paris, the ‘4 per 1000’ initiative emphasizes the role of carbon sinks, including those created through carbon farming practices, in mitigating greenhouse gas emissions. It underscores the importance of managing the remaining global carbon budget wisely.
The Silver Line for the Indian Government:
|
Way forward:
- Research and Development: Invest in research and development to identify and promote plant species that are well-suited for carbon sequestration. Develop drought-resistant crops and agroforestry species to enhance carbon farming viability.
- Financial Support: Provide Financial assistance and incentives to small-scale farmers in developing countries to invest in sustainable land management practices and adopt carbon farming techniques.
- Policy Framework: Develop and implement supportive policy frameworks at local, national, and international levels to encourage the adoption of carbon farming practices. For example setting carbon pricing mechanisms, establishing regulatory standards, and providing technical assistance to farmers.
Mains PYQ
Q Should the pursuit of carbon credits and clean development mechanisms set up under UNFCCC be maintained even though there has been a massive slide in the value of a carbon credit? Discuss with respect to India’s energy needs for economic growth.(UPSC IAS/2014)
Get an IAS/IPS ranker as your 1: 1 personal mentor for UPSC 2024
Air Pollution
On the National Clean Air Programme | Explained
From UPSC perspective, the following things are important :
Prelims level: National Clean Air Programme (NCAP)
Mains level: Key features of NCAP
Why in the news?
When the Indian government launched the National Clean Air Programme (NCAP) in 2019, it’s target was to cut the concentration of atmospheric Particulate Matter (PM) by 20-30% by 2024, from 2017 levels. This was later revised to 40% by 2026.
What is the NCAP?
- The National Clean Air Programme (NCAP) was launched in India in January 2019 by the Ministry of Environment, Forest and Climate Change (MoEFCC)
- The NCAP aims to achieve reductions in PM10 levels through various measures.
What is PM10?
- PM 10, also known as particulate matter with an aerodynamic diameter of less than 10 micrometers.
- PM 10 particles can irritate the eyes, nose, and throat, and prolonged exposure to high levels of PM 10 can lead to serious health problems, including respiratory issues, cardiovascular disease, and even premature death.
Key features of NCAP (Note: asked in UPSC 2020 mains)
- Target: Achieving 20% to 30% reduction target in Particulate Matter (PM10 and PM2.5) concentrations by 2024, where 2017 is kept as the base year for the comparison of concentration. But it has been revised to 40% by 2026.
- Cities based on air quality:Identification of 122 non-attainment cities across the country based on the 2014-2018 Air Quality data.
- City specific plans: Preparation of city-specific action plans, including measures to strengthen the monitoring network, reduce vehicular/industrial emissions, and increase public awareness.
- Coordination between centre, state and local: Facilitating collaborative, multi-scale, and cross-sectoral coordination between the relevant central ministries, state governments, and local bodies.
- Right mix with exixting policies: Establishing a right mix with the existing policies and programs, including the National Action Plan on Climate Change (NAPCC) and other government initiatives related to climate change.
- Changes as per additional scientific information: Constant change, activity, and progress to get evolved based on the additional scientific and technical information as they emerge.
- Monitoring station: Increasing the number of monitoring stations in the country, including rural monitoring stations, technology support, and data analysis.
- Awareness and capicity building: Emphasis on awareness and capacity building initiatives, including public awareness campaigns, training programs, and research and development activities.
Challenges related to NCAP
- Lack of fund Utilization: On average, only 60% of the allocated funds have been utilized so far, with 27% of cities spending less than 30% of their designated budgets. Notably, Visakhapatnam and Bengaluru have spent 0% and 1% of their NCAP funds, respectively.
- Implementation Delays: Delays in implementing CAAPs are attributed to various factors, including bureaucratic hurdles such as delays in approvals from competent authorities and the absence of standard operating procedures.
- Technical Challenges: Technical challenges, such as defining technical specifications for tendering processes and procuring necessary equipment like mechanical sweepers and electric buses, contribute to implementation delays.
How scientific tool can help?
- Emissions Inventory (EI): EIs provide crucial insights into local pollution sources and their contributions, aiding in forecasting future emissions and shaping targeted pollution control strategies.
- Source Apportionment (SA) Studies: SA studies offer detailed analyses of contributions from various pollution sources, including distant ones.
- Role of Air Quality (AQ) Modelling: AQ modelling helps in understanding pollution dispersion, including from distant sources.
- Role of EI, SA and AQ: Combining EI, SA studies, and AQ modelling allows for a comprehensive understanding of pollution sources, their contributions, and dispersion patterns.
Conclusion:
Implement stricter monitoring mechanisms to ensure timely and efficient fund utilization. Regular audits and reviews can help identify underutilization and take corrective actions promptly.
Mains PYQ
Q What are the key features of the National Clean Air Programme (NCAP) initiated by the government of India? (UPSC IAS/2020)
Get an IAS/IPS ranker as your 1: 1 personal mentor for UPSC 2024
Air Pollution
What share of Global CO2 Emissions comes from Aviation?
From UPSC perspective, the following things are important :
Prelims level: Climate Change;
Mains level: Climate Change; CO2 emissions;
Why in the news?
Aviation accounts for 2.5% of global CO2 emissions. But it has contributed around 4% to global warming to date
Year-wise Global Aviation demand, Energy Efficiency, and CO2 emissions

Global Co2 emissions from aviation

The reason behind Aviation accounts for 2.5% of global CO2 emissions:
- CO2 Emissions: When jet fuel burns, it releases carbon dioxide (CO2) into the atmosphere, much like any other combustion process. CO2 as a greenhouse gas has contributed around 4% to global warming to date.
- Non-CO2 effects: In addition to CO2, aircraft emissions also include other substances like nitrogen oxides, soot, water vapor, and sulfate aerosols. These substances interact with the atmosphere in various ways and can have different climate impacts. For example:
- Contrails: These are the visible trails of condensed water vapor and ice crystals that form behind aircraft in certain atmospheric conditions. Contrails can contribute to the formation of cirrus clouds, which can have a warming effect on the climate.
- Induced cirrus cloud formation: Aircraft can also induce the formation of cirrus clouds through their emissions, further contributing to warming.
Initiatives taken by the Indian Government:
|
Way Forward:
- Transitioning to Alternative Fuels: Invest in Research and Development of sustainable aviation fuels (SAFs), such as biofuels, hydrogen, or synthetic fuels, which emit fewer CO2 emissions compared to conventional jet fuel.
- Improving Aircraft Efficiency: Encourage the adoption of more fuel-efficient aircraft and technologies, including advanced aerodynamics, lightweight materials, and efficient engines.
- Implementing Operational Improvements: Enhance air traffic management systems to optimize flight routes, reduce delays, and minimize fuel consumption during taxiing, takeoff, and landing.
Mains PYQs:
- Describe the major outcomes of the 26th session of the Conference of the Parties (COP) to the United Nations Framework Convention on Climate Change (UNFCCC). What are the commitments made by India in this conference? (2021)
- Discuss in detail the photochemical smog emphasizing its formation, effects and mitigation. Explain the 1999 Gothenburg protocol. (2022)
Get an IAS/IPS ranker as your 1: 1 personal mentor for UPSC 2024
Air Pollution
NGT Intervention to prevent Stubble Burning
From UPSC perspective, the following things are important :
Prelims level: National Green Tribunal (NGT), Pusa-Biodecomposer
Mains level: NA
Why in the news?
The National Green Tribunal (NGT) has directed the Punjab government to devise a comprehensive strategy for managing the estimated 19.52 million tonnes of paddy stubble in the state.
About National Green Tribunal (NGT)
| Description | |
| Establishment | Formed in 2010 under the National Green Tribunal Act as a statutory body. |
| Objective
|
|
| Composition |
|
| Powers | Empowered to decide on questions related to various environmental laws and hear civil cases concerning environmental issues:
|
| Exceptions | Prohibited to hear any issues which are covered under:
|
| Places |
|
| Governing Principles |
|
| Review and Challenge |
|
NGT intervention in Punjab
- The ban and action against people burning crop residue are regulated under the Air (Prevention and Control of Pollution) Act, 1981.
- Punjab is required to provide details on the steps taken to utilize paddy straw in the previous year, including the mode and manner of removal, transportation, and utilization in various units.
- Punjab estimated an increase in paddy straw generation to 52 million tonnes in 2024, with a projected utilization of 18.66 million tonnes.
- Notably, the off-site utilization is expected to see a significant 60% increase, with 5.96 million tonnes being utilized in industrial and energy plants.
Alternatives used for Stubble Burning
- In-Situ Treatment: This involves managing crop residue directly in the field. Examples include using zero-tiller machines and bio-decomposers to break down stubble.
- Ex-Situ Treatment: This method involves treating crop residue outside the field. An example is using rice straw as cattle fodder.
- Turbo Happy Seeder (THS) Technique: This can uproot stubble and sow seeds while clearing the field. The stubble can then be used as mulch.
Pusa-Biodecomposer
|
PYQ:[2019] Consider the following: 1. Carbon monoxide 2. Methane 3. Ozone 4. Sulphur dioxide Which of the above are released into atmosphere due to the burning of crop/biomass residue? (a) 1 and 2 only (b) 2, 3 and 4 only (c) 1 and 4 only (d) 1, 2, 3 and 4 |
Get an IAS/IPS ranker as your 1: 1 personal mentor for UPSC 2024
Air Pollution
The need to curb Black Carbon Emissions | Explained
From UPSC perspective, the following things are important :
Prelims level: COP26 , PMUY
Mains level: Why is black carbon relevant?, Significance of Pradhan Mantri Ujjwala Yojana (PMUY)
Why in the News?
According to the Ministry of New and Renewable Energy, India had installed a renewable energy capacity of over 180 GW by 2023 and is expected to meet its target of 500 GW by 2030.
Context
At the COP26 climate talks in Glasgow in November 2021, India pledged to achieve net-zero emissions by 2070, positioning itself as a frontrunner in the race to carbon neutrality.
Why is black carbon relevant?
- Cause of global warming : lack carbon is the dark, sooty material emitted alongside other pollutants when biomass and fossil fuels are not fully combusted. It contributes to global warming
- Poses severe risks: Studies have found a direct link between exposure to black carbon and a higher risk of heart disease, birth complications, and premature death. Most black carbon emissions in India arise from burning biomass, such as cow dung or straw, in traditional cookstoves.
Status of Black Carbon
- According to a 2016 study, the residential sector contributes 47% of India’s total black carbon emissions. Industries contribute a further 22%, diesel vehicles 17%, open burning 12%, and other sources 2%.
- Decarbonisation efforts in the industry and transport sectors in the past decade have yielded reductions in black carbon emissions, but the residential sector remains a challenge.
Has PMUY helped?
- Objective of PMUY: The primary objective of PMUY, launched by the Government of India in May 2016, is to provide free liquefied petroleum gas (LPG) connections to households below the poverty line. This aims to offer a cleaner cooking fuel alternative to traditional biomass fuels, particularly in rural and poor households, thereby reducing their dependence on such polluting fuels.
- Infrastructure Establishment: PMUY has established necessary infrastructure to support LPG connections, including provision of free gas stoves, deposits for LPG cylinders, and a distribution network. This infrastructure is crucial for enabling the adoption of clean cooking practices.
- Role in Reducing Black Carbon Emissions: By providing cleaner LPG alternatives to traditional biomass fuels, PMUY has played a vital role in reducing black carbon emissions. This initiative contributes to mitigating environmental pollution and improving air quality, particularly in households previously reliant on polluting cooking fuels.
Challenges and Shortcomings:
Despite its objectives and infrastructure, challenges persist in fully transitioning beneficiaries to LPG usage.
- High gap between LPG connections and actual adoption: In 2022-2023, a significant portion of PMUY beneficiaries, representing 25%, continued to rely entirely on traditional biomass fuels for cooking. This indicates a gap between the provision of LPG connections and actual adoption of clean cooking practices.
- Low Refill Rates and Energy Consumption: RTI data revealed that a substantial number of PMUY beneficiaries availed either zero or only one LPG refill, indicating low usage of LPG cylinders. Additionally, the average PMUY beneficiary household consumes significantly fewer LPG cylinders per year compared to non-PMUY households. This suggests that traditional fuels still meet a significant portion of energy needs in PMUY beneficiary households.
- Health Impacts: The continued reliance on traditional fuels has detrimental health effects, particularly on women and children who are disproportionately affected by indoor air pollution. This leads to various health issues and premature deaths, highlighting the urgent need for increased adoption of clean cooking practices.
- Affordability: Despite subsidies and recent increases(subsidy to ₹300 from ₹200. ), the cost of LPG cylinders remains high for many PMUY beneficiaries. This affordability challenge discourages households from consistently purchasing and using LPG cylinders, especially when traditional biomass alternatives are perceived as “free.”
- Temporary Subsidies: While the government has announced temporary price reductions to address affordability concerns, the sustainability of such subsidies remains uncertain. Temporary measures may not provide long-term solutions to ensure consistent access to clean cooking fuel for beneficiaries.
- Low Refill Rates: Low refill rates persist among PMUY beneficiaries, indicating a gap between initial LPG connections provided and sustained usage. This issue stems from both affordability concerns and challenges in availability and distribution of LPG cylinders.
- Last-Mile Connectivity: Remote rural areas face challenges in accessing LPG due to inadequate last-mile connectivity in the distribution network. This results in continued reliance on traditional biomass fuels, perpetuating indoor air pollution and health risks.
- Alternative Fuel Solutions: Local production of coal-bed methane (CBM) gas presents a potential solution to address the lack of last-mile connectivity and provide cleaner cooking fuel alternatives. Composting biomass to produce CBM gas could offer a sustainable and accessible solution at the village level, reducing dependence on traditional biomass fuels.
- Investment and Infrastructure: Implementing alternative fuel solutions such as CBM gas production requires investment and infrastructure development. Panchayats and local authorities may need support and resources to establish and maintain CBM gas production facilities effectively.
- Rural Empowerment: Empowering local communities, such as Panchayats, to take initiatives in clean cooking fuel production and distribution can promote self-sufficiency and sustainability while addressing rural energy needs.
To resolve the challenges associated with the Pradhan Mantri Ujjwala Yojana (PMUY) and ensure effective adoption of clean cooking practices, several measures can be implemented:
- Awareness and Education Campaigns: Launch comprehensive awareness campaigns to educate PMUY beneficiaries about the health and environmental benefits of using LPG over traditional biomass fuels. Emphasize the importance of consistent LPG usage and the risks associated with indoor air pollution.
- Subsidy Reforms: Implement sustainable subsidy structures that ensure long-term affordability of LPG cylinders for PMUY beneficiaries. Explore innovative subsidy mechanisms, such as targeted subsidies based on income levels or usage patterns, to address affordability concerns effectively.
- Incentives for Refills: Introduce incentives or rewards for PMUY beneficiaries who consistently use and refill their LPG cylinders. This could include discounts on future refills or loyalty programs to encourage regular usage and reduce the gap between LPG connections and actual adoption.
- Improved Distribution Networks: Invest in improving last-mile connectivity and distribution networks in remote rural areas to ensure seamless access to LPG cylinders for all PMUY beneficiaries. This could involve expanding the reach of LPG distribution centers and leveraging technology for efficient logistics management.
- Promotion of Alternative Fuel Solutions: Encourage the adoption of alternative fuel solutions such as Bio gas production through community-based initiatives. Provide support and incentives for the establishment of Bio gas production facilities at the village level, empowering local communities to produce and access clean cooking fuel.
- Partnerships and Collaboration: Foster partnerships between government agencies, private sector stakeholders, and non-profit organizations to address the multifaceted challenges associated with clean cooking fuel adoption. Collaborative efforts can leverage expertise, resources, and networks to achieve sustainable solutions.
- Monitoring and Evaluation: Establish robust monitoring and evaluation mechanisms to track the progress of PMUY implementation and measure the impact of interventions. Regular assessment of refill rates, usage patterns, and health outcomes can inform evidence-based policy decisions and program adjustments.
Conclusion
To curb black carbon emissions, India must address gaps in LPG adoption by PMUY beneficiaries through subsidy reforms, awareness campaigns, improved distribution networks, and promotion of alternative fuel solutions, fostering partnerships for sustainable impact.
Mains PYQ
Q-Discuss global warming and mention its effects on the global climate. Explain the control measures to bring down the level of greenhouse gases which cause global warming, in the light of the Kyoto Protocol, 1997. (UPSC IAS/2022)
Q- Should the pursuit of carbon credits and clean development mechanisms set up under UNFCCC be maintained even though there has been a massive slide in the value of a carbon credit? Discuss with respect to India’s energy needs for economic growth.(UPSC IAS/2014)
Get an IAS/IPS ranker as your 1: 1 personal mentor for UPSC 2024
Air Pollution
Highlights of the World Air Quality Report, 2023
From UPSC perspective, the following things are important :
Prelims level: World Air Quality Report, Particulate Matters
Mains level: NA

Why in the news-
- India has been ranked as the third-most polluted country in 2023, following Bangladesh and Pakistan, according to the ‘World Air Quality Report 2023’ by IQAir.
- IQAir is a Swiss air quality technology company, specializing in protection against airborne pollutants, developing air quality monitoring and air cleaning products
Comparative Analysis
|
Key Highlights
(A) Most Polluted Indian Cities:
- Ten out of the top 11 most polluted cities in the world are from India, the other being Lahore in Pakistan.
- Begusarai, located in Bihar, witnessed a significant increase in PM 2.5 concentration from 19.7 micrograms per cubic metre in 2022 to 118.9 micrograms per cubic metre in 2023.
- Guwahati’s PM2.5 concentration doubled from 51 to 105.4 micrograms per cubic meter between 2022 and 2023.
- Delhi saw an increase in PM2.5 concentration from 89.1 to 92.7 micrograms per cubic meter over the same period.
- Other Indian cities featuring in the top 50 most polluted cities of the world list included Greater Noida (11), Muzzafarnagar (16), Gurgaon (17), Arrah (18), Dadri (19), Patna (20), Faridabad (25), Noida (26), Meerut (28), Ghaziabad (35) and Rohtak (47).
(B) Global Insights:
- Oceania—comprising Australia, New Zealand, and French Polynesia—remained the region with the cleanest air in 2023.
- The report highlighted the top five most polluted countries worldwide, including Bangladesh, Pakistan, India, Tajikistan, and Burkina Faso.
- Seven countries which met the WHO annual PM2.5 guideline (annual average of 5 µg/m3 or less) included Australia, Estonia, Finland, Grenada, Iceland, Mauritius, and New Zealand.
- Despite previous declines, China experienced a 6.3% increase in PM2.5 concentration in 2023, signalling a concerning trend.
- For the first time, Canada emerged as the most polluted country in Northern America, reflecting regional air quality challenges.
- Africa remains the most underrepresented continent, with a third of the population still lacking access to air quality data.
What are Particulate Matters (PM)?
|
PYQ:
Q.Mumbai, Delhi and Kolkata are the three Mega cities of the country but the air pollution is much more serious problem in Delhi as compared to the other two. Why is this so? (2015)
Q.In the cities of our country, which among the following atmospheric gases are normally considered in calculating the value of Air Quality Index? (2016)
- Carbon dioxide
- Carbon monoxide
- Nitrogen dioxide
- Sulphur dioxide
- Methane
Select the correct answer using the codes given below:
- 1, 2 and 3 only
- 2, 3 and 4 only
- 1, 4 and 5 only
- 1, 2, 3, 4 and 5
Practice MCQ:
Consider the following statements:
- Particulate matter (PM) consists of a mixture of solid particles as well as liquid droplets suspended in the air.
- PM 2.5 can penetrate deep into the respiratory system and enter the bloodstream, posing significant health risks.
- Natural dust does not contribute to PM.
How many of the given statements is/are correct?
- One
- Two
- Three
- None
Get an IAS/IPS ranker as your 1: 1 personal mentor for UPSC 2024
Air Pollution
Global Methane Tracker, 2024
From UPSC perspective, the following things are important :
Prelims level: Global Methane Tracker, 2024
Mains level: NA

Why in the news-
- Methane emissions from fuel use in 2023 reached nearly record levels, totalling 120 million tonnes (Mt), as per the International Energy Agency’s (IEA) Global Methane Tracker 2024.
What is Global Methane Tracker (GMT)?
- The IEA’s Methane Tracker is an online database that tracks oil and gas-related methane sources globally.
- It provides estimates of emissions across various sectors, including oil, natural gas, coal, and bioenergy, with the energy sector contributing nearly 40% of human-related methane emissions
- It provides current estimates of methane emissions and highlights potential reductions achievable through existing technologies.
GMT 2024: Key Findings
- Elevated Emissions: Satellite data revealed a more than 50% increase in large methane emissions in 2023 compared to the previous year.
- Top Emitters: The United States and Russia emerged as the largest emitters of methane from oil and gas operations, contributing significantly to global emissions.
- Fossil Fuel Leaks: Over 5 Mt of methane emissions were attributed to major fossil fuel leaks globally, including a significant blowout incident in Kazakhstan lasting over 200 days.
- Cost of Emission Cut: Reducing methane emissions from fossil fuels by 75% by 2030 would require about $170 billion in spending – less than 5% of the income generated by the fossil fuel industry in 2023.
About Methane Pollution
- Methane, is an organic compound composed of carbon and four hydrogen atoms (CH4).
- Second-biggest anthropogenic contributor to global warming after carbon dioxide, 80 times more potent.
- Global Warming Potential (GWP) measures warming caused by substances relative to carbon dioxide over a century.
- Methane GWP100: 28, nitrous oxide 265, sulphur hexafluoride 23,500.
- Short-lived climate pollutant, breaks down in a few years, unlike carbon dioxide.
- Sources: Cattle farming, landfills, wastewater treatment, rice cultivation, industrial processes.
- Energy, agriculture, and waste sectors are primary emitters, responsible for 30% of global warming.
- Livestock emissions, including manure and gastroenteric releases, account for 32% of human-caused emissions.
Global steps to curb Methane Emissions
- Paris Agreement Goal: To limit warming to 1.5°C, methane emissions from fossil fuels must be reduced by 75% by 2030, necessitating substantial efforts and investments.
- Global Methane Pledge: Launched at UN COP26 climate conference in Glasgow. Over 90 countries signed, led by the United States and the European Union (India not signed up).
- First Global Stocktake (GST): Released at COP28, called for countries to accelerate and substantially reduce non-carbon-dioxide emissions globally, including methane, by 2030. But it stopped short of providing a quantifiable target.
Try this PYQ from CSE Prelims 2016:
Q.In the cities of our country, which among the following atmospheric gases are normally considered in calculating the value of Air Quality Index?
- Carbon dioxide
- Carbon monoxide
- Nitrogen dioxide
- Sulphur dioxide
- Methane
Select the correct answer using the codes given below:
(a) 1, 2 and 3 only
(b) 2, 3 and 4 only
(c) 1, 4 and 5 only
(d) 1, 2, 3, 4 and 5
Get an IAS/IPS ranker as your 1: 1 personal mentor for UPSC 2024
Air Pollution
Meghalaya’s Byrnihat Most Polluted ‘City’ in India
From UPSC perspective, the following things are important :
Prelims level: CREA
Mains level: Air pollution woes

In the news
- The Centre for Research on Energy and Clean Air (CREA) recently released data shedding light on air pollution levels across urban centers in India during February 2024.
- Surprisingly, Meghalaya’s Byrnihat emerged as the most polluted ‘city’ in the nation, sparking concerns about air quality in the otherwise cleaner Northeast region.
About Centre for Research on Energy and Clean Air (CREA)
- CREA is a non-profit think tank researching energy and air pollution based in Helsinki (Finland).
- It was established in 2019 with the goal of tracking the impacts of air pollution by providing data-backed research products.
Key Insights
(1) Alarming Pollution Levels in NE
- Pollution Pinnacle: Byrnihat, an industrial town near the Assam border, recorded the highest levels of PM2.5 pollution in India, with a monthly average concentration of 183 µg/m3.
- Byrnihat vs. National Averages: Byrnihat’s PM2.5 levels were significantly higher than those in Bihar’s Araria, the second-most polluted city, highlighting the severity of pollution in the former.
- Northeastern Representation: Other northeastern cities such as Nalbari, Agartala, Guwahati, and Nagaon also featured among the 30 most polluted cities in India, indicating a broader regional trend of worsening pollution levels.
(2) Cleanest Cities and Regional Disparities
- Positive Performers: Sivasagar, Silchar, Aizawl, and Imphal emerged as the cleanest cities in the region, with PM2.5 concentrations below the National Ambient Air Quality Standard (NAAQS).
- National Rankings: Sivasagar secured the second position nationally, underscoring its exemplary air quality standards.
(3) Silver Lining: Improvements and Opportunities
- Positive Trends: February witnessed a notable improvement in air quality, with 36 cities classified under the ‘good’ category, reflecting positive strides in pollution mitigation efforts.
- Opportunities for Progress: The data signals opportunities for collaborative action and policy interventions to address environmental challenges and safeguard public health.
Implications and Recommendations
- Monitoring Imperative: The data underscores the urgent need to enhance air quality monitoring infrastructure in the northeastern states to effectively track pollution levels.
- Environmental Concerns: Unregulated industrial operations, inadequate public transportation, rampant construction, and other factors contribute to the deteriorating air quality in the region, necessitating stringent regulatory measures.
Get an IAS/IPS ranker as your 1: 1 personal mentor for UPSC 2024
Air Pollution
MethaneSAT: Revolutionizing Methane Emission Tracking
From UPSC perspective, the following things are important :
Prelims level: MethaneSAT, GWP of Methane
Mains level: NA

In the news
- MethaneSAT, the latest addition to the space technology arsenal, promises to revolutionize the tracking and measurement of methane emissions globally.
- Launched aboard a SpaceX Falcon9 rocket, this innovative satellite is set to provide unparalleled insights into methane emissions, aiding in the fight against climate change.
Methane Emissions
|
Unraveling MethaneSAT
- MethaneSAT is an initiative of the Environmental Defense Fund (EDF), in collaboration with Harvard University, the Smithsonian Astrophysical Observatory, and the New Zealand Space Agency.
- Equipped with a high–resolution infrared sensor and a spectrometer, MethaneSAT can detect methane concentrations as small as three parts per billion.
- With a wide-camera view of about 200 km by 200 km, MethaneSAT can identify both small and large emitters, filling critical data gaps.
Key Features
- Data Accessibility: MethaneSAT will provide its data for free in near real-time, empowering stakeholders and regulators to take timely action to curb methane emissions.
- Cloud Computing and AI: Google’s cloud-computing and AI technology will be used to analyze the vast amount of data collected by MethaneSAT, ensuring efficient processing and interpretation.
Significance of Methane Emission Monitoring
- Greenhouse Gas Impact: Methane, though invisible, is a potent greenhouse gas and a major contributor to global warming, second only to carbon dioxide.
- Health Hazards: Methane emissions also contribute to the formation of ground-level ozone, posing serious health risks and causing premature deaths.
- Fossil Fuel Operations: The bulk of human-caused methane emissions stem from fossil fuel operations, making it imperative to monitor and reduce these emissions.
Implications
- Global Impact: The launch of MethaneSAT aligns with the growing momentum for stringent methane management policies worldwide.
- Transparency: Publicly available data from MethaneSAT will hold governments and corporations accountable for their methane emission reduction commitments.
- Behavioral Change Challenges: While the data from MethaneSAT can drive awareness, behavioral changes among polluters are not guaranteed, highlighting the need for complementary regulatory measures.
Try this PYQ from CSE Prelims 2019:
Q.Consider the following:
- Carbon monoxide
- Methane
- Ozone
- Sulphur dioxide
Which of the above are released into atmosphere due to the burning of crop/biomass residue?
(a) 1 and 2 only
(b) 2, 3 and 4 only
(c) 1 and 4 only
(d) 1, 2, 3 and 4
Get an IAS/IPS ranker as your 1: 1 personal mentor for UPSC 2024
Air Pollution
What are ‘Super Pollutants’?
From UPSC perspective, the following things are important :
Prelims level: Super Pollutants types
Mains level: NA
Why in the News?
- Recently, the annual meeting of the Climate and Clean Air Coalition (CCAC) which took place from 21 to 23 February 2024 in Nairobi, Kenya on the margins of the Sixth session of the United Nations Environment Assembly (UNEA-6) highlighted the critical importance of international collaboration in combating short-lived climate pollutants, commonly known as “Super Pollutants.”
What are Super Pollutants?
- Super pollutants, or short-lived climate pollutants (SLCPs), have a shorter atmospheric lifespan compared to CO2 but significantly impact climate change and air quality. Methane (CH4), black carbon (soot), hydrofluorocarbons (HFCs), and tropospheric ozone (O3) are some of the major superpollutants.
Impacts of Super Pollutants
- Methane (CH 4):
- Characteristics: Potent greenhouse gas emitted from various sources such as livestock and fossil fuel production.
- Its Impact: Traps heat in the atmosphere, exacerbating climate change.
- Black Carbon (Soot):
- Characteristics: Fine particulate matter from incomplete combustion of fuels.
- Its Impact: Absorbs sunlight, heats the atmosphere, and accelerates the melting of snow and ice.
- Hydrofluorocarbons (HFCs):
- Characteristics: Synthetic greenhouse gases used in refrigeration.
- Its Impact: High global warming potential despite short atmospheric lifespan.
- Tropospheric Ozone (O3):
- Characteristics: Secondary pollutants formed from VOCs and NOx.
- Its Impact: Contributes to smog, has adverse health effects, and acts as a greenhouse gas.
About Climate and Clean Air Conference 2024:
- What is the aim and objective?
- The CCAC 2024 moved the dialogue forward, focusing on the cost of inaction, highlighting ways to further scale up implementation of the Global Methane Pledge, Clean Air Flagship and Kigali Amendment, and collectively charting the course to 2025 and beyond.
- What did the CCAC 2024 Feature for?
- National policy and planning: High-level plenary sessions on global, regional and national efforts to reduce methane, black carbon, and HFCs, including the benefits of fast action, and financing for implementation.
- Science and Technology: Science Policy Dialogue sessions on latest emerging science and how new information can inform policy development. Technical sessions among CCAC Sector Hub members to showcase best practices in key emitting sectors: agriculture, cooling, fossil fuels, heavy-duty vehicles and engines, household energy, and waste.
- Focus on Implementation: Practical sessions to further refine work plans among CCAC National Consultants; Non-State Partners and Scientific Advisory Panel Members.
- What are the Functions?
- The CCAC works at the nexus of climate and air quality, to deliver multiple benefits from the fast mitigation of short-lived climate pollutants.
- Driven by policy-relevant science and pragmatism, CCAC works from the ground up, equitably and inclusively, empowering our partners to achieve their respective National Goals and catalyzing action — as well as from the top down, bringing together ministers and leaders to drive high-level ambition.
- About the previous Conference:
- The CCAC 2023 was held in Bangkok.
- As an outcome of this conference, CCAC 2023 integrated planning on climate and clean air is essential to identify priority actions in key emitting sectors to scale up mitigation, and action at the national and regional level is motivating collaboration at the global scale.
Get an IAS/IPS ranker as your 1: 1 personal mentor for UPSC 2024
Air Pollution
La Nina impacted Air Quality in India: Study
From UPSC perspective, the following things are important :
Prelims level: El Nino and La Nina
Mains level: Link Between ENSO and local Air Pollution

Introduction
- El Nino and La Nina events have long influenced India’s monsoon patterns, but a recent study suggests a novel connection between these weather phenomena and air quality, particularly during the winter months of 2022.
Understanding El Nino and La Nina
- El Nino and La Nina are two opposite phases of the El Nino-Southern Oscillation (ENSO) cycle.
- ENSO is a naturally occurring phenomenon that involves the interaction between the ocean and atmosphere in the equatorial Pacific.
Here is a detailed comparison of El Nino and La Nina
| El Nino | La Nina | |
| Definition | Warmer-than-normal sea surface temperatures | Cooler-than-normal sea surface temperatures |
| Frequency | Every two to seven years | Every two to seven years |
| Duration | Several months to a year or more | Several months to a year or more |
| Impact on winds | Weakens trade winds, leading to changes in patterns | Strengthens trade winds, leading to changes in patterns |
| Impact on rains | Reduces rainfall and can cause droughts | Increases rainfall and can cause flooding |
| Impact on temp. | Warmer-than-average temperatures | Colder-than-average temperatures |
| Global effects | Droughts in Asia and Africa, floods in Americas | Floods in Asia and Africa, droughts in South America |
Impact on India
| El Nino | La Nina |
| Associated with weak monsoons and drought-like conditions in India | Associated with above-normal rainfall and floods in India |
| Sea surface temperature in the equatorial Pacific Ocean rises above normal levels | Sea surface temperature in the equatorial Pacific Ocean drops below normal levels |
| Changes in the atmospheric circulation patterns | Changes in the atmospheric circulation patterns |
| Shift in the location of the jet stream, affecting the strength and direction of the monsoon winds | Increase in the strength of the monsoon winds, bringing more moisture and rainfall to India |
| Results in reduced rainfall, dry spells, and heatwaves, leading to crop failures and water scarcity | Excessive rainfall can also lead to floods and landslides, causing damage to crops and infrastructure |
El Nino and Indian Monsoon
- El Nino and its impact on Indian monsoon: El Nino refers to abnormal warming of surface waters in the equatorial Pacific Ocean, which tends to suppress monsoon rainfall in India.
- Phases of El Nino Southern Oscillation (ENSO): ENSO consists of three phases in the Pacific Ocean: El Nino, La Nina (abnormal cooling), and a neutral phase with sea surface temperatures close to long-term averages.
- Ocean and atmospheric conditions: ENSO involves not only temperature abnormalities of sea surface waters but also atmospheric conditions, including differences in sea-level air pressure and wind strength and direction.
- Southern oscillation and the role of winds: Southern Oscillation Index measures the difference in sea-level air pressure over the western and eastern sides of the Pacific Ocean, while wind patterns play a crucial role in ENSO.
How La Nina impacted air quality?
- Wind Direction Shift: The study identified a significant alteration in wind circulation patterns during the winter of 2022, with winds typically blowing from the northwest direction diverted towards the south due to the prolonged La Nina effect.
- Anomalous Behavior: This deviation led to a bypass of pollutant-laden winds from Punjab and Haryana away from Delhi towards southern regions, impacting cities like Mumbai, Bengaluru, and Chennai.
- Extended La Nina Effect: The persistence of La Nina conditions over three years intensified the impact on wind patterns, culminating in noticeable changes in air quality distribution across India.
- Uncertainties and Further Exploration: While the study highlights the role of La Nina in altering wind circulation and subsequent air quality, uncertainties remain regarding the potential impact of El Nino events on air quality dynamics.
Conclusion
- The study underscores the need for continued exploration into the interplay between global weather phenomena like La Nina, local meteorological conditions, and air quality dynamics in India.
- Understanding these complex relationships can inform policy measures aimed at mitigating air pollution and enhancing environmental resilience in the face of climate change challenges.
Get an IAS/IPS ranker as your 1: 1 personal mentor for UPSC 2024
Air Pollution
Ammonia Emission Reductions in Agriculture
From UPSC perspective, the following things are important :
Prelims level: Ammonia Emission
Mains level: Read the attached story

Introduction
- Researchers have harnessed machine learning to provide precise estimates of ammonia emissions stemming from rice, wheat, and maize crops.
- Their dataset allows for a crop-specific assessment of emission reduction potential, suggesting that effective fertilizer management in these crops could decrease atmospheric ammonia emissions from agriculture by up to 38%.
Ammonia Emissions in Agriculture
Ammonia (NH3) emissions primarily originate from agricultural activities, particularly livestock farming and the application of synthetic and organic fertilizers.
- Livestock Farming: Livestock, such as cattle, poultry, and swine, produce ammonia through the breakdown of urea in their urine and faeces. Confined animal feeding operations (CAFOs) are major contributors to ammonia emissions.
- Fertilizer Application: Ammonia is released when synthetic fertilizers containing ammonium-based compounds (e.g., ammonium nitrate) are applied to crops. Manure from livestock can also be used as organic fertilizer, contributing to ammonia emissions.
Why it matters?
- Environmental Impact: Ammonia emissions can lead to air pollution, especially in areas with intensive agriculture. It can react with other pollutants to form fine particulate matter (PM2.5) and contribute to the formation of ground-level ozone, which has adverse effects on human health and the environment.
- Acid Deposition: Ammonia can undergo atmospheric transformation and contribute to acid rain, which can harm aquatic ecosystems, forests, and infrastructure.
- Nutrient Loss: Ammonia emissions represent a loss of valuable nitrogen nutrients from agricultural systems. This can reduce the efficiency of fertilizer use and contribute to nitrogen pollution in water bodies.
Significance of Ammonia Emissions
- Environmental Impact: Atmospheric ammonia is a significant environmental pollutant, affecting ecosystems and human health globally.
- Crop-Related Emissions: A substantial portion of anthropogenic ammonia emissions, 51-60%, originates from crop cultivation. Rice, wheat, and maize are responsible for approximately half of these emissions.
Machine Learning-Based Modeling
- Researchers’ Approach: The study employed machine learning to model ammonia emissions from rice, wheat, and maize farming worldwide. This modelling considered various factors such as climate, soil characteristics, crop types, irrigation, tillage practices, and fertilization methods.
- Dataset Development: To train the model, researchers curated a dataset comprising ammonia emissions data from over 2,700 observations, gathered through a systematic review of published literature.
- Global Emission Estimate: The model’s estimates revealed that global ammonia emissions reached 4.3 teragrams (4.3 billion kilograms) in 2018.
Emission Reduction Potential
- Optimizing Fertilizer Management: By spatially optimizing fertilizer management according to the model’s guidance, ammonia emissions from the three crops could potentially be reduced by 38%.
- Strategies: The optimized strategy involves deeper placement of enhanced-efficiency fertilizers into the soil using conventional tillage practices during the growing season.
Crop-Specific Contributions
- Reduction Potential: Under the proposed fertilizer management scenario, rice crops could contribute to 47% of the total reduction potential. Maize and wheat could contribute 27% and 26%, respectively.
- Emission Projections: Without management strategies, ammonia emissions could increase by 4.6% to 15.8% by 2100, depending on future greenhouse gas emissions levels.
Conclusion
- This study showcases how machine learning can provide valuable insights into ammonia emissions from crop cultivation.
- By optimizing fertilizer management practices, substantial reductions in ammonia emissions from rice, wheat, and maize crops can be achieved, contributing to environmental sustainability.
Get an IAS/IPS ranker as your 1: 1 personal mentor for UPSC 2024
Air Pollution
INSAT 3D’s Role in Monitoring Foggy Conditions in North India
From UPSC perspective, the following things are important :
Prelims level: INSAT 3D satellite
Mains level: Read the attached story

Introduction
- As large parts of North India, including regions like Bihar, Uttar Pradesh, Uttarakhand, Haryana, Delhi, and Punjab, grapple with heavy fog, the India Meteorological Department (IMD) has been issuing alerts and warnings to keep residents informed about the prevailing conditions.
- This article seeks to unravel the science behind these warnings and the role of the INSAT 3D satellite in providing crucial data for fog monitoring.
Fog Situation in North India
- Persistent Fog: Since December 2023, many parts of North India have been shrouded in heavy fog.
- IMD Warnings: On January 16, the IMD issued warnings about “very dense fog” in several states, including Haryana, Chandigarh, Delhi, Uttar Pradesh, Punjab, and Madhya Pradesh, with visibility expected to drop below 50 meters during night and morning hours.
Decoding Satellite Images
- Insights from INSAT 3D: The INSAT 3D satellite plays a vital role in monitoring foggy conditions through images.
- Solar Reflectance and Brightness Temperature: The colors in these images are determined by two factors: solar reflectance and brightness temperature.
- Solar Reflectance: Reflects the amount of solar energy reflected by a surface in relation to the energy it receives.
- Brightness Temperature: Relates an object’s temperature to the brightness of its surface, measured across various wavelengths.
Day Microphysics Data
- Solar Reflectance at Three Wavelengths: INSAT 3D’s ‘day microphysics’ component studies solar reflectance at three wavelengths: 0.5 µm (visible radiation), 1.6 µm (shortwave infrared radiation), and 10.8 µm (thermal infrared radiation).
- Color Determination: The strength of signals at these wavelengths determines the RGB (red-green-blue) colors in the image.
- Applications: These images help analyze cloud types, thunderstorm stages, snow identification, and fire detection.
Night Microphysics Data
- Complex Color Determination: INSAT 3D’s ‘night microphysics’ component derives two colors from the difference between two thermal infrared signals.
- Color Variables: Red color depends on the difference between 12 µm and 10 µm signals, green on 10.8 µm and 3.9 µm signals, and blue on the strength of the 10.8 µm signal.
- Identifying Features: Night microphysics data aids in identifying cloud types and their temperature differences.
Combining Day and Night Data
- Comprehensive Insights: Meteorologists combine day and night microphysics data to study moisture droplets, temperature variations, and track the formation, evolution, and depletion of weather events, including cyclones.
- Advanced Warning Systems: Proposed applications include predicting thunderstorms one to three hours in advance.
Radiometers and Sounders
- Satellite Instruments: INSAT 3D and 3DR use radiometers for spectral measurements and atmospheric sounders for temperature, humidity, and water vapor analysis.
- Improved Technology: These satellites offer significant improvements in spatial resolution and spectral channels compared to their predecessors, enhancing India’s weather monitoring capabilities.
Future with INSAT 3DS
- Continued Advancements: The Indian Space Research Organisation plans to launch the INSAT 3DS meteorological satellite in February 2024.
- Enhanced Capabilities: This satellite will build upon the successes of its predecessors, further enhancing India’s weather monitoring and warning capabilities.
Conclusion
- The INSAT 3D satellite, with its ability to capture and analyze day and night microphysics data, plays a pivotal role in monitoring and predicting weather conditions, including foggy scenarios, in North India.
- By understanding the intricate science behind these satellite images, meteorologists can provide timely warnings and valuable insights to protect public safety and navigate the challenges posed by severe weather conditions.
- With advancements on the horizon, India’s meteorological capabilities continue to evolve, ensuring better preparedness for weather-related events in the future.
Get an IAS/IPS ranker as your 1: 1 personal mentor for UPSC 2024
Air Pollution
Assessing India’s Progress in Air Quality Improvement
From UPSC perspective, the following things are important :
Prelims level: National Clean Air Programme (NCAP)
Mains level: Read the attached story
Introduction
- Ambitious Goals: The National Clean Air Programme (NCAP) aims to reduce particulate matter concentrations by 40% by 2026 in 131 Indian cities.
- Mixed Results: An analysis by Respirer Living Sciences and Climate Trends reveals varied progress among cities, with only a few meeting targeted declines in PM 2.5 levels.
About National Clean Air Programme (NCAP)
| Details | |
| Launch | Launched by the Ministry of Environment, Forests and Climate Change (MoEFCC) in January 2019. |
| Objective | To create a national framework for air quality management with a time-bound target for reducing air pollution. |
| Targets | Aims to reduce the concentration of PM10 and PM2.5 particles by at least 20% in five years, using 2017 as the base year. |
| Coverage | Focuses on 132 non-attainment cities identified by the Central Pollution Control Board (CPCB). |
| Non-attainment Cities | Cities that have consistently fallen short of the National Ambient Air Quality Standards (NAAQS) for over five years. |
| NAAQS Pollutants | Includes PM10, PM2.5, SO2, NO2, CO, NH3, Ozone, Lead, Benzene, Benzo-Pyrene, Arsenic, and Nickel. |
| Current Standards | Annual average prescribed limits are 40 µg/m3 for PM2.5 and 60 µg/m3 for PM10. |
| Revised Targets (2022) | Updated target of a 40% reduction in particulate matter concentration by 2026. |
| Improvement Assessment | Requires a 15% or more reduction in annual average PM10 concentration and at least 200 clean air quality days starting from 2020-21. |
Particulate Matter Reduction: Varied City Performances
- Inconsistent Declines: Among 49 cities with consistent data over five years, 27 showed a decline in PM 2.5, but only four met or exceeded targets.
- Notable Increases in Pollution: Cities like Delhi, Navi Mumbai, Mumbai, Ujjain, Jaipur, Visakhapatnam, and Pune have seen marginal declines or increases in PM 2.5 levels.
Success Stories and Regional Disparities
- Significant Reductions: Cities like Varanasi, Agra, and Jodhpur reported substantial declines in PM 2.5 and PM 10 levels.
- Uttar Pradesh’s Progress: Except for Jodhpur, cities achieving the 2026 reduction targets are predominantly from Uttar Pradesh.
- Indo-Gangetic Plain’s Pollution: The IGP remains a hotspot for high PM 2.5 levels, with 18 of the top 20 polluted cities located in this region.
Factors Influencing Pollution Levels
- Annual Variations: Pollution levels can vary significantly within a year, with northern and eastern Indian cities peaking during winter.
- Air Quality Monitoring Infrastructure: The number and distribution of continuous ambient air quality monitors significantly impact the accuracy of pollution data.
- Geographical and Meteorological Influences: The study acknowledges the need for further research to understand the impact of emissions, geography, and weather on pollution levels.
NCAP’s Progress and Future Outlook
- Noteworthy Efforts: The NCAP has made progress in reducing pollution in some cities, but the overall effectiveness remains unclear.
- Enhanced Monitoring: The addition of new air quality monitoring stations is expected to provide a clearer picture of pollution levels and aid in mitigation efforts.
Conclusion
- Persistent Pollution Challenges: Despite some successes, many urban areas continue to struggle with rising pollution levels.
- Commitment to Environmental Goals: The NCAP’s revised target reflects India’s commitment to ambitious environmental objectives.
- Need for Comprehensive Strategies: Effective air quality management requires a combination of robust monitoring, targeted policy interventions, and public awareness to achieve sustainable improvements in air quality.
Get an IAS/IPS ranker as your 1: 1 personal mentor for UPSC 2024
Air Pollution
How Satellite Data monitors Farm Fires in Northern India?
From UPSC perspective, the following things are important :
Prelims level: CREAMS Lab
Mains level: Not Much
Central Idea
- Farm fires, particularly paddy crop residue fires, contribute to air pollution in northern India. To monitor and address this issue, satellite data is utilized.
CREAMS Laboratory: Monitoring farm fires
- Agency: The Indian Agricultural Research Institute’s (IARI) Consortium for Research on Agro-ecosystem Monitoring and Modeling from Space (CREAMS) Laboratory is responsible for collecting and disseminating daily bulletins on paddy residue fires.
- Coverage: Data covers Punjab, Haryana, Uttar Pradesh, Rajasthan, Madhya Pradesh, and Delhi.
- Information Provided: The bulletin includes district-wise fire incident numbers, comparative data from previous years, location, satellite details, time, and fire intensity.
Satellite Data Collection
- Satellites: Three NASA satellites (VIIRS on Suomi NPP, MODIS on Terra and Aqua) capture data by recording land surface temperatures.
- Coverage: These satellites pass over the Indian subcontinent twice daily, with varying times.
- Resolution: VIIRS offers higher resolution, while MODIS has coarser resolution.
- Data Use: Satellite data is used to differentiate farm fires from other types, such as forest fires or industrial fires.
Monitoring Protocols
- Standardization: In 2021, a standard protocol for monitoring farm fires using satellite data was established.
- Data Comparison: Comparative data is available from 2020 onwards.
- Punjab’s Data: The Punjab Remote Sensing Centre provides similar data specific to Punjab.
Identifying Paddy Fires
- Reflectance Signature: Paddy crop residue fires are distinguished based on the unique reflectance signature of paddy fields.
- Land Surface Temperature: Active fires are identified based on land surface temperature deviations from surrounding areas.
- Fire Intensity: Intensity, expressed as energy emitted per unit area per unit time, indicates the amount of residue burned.
Bulletin Dissemination
- Recipient Agencies: Bulletins are sent to central and state-level agencies, including the Commission for Air Quality Management, the Ministry of Agriculture, and state agriculture departments.
- Action Measures: Authorities use the data to identify hotspots and plan measures, such as machinery availability, to address farm fires.
- Targets: Some states, like Punjab and Haryana, set targets for reducing farm fire incidents based on satellite data.
Get an IAS/IPS ranker as your 1: 1 personal mentor for UPSC 2024
Air Pollution
Best of Both Sides: To combat pollution, use of personal vehicles must decrease
Central idea
Delhi grapples with severe smog, prompting emergency measures to curb pollution, including restricting vehicles. Despite past efforts to mitigate vehicular emissions, the city faces challenges in reducing dependence on personal vehicles. The article emphasizes the need for stronger political will, effective restraints, and enhanced public transport to address the persistent air quality and mobility crisis in Delhi.
Key Highlights:
- Delhi faces severe smog, prompting emergency measures to curb pollution, including restrictions on vehicles.
- Vehicles contribute significantly to Delhi’s air pollution, with official data indicating a 40% emission of particulate load.
- Despite previous efforts, vehicular emissions remain challenging to mitigate, with over 80 lakh on-road vehicles in Delhi.
Challenges:
- Cumulative emissions from increasing vehicle numbers and congestion undermine emission improvements per unit.
- Personal automobile dependence persists, with a 47% growth in car numbers during 2022-23.
- The shift to public transport is hindered by inadequate infrastructure, low passenger numbers per bus, and a lack of effective restraints on personal vehicle usage.
Key Phrases:
- “Crippling mobility crisis” in Delhi due to emergency measures restricting vehicles.
- “Gut reaction” to underplay the role of vehicles in air pollution amid public criticism.
Analysis: The article underscores the persistent challenge of vehicular emissions in Delhi, despite past efforts to curb pollution. It highlights the need for a substantial shift to public transport to address the mobility crisis and reduce dependence on personal vehicles.
Key Data:
- Over 80 lakh on-road vehicles in Delhi, with car numbers witnessing a 47% growth in 2022-23.
- Transport diesel consumption reduced by 46% between 2014 and 2022.
- Only 7,041 buses against the mandated 10,000, with a 48% drop in passengers carried per bus since 2017-18.
Key Facts:
- Despite emission improvements, Delhi’s air quality remains a concern, leading to emergency measures.
- Public transport ridership faces challenges, with a drop in passengers per bus and increased empty kilometres.
- The article emphasizes the need for stronger political will to restrain personal vehicle usage and promote public transport.
Way Forward:
- Strengthen political will to implement effective restraints on personal vehicle usage, such as parking rules and congestion pricing.
- Focus on making integrated public transport more convenient, accessible, and affordable.
- Implement scalable solutions, including a dense street network for walking and cycling, and housing closer to transit nodes.
Get an IAS/IPS ranker as your 1: 1 personal mentor for UPSC 2024
Air Pollution
India’s Air Quality Management needs Transboundary Accountability
From UPSC perspective, the following things are important :
Prelims level: Airshed
Mains level: Transboundary nature of Delhi Air Pollution Menace

Central Idea
- The annual recurrence of ‘severe’ air quality levels in the Delhi-National Capital region and surrounding areas during winter often leads to the misconception that air pollution is a seasonal issue primarily driven by farm residue burning.
- However, this perception falls short of the complex, year-round, multi-source, and multi-pollutant nature of the problem.
This article highlights the need to adopt a comprehensive, science-backed approach to address air pollution effectively.
Year-round, Multi-source Pollution
- Misconception: Labelling air pollution as a ‘winter’ problem caused solely by farm residue burning oversimplifies the issue.
- Complex Reality: Air pollution is a continuous problem arising from various sources, not confined to a particular season.
- Ineffectiveness of City-Centric Strategies: Current initiatives like the National Clean Air Programme (NCAP) focus on cities, ignoring the transboundary nature of pollution.
Transboundary Air Pollution
- Understanding Dispersion: Pollution emitted in one region can significantly impact air quality in another due to transboundary dispersion.
- Inter-state Implications: Weather, topography, and climatic conditions influence transboundary dispersion, creating challenges for downwind regions.
- Limited Jurisdictional Power: Downwind regions often lack the authority to regulate upwind pollution sources, rendering mitigation strategies ineffective.
Need for Airshed Air Pollution Management
- Defining Airsheds: An airshed is a geographic area governed by common meteorology, topography, and climate, impacting air mass dispersion.
- Global Precedents: Countries like the United States, China, and the European Union have implemented effective regional airshed-level frameworks.
Policy Levers in India
- Existing Legal Framework: The Commission for Air Quality Management in National Capital and Adjoining Areas (CAQM) Act, 2021 recognizes the transboundary nature of air pollution.
- Expanding Scope: The Air Act, 1981, can be expanded to cover multiple jurisdictions and pollution sources under a single air quality management framework.
- Global Experiences: Drawing lessons from frameworks like the Cross-State Air Pollution Rule (CSAPR) in the US and the Long Range Transboundary Air Pollution (LRTAP) in Europe can inform India’s approach.
Implementation Challenges
- Accountability: Holding upwind polluting regions accountable for transboundary pollution remains a challenge, necessitating legal mechanisms and cooperation.
- Conflict Resolution: Implementing a formal procedure for resolving conflicts arising from the interpretation or application of airshed-level frameworks is crucial.
- Political Will: Ensuring consistent implementation of air quality management measures despite bureaucratic cycles and political considerations is a persistent challenge.
- Cross-Boundary Cooperation: Encouraging cooperation between jurisdictions and regions to collectively address air pollution requires coordinated efforts.
- Data Integration: Integrating data from diverse sources and ensuring uniformity in air quality monitoring can be challenging.
Way Forward
- Legal Framework Expansion: Expanding the scope of the Air Act, 1981, to encompass multiple jurisdictions and pollution sources under a single air quality management framework.
- Global Lessons: Drawing lessons from international frameworks like the Cross-State Air Pollution Rule (CSAPR) and Long Range Transboundary Air Pollution (LRTAP) to inform India’s approach.
- Accountability Measures: Legally binding upwind polluters to address transboundary pollution through mitigation plans.
- Scientific Independence: Separating scientific and technical activities from political negotiations to ensure data-driven decisions.
- Conflict Resolution Mechanism: Implementing a mechanism for resolving disputes arising from framework interpretation or application.
- Promoting Change: Integrating an airshed-level framework within existing legal structures or introducing a new framework to deliver cleaner air for citizens.
Get an IAS/IPS ranker as your 1: 1 personal mentor for UPSC 2024
Air Pollution
Cancer, heart disease, diabetes – odd-even scheme is not the answer to pollution woes
From UPSC perspective, the following things are important :
Prelims level: NACP
Mains level: One Health approach

Central idea
The article delves into the alarming air pollution crisis in Delhi and the National Capital Region, highlighting global and local concerns. It emphasizes the health impact of air pollution, particularly on vulnerable groups like children, and evaluates India’s National Clean Air Programme (NCAP) and potential strategies for effective air quality management.
Key Highlights:
- Air Quality Crisis: Delhi and the National Capital Region face a severe air pollution crisis, with the Air Quality Index (AQI) touching 500, prompting various restrictions and interventions.
- Global Air Pollution Concerns: Air pollution is a global issue, affecting low- and middle-income countries the most. The World Health Assembly Resolution 68.8 emphasizes addressing the health impact of air pollution, highlighting its role in millions of global deaths.
- India’s Efforts: The National Clean Air Programme (NCAP) launched in 2019 aims to reduce PM10 and PM2.5 concentrations by 20-30% by 2024 through diverse interventions targeting vehicular pollution, industrial emissions, waste management, and more.
| Let’s revise for prelims
India’s National Clean Air Programme (NCAP)
Ministry Under Which NCAP Operates: Operated under the Ministry of Environment, Forest and Climate Change (MoEFCC).
Establishment and Jurisdiction: Launched in 2019 to address air pollution and improve air quality. Encompasses various interventions to reduce pollution levels.
Objective: Aims to achieve a 20-30% reduction in concentrations of PM10 and PM2.5 by 2024 (base year, 2017).
Key Components: Focuses on reducing vehicular pollution through regulatory norms. Promotes public transport and enhances infrastructure. Addresses industrial emissions, waste management, and stubble burning.
Legal Framework: Aligned with existing environmental laws and regulations. Operates within the framework of the Environment (Protection) Act, 1986. |
Challenges:
- Health Impact: Air pollution, laden with pollutants like PM2.5, leads to severe health consequences, including cancer, cardiovascular diseases, respiratory issues, and neurological disorders.
- Vulnerability of Children: Children are particularly vulnerable due to developing lungs, higher exposure, and increased susceptibility to neurotoxic compounds, leading to various health issues.
- Social Gradient in Exposure: Studies indicate that air pollution often exhibits a social gradient, impacting marginalized communities more, challenging the notion that it affects everyone equally.
Key Phrases:
- Air Quality Index (AQI): Measures air pollution levels, categorized into ranges with associated health advisories. Delhi’s AQI touching 500 signifies hazardous air quality.
- NCAP: India’s National Clean Air Programme, launched to combat air pollution, emphasizing reductions in PM10 and PM2.5 concentrations through diverse strategies.
- One Health Approach: Recognizes the interconnectedness of human, animal, and environmental health, urging comprehensive actions to address the impact of land, air, and water use on well-being.
Analysis:
- Global Concerns: Nearly 90% of the global population breathes air exceeding prescribed pollution limits, with low- and middle-income countries facing the most significant impact.
- NCAP Effectiveness: The NCAP outlines specific interventions to combat air pollution, but the effectiveness of measures like the odd-even scheme in Delhi is debated, with studies showing mixed results.
Key Data:
- Health Impact: Air pollution contributes to chronic diseases and cancer, with a third of deaths from major diseases linked to air pollution, rivaling the impact of smoking.
- Global Scenario: Delhi ranked as the most polluted city globally in terms of fine particulate matter, emphasizing the urgent need for comprehensive air quality management.
Way Forward:
- Stringent Standards: Evolve more stringent air quality standards, considering the absence of safe thresholds, especially for particulates and ozone.
- Airshed-Centric Approach: Transition from city-centric to airshed-centric air quality management, recognizing the local factors affecting pollutant dispersion.
- Global Cooperation: Leverage international platforms like the G20 to address pollution in the context of climate action and promote a One Health approach globally.
In essence, the article underscores the critical need for immediate and comprehensive measures to combat the escalating air pollution crisis, emphasizing the global and local impact on health and the environment.
Get an IAS/IPS ranker as your 1: 1 personal mentor for UPSC 2024
Air Pollution
Delhi Odd-Even Scheme: Emergency Traffic Restrictions
From UPSC perspective, the following things are important :
Prelims level: Odd-Even Scheme
Mains level: Delhi Air Pollution Menace

Central Idea
- The Odd-Even scheme, designed to reduce vehicular emissions and combat severe air pollution in Delhi, has garnered attention and scrutiny.
- While this emergency action has been implemented in response to deteriorating air quality, experts emphasize that it may not be a panacea for all pollution woes.
Odd-Even Scheme
- Reduction in Vehicles: The scheme aims to curtail vehicular pollution by restricting the number of cars on the road. However, it has limitations, as it excludes two-wheelers and taxis, which are significant contributors to emissions.
- Two Aspects of Transport Pollution: Transport pollution encompasses emissions from exhaust tailpipes and wear and tear of tires and brakes. Tailpipe emissions contain pollutants like PM2.5, soot, organics, nitrogen oxides, carbon monoxide, and poly-aromatic hydrocarbons.
Why such move?
- Curbing Local Sources of Pollution: Transport is a dominant source of pollutants when considering Delhi’s local emissions. Vehicles play a crucial role in exacerbating air quality issues.
- Complex Challenges: Estimating the scheme’s exact impact on pollution levels is challenging due to multiple factors, including emissions from outside Delhi, restricted coverage of the transport fleet, and exemptions.
Prior Experience and Expert Opinions
- Experience from 2016: A study conducted on the Odd-Even scheme implemented in January 2016 indicated limited success in mitigating air pollution. PM2.5 levels decreased marginally in specific areas but not significantly citywide.
- Comprehensive Approach Needed: Experts argue that while the Odd-Even scheme can contribute to pollution reduction, it should be viewed as one element of a comprehensive strategy, combined with measures like construction halts, during periods of stagnant air.
- Not a Silver Bullet: Emergency actions, including the Odd-Even scheme, cannot independently solve air quality issues, and their effectiveness is influenced by various factors.
Assessing Impact Based on Pollution Concentration
- Air Quality Index (AQI) May Not Tell the Full Story: Experts emphasize the importance of considering pollutant concentration levels rather than relying solely on the Air Quality Index (AQI) for assessing the scheme’s impact.
- Concentration Matters: Monitoring the concentration of pollutants provides a clearer picture of the scheme’s effectiveness in reducing harmful substances in the air.
Transportation Role in Delhi’s Pollution
- Contributor to Emissions: Transport, including vehicles and cars, is a substantial contributor to PM2.5 emissions in Delhi, accounting for a significant portion of the pollution.
- Role of Four-Wheeler Cars: Four-wheeler cars contribute about 8% of emissions within the transport sector. Reducing their presence on the road can make a notable difference.
Lessons from Other Cities
- Global Precedents: Other major cities, such as Beijing and Paris, have implemented vehicle restrictions to address pollution issues.
- Comprehensive Measures: The success of such schemes often depends on their comprehensive nature and alignment with specific local conditions.
Conclusion
- The Odd-Even scheme in Delhi serves as a critical emergency measure to combat air pollution during periods of severe deterioration.
- While it can contribute to reducing vehicular emissions, experts emphasize that it should be part of a broader strategy that addresses multiple pollution sources.
- Analyzing pollutant concentration levels provides a more accurate assessment of the scheme’s impact, and it is crucial to view it in conjunction with other measures to ensure sustained improvements in air quality.
Get an IAS/IPS ranker as your 1: 1 personal mentor for UPSC 2024
Air Pollution
Delhi AQI worsens to ‘Severe Plus’
From UPSC perspective, the following things are important :
Prelims level: Graded Response Action Plan
Mains level: Air Quality Issues in Major Cities
Central Idea
- As Delhi-NCR and its environs grapple with worsening air pollution, the Air Quality Index (AQI) has gained prominence as a critical measure of air quality.
Understanding Air Quality Index (AQI)
- AQI measures how safe the air around you is for breathing. Organizations that report AQI measure the density of various pollutants in the air (such as PM2.5, PM10, nitrogen dioxide, ozone, etc) at different monitoring stations.
- The widely-used National Air Quality Index (NAQI) given by the Central Pollution Control Board is a 24-hour average.
- Its unit is micrograms per cubic meter.
- A particular amount of one pollutant may not be as harmful as the same amount of another pollutant.
- So, each pollutant’s quantity in the air is adjusted to a common scale (say, 0 to 500) that works for all pollutants.
- Finally, the pollutant with the worst sub-index determines the AQI for that time and location.
Air Pollutants covered:
- Sulphur Dioxide (SO2)
- Nitrogen Dioxide (NO2),
- Particulate Matter (size less than 10 µm) or PM 10
- Particulate Matter (size less than 2.5 µm) or PM2.5
- Ozone (O3)
- Carbon Monoxide (CO)
- Ammonia (NH3)
(Pollutants that most of us NEVER heard of-)
- Lead
- Benzene (C6H6)
- Benzo(a)Pyrene (BaP)
- Arsenic(As)
- Nickel (Ni)
Influence on Government Policy
- Graded Response Action Plan (GRAP): AQI plays a pivotal role in shaping government policies to combat air pollution. When AQI levels in areas like Delhi-NCR deteriorate, emergency measures, such as Stage 3 of GRAP, are activated.
- Immediate Action: For instance, the recent dip in AQI to the ‘severe’ category prompted immediate actions. Diesel four-wheelers not meeting BS-VI compliance were prohibited, and truck entry into Delhi was restricted. Petrol cars continued to operate under regular conditions.
About Graded Response Action Plan (GRAP)
- The GRAP was conceived as a response to the alarming findings of a WHO study in 2014, which ranked Delhi as the most polluted city globally.
- In 2016, the Supreme Court (M. C. Mehta vs. Union of India Case) approved GRAP after multiple expert consultations.
- First GRAP was notified in January 2017 by the Ministry of Environment, Forest and Climate Change.
Implementation
- Starting in 2021, the Commission for Air Quality Management in NCR & Adjoining Areas (CAQM) has taken over the responsibility of implementing GRAP.
- Prior to 2021, the Supreme Court-appointed EPCA would instruct states to enforce GRAP measures.
- In 2020, the EPCA was disbanded and substituted with the Commission for Air Quality Management (CAQM).
- The CAQM recommendations depend on the Air Quality Index (AQI) and meteorological predictions provided by the Indian Institute of Tropical Meteorology (IITM) and the India Meteorological Department (IMD).
Revised measure implemented
| Air Quality Stage | Range | Measures to be implemented |
| Stage I (Poor) | 201-300 | Enforce NGT/Supreme Court’s order on over-aged diesel/petrol vehicles. |
| Stage II (Very Poor) | 301-400 | Implement rigorous actions to combat air pollution at identified hotspots. |
| Stage III (Severe) | 401-450 | Impose strict restrictions on BS III petrol and BS IV diesel vehicles. Suspend physical classes in schools for primary grade children up to Class 5 in certain areas. |
| Stage IV (Severe Plus) | >450 | Prohibit the entry of four-wheelers registered outside Delhi, except for electric vehicles, CNG vehicles, and BS-VI diesel vehicles. |
Get an IAS/IPS ranker as your 1: 1 personal mentor for UPSC 2024
Air Pollution
Indians are choking on pollution. How can it be stopped?
Central idea
Severe health consequences of air pollution cannot be mitigated by personal protection measures alone. Clean, public transport and rapid transition away from fossil fuels are needed.
Key Highlights:
- Air pollution in India, particularly in cities like Delhi, is significantly reducing life expectancy.
- A recent report estimates an average loss of 5.3 years of life expectancy in India due to air pollution.
- Delhi, one of the most polluted cities globally, faces an even worse scenario with an estimated life loss of 11.9 years.
Challenges:
- 39 out of 50 of the world’s most polluted cities are in India, impacting both urban and rural areas.
- Pollutants monitored include PM 10, PM 2.5, nitrogen dioxide, sulfur dioxide, carbon monoxide, ozone, ammonia, lead, benzene, formaldehyde, and cadmium.
- India’s air quality standards are less stringent than WHO standards, with concerns about health risks even at lower pollution levels.
Concerns:
- Prolonged exposure to air pollution, even at satisfactory Air Quality Index (AQI) levels, can have adverse health effects.
- Geographical factors, like the landlocked Indo-Gangetic plain, exacerbate pollution levels, especially during winters.
- Both outdoor and indoor sources contribute to air pollution, impacting various regions differently.
Analysis:
- Health harms range from acute effects like respiratory issues to severe conditions such as heart attacks and strokes.
- Long-term exposure to air pollution is linked to hypertension, cardiovascular diseases, cancers, diabetes, dementia, cataracts, and more.
- Pregnant women and children are particularly vulnerable, facing risks of stillbirths, neonatal deaths, low birth weight, and developmental issues.
Key Data:
- The WHO’s PM 2.5 limit is 5 microns, while India allows 40 microns.
- Delhi’s current AQI of 126 exceeds national and WHO standards.
- 22 states meet national AQI standards, but none meet WHO standards.
Key Terms:
- Particulate matter (PM 2.5) and ultra-fine particles.
- AQI categories: Good, satisfactory, moderately polluted, poor, very poor, and severe.
- Emission sources: line, point, area, and natural sources.
- Personal protection measures, including air purifiers, masks, and breathing exercises.
Way Forward:
- Urgent measures needed for clean transport, increased public transport usage, renewable energy adoption, and waste disposal improvements.
- Addressing household air pollution through alternative fuel use and better ventilation.
- Proactive public policy, enforcement, monitoring, and innovations required to combat air pollution and its health impacts.
Get an IAS/IPS ranker as your 1: 1 personal mentor for UPSC 2024
Air Pollution
Why Mumbai is witnessing more poor air quality days
From UPSC perspective, the following things are important :
Prelims level: NA
Mains level: Mumbai Air Pollution

Central Idea
- Mumbai, known for its coastal breeze and cleaner air, is grappling with an annual decline in air quality, resembling Delhi’s long-standing pollution woes.
- The city’s coastal location, once considered a safeguard against air pollution, is no longer a reliable defense.
Air Quality Deterioration in Mumbai
- Geographic Advantage Eroded: Mumbai’s coastal location was historically its shield against air pollution, with sea breezes dispersing particles.
- Comparable Pollution Levels: Last year, Mumbai experienced an extended period of poor air quality, overlapping with Delhi’s notorious smog issue.
Meteorological Influence
- Crucial Wind Patterns: Winds’ direction and strength play a pivotal role in shaping Mumbai’s air quality. Despite similar pollutant emissions to Delhi, the city’s coastal nature provides an advantage.
- Sea-Land Wind Cycle: Typically, winds alternate between sea-to-land and land-to-sea movements every few days, aiding natural cleansing. Disruptions in this cycle can impact air quality.
Reasons for such poor air quality
- La Nina’s Role: The recent dip in La Nina, characterized by ocean surface cooling and altered wind patterns, contributed to elevated particulate matter levels in Mumbai.
- Prolonged Pollution: La Nina’s influence delayed the expected strong wind reversal from the sea, trapping pollutants in the lower atmosphere for extended periods.
- Change in Weather Phenomenon: La Nina has given way to El Nino, albeit weaker. Its specific impact on Mumbai’s air quality remains uncertain.
- Prevalent Construction Projects: The city is currently witnessing construction activities at a staggering 6,000 sites, posing a significant challenge to air quality.
- Dust Displacement: Dust particles from roads and vehicles transporting construction debris add to Mumbai’s pollution burden.
- Domestic Sources: Restaurants, dhabas, and eateries using unclean oils for cooking release ultrafine particles, oil droplets, and condensed organic compounds, along with harmful gases such as nitrogen dioxide and carbon monoxide.
How local weather fuels it?
- Calm Winds and Temperature Gradient: As the monsoon retreated, Mumbai experienced calmer winds. A substantial temperature difference between the city and nearby Sahyadri ranges led to winds carrying dust from construction sites in Navi Mumbai.
- Local Weather Not Sole Culprit: Unfavorable local weather conditions are not solely responsible for Mumbai’s air quality decline.
- Baseline Pollution High: Mumbai’s consistent and escalating pollutant emissions are exceeding its environmental capacity.
- Economic Growth: Increased economic activity, higher vehicle numbers, extensive construction, and elevated consumption contribute to rising emissions.
Conclusion
- Mumbai’s air quality predicament signals the urgency of addressing escalating pollution sources and fortifying mitigation measures.
- While meteorological conditions play a role, the city’s growing economic activity and emissions are the driving forces behind its deteriorating air quality.
- Relevant authorities must take proactive steps to combat this issue and ensure a healthier environment for its residents.
Get an IAS/IPS ranker as your 1: 1 personal mentor for UPSC 2024
Air Pollution
For an expanse of blue, with air so clean
From UPSC perspective, the following things are important :
Prelims level: Climate change
Mains level: The problem of air pollution, serious threat, efforts in progress and viable solutions
What’s the news?
- According to UN Secretary-General António Guterres, the Earth has entered an era of global boiling, marked by scorching heatwaves, devastating floods, and erratic weather patterns.
Central idea
- With scorching heatwaves, devastating floods, and erratic weather patterns becoming the new normal, the urgency to address the triple-planetary crisis of biodiversity loss, climate change, and pollution has never been more apparent. Amidst this global turmoil, it’s crucial to recognize that one silent but deadly adversary is among us: air pollution.
The Silent Killer: Air Pollution
- Global health statistics are grim, with lung cancer claiming 10 million lives worldwide in 2020, a number projected to rise by another 3.2 million by 2050, according to a report by the Indian National Institute of Health.
- South Asia, home to two billion people, is a grim example, hosting nine of the world’s ten most polluted cities, with Delhi topping the list.
- Despite some progress in terms of Air Quality Index (AQI) improvements, Delhi remains in the grip of perilous air pollution, especially during the winter months.
The Looming Threat of Air Pollution
- Lung cancer, cardiovascular disorders, respiratory ailments, and mental health issues continue to devastate lives.
- Delhi’s air, laden with sulfur dioxide, nitrogen oxides, high particulate matter, carbon monoxide, and ozone, deprives over 30 million residents of their basic human right to breathe clean air.
- Vulnerable groups like immunocompromised individuals, pregnant women, children, and the elderly suffer disproportionately.
- In 2019, a Lancet report attributed 1.67 million deaths in India to air pollution, accounting for a staggering 17.8% of total deaths in the country.
Efforts in Progress to Combat Air Pollution
- PUSA Decomposer: The Indian Agricultural Research Institute (IARI) has developed the PUSA Decomposer, which employs biotechnology to tackle agricultural pollution. This innovative solution addresses the burning of crop residues, a significant contributor to air pollution.
- State-level Policies: Many state governments have implemented policies like GRAP 3 (Graded Rapid Action Plan) to monitor air quality in pollution hotspots. The establishment of Green War Rooms represents a proactive approach to managing and mitigating air pollution in these regions.
- Startups and Innovation: Numerous startups, often led by young entrepreneurs, are actively engaged in finding sustainable solutions to air pollution. These initiatives include the conversion of agricultural waste into valuable products, reducing the environmental impact of farming practices.
International Initiatives and Collaborations to Combat Air Pollution
- UNESCO Initiatives: UNESCO has undertaken various initiatives to address air pollution. One notable initiative is the implementation of an internal carbon tax on all flight tickets. This tax aims to reduce carbon emissions from air travel, a significant contributor to global air pollution.
- World Air Quality Project: The World Air Quality Project provides real-time air quality data, allowing residents to make informed decisions about their activities and travel based on current air quality conditions. This empowers individuals to protect their health by avoiding areas with poor air quality.
- Collaboration with UNEP: UNESCO collaborates with the United Nations Environment Programme (UNEP) on environmentally conscious practices. For example, the ‘Virtual Meetings’ project promotes digital working to reduce the need for travel and its associated carbon emissions.
- Clean-Air-For-Schools: UNESCO’s Clean-Air-For-Schools program focuses on spreading education and awareness about clean air among students and the wider community. This initiative aims to engage future generations in the fight against air pollution.
- Promotion of Sustainable Practices: International initiatives also promote sustainable practices in various sectors. This includes the adoption of electric vehicles, the replacement of traditional lighting systems with energy-efficient LED arrangements, and the implementation of solar-powered offices to reduce carbon emissions.
- Protection of Historical Sites: Efforts are underway to protect historical and cultural sites from the harmful effects of air pollution. Developing strategies to curb air pollution in the vicinity of these sites is essential for their preservation.
- Green Solutions: UNESCO encourages the development of green solutions, such as urban forests, parks, and green corridors, to mitigate air pollution in urban areas.
Viable solutions to combat air pollution
- Urban Planning and Design: Cities worldwide are adopting innovative urban planning and design strategies to prioritize human health and environmental sustainability. Car-free zones, green spaces, and smart urban layouts can significantly reduce air pollution by promoting alternative transportation methods and reducing traffic congestion.
- Public Transportation: Electrified public transportation systems, including electric buses and trains, offer a sustainable and low-pollution alternative to traditional fossil-fuel-powered vehicles. These initiatives reduce emissions and contribute to cleaner air in urban areas.
- Nature-Based Solutions: Integrating nature-based solutions, such as urban forests, parks, and green corridors, into urban landscapes can help absorb pollutants and improve air quality. These green spaces also provide additional benefits for public health and well-being.
- Biotechnology: Innovative biotechnology, like the PUSA decomposer mentioned earlier, can play a crucial role in reducing agricultural pollution, a significant contributor to poor air quality.
- Renewable Energy: Transitioning to clean and renewable energy sources can significantly reduce the air pollution associated with fossil fuel combustion. China’s shift to clean energy and electrified mobility serves as a prime example of this transition’s positive impact.
- Sustainable Farming Practices: Initiatives like Indonesia’s Carbon Efficient Farming Project and efforts in Thailand and Vietnam to reduce open straw burning demonstrate the importance of adopting sustainable agricultural practices to minimize air pollution.
- International Collaboration: Global initiatives, such as those by UNESCO and the World Air Quality Project, facilitate international cooperation to combat air pollution. These efforts include measures like implementing carbon taxes on flight tickets and promoting environmentally conscious practices.
- Youth-Led Advocacy: Young activists worldwide are actively raising awareness about air pollution and advocating for cleaner air. Their efforts, including real-time air quality data monitoring and environmental education, play a vital role in inspiring change.
Conclusion
- The time for action is now. The problem of air pollution was created by people, and it is people who must find and implement solutions, supported by effective air quality policies and action plans. The choice is ours, and it is one that demands urgency, resolve, and a collective commitment to securing a cleaner, healthier world for all.
Get an IAS/IPS ranker as your 1: 1 personal mentor for UPSC 2024
Air Pollution
TEMPO: NASA device to Monitor Air Pollution from Space
From UPSC perspective, the following things are important :
Prelims level: TEMPO Mission
Mains level: Air Pollution monitoring

SpaceX Falcon 9 rocket successfully launched carrying a new NASA device named Tropospheric Emissions Monitoring of Pollution (TEMPO) designed to monitor air pollutants and their emission sources across North America from space more comprehensively than ever before.
What is TEMPO?
- TEMPO is an instrument developed by NASA, which will enable scientists to monitor air pollutants and their emission sources from space, down to the neighbourhood level.
- This instrument will measure pollution and air quality across greater North America on an hourly basis during the daytime.
TEMPO’s special features
- TEMPO is unique because it will be hosted on an Intelsat communications satellite in geostationary orbit, about 22,236 miles (35,786 km) above the equator.
- This will allow the instrument to match the rotation of the Earth, meaning it will stay over the same location (North America) at all times.
- It will be able to measure atmospheric pollution down to a spatial resolution of 4 square miles (10 square km), or neighbourhood level.
Applications of TEMPO
- TEMPO will have multiple applications from measuring levels of various pollutants to providing air quality forecasts and helping the development of emission-control strategies.
- The data will be used by the US Environmental Protection Agency (EPA), the National Oceanic and Atmospheric Administration (NOAA), and other agencies responsible for tackling atmospheric pollution.
Importance of the mission
- According to the American Lung Association, more than 40% of the US population, 137 million people, live in places with unhealthy levels of particle pollution or ozone, and air pollution is blamed for some 60,000 premature deaths a year.
- TEMPO will track pollutants like nitrogen dioxide, produced from the combustion of fossil fuels, formaldehyde, and ozone.
Get an IAS/IPS ranker as your 1: 1 personal mentor for UPSC 2024
Air Pollution
Air Pollution in Mumbai: An unusual phenomenon needs to be studied
From UPSC perspective, the following things are important :
Prelims level: Air pollution
Mains level: La Nina and Climate change attributed air pollution

Context
- Anthropogenic emissions are central to environmental issues, whether climate change or air quality. During the peak winter months of November to January in 2022-23, air quality in India’s financial hub, Mumbai, noticeably deteriorated, a taste of what Delhi encounters frequently.
Crack Prelims 2023! Talk to our Rankers
Mumbai’s deteriorated air quality
- Out of the past 92 winter days, Mumbai observed 66 poor and very poor air quality days in 2022-23 as compared to just 28 in the past three years’ average. More so, it had just one day in the permissible limit (NAAQS) this year as against the average of 15 days in the recent past.
- Good days declined, but foul days have increased by a whopping 135 per cent, leaving residents more choked and breathless than they have been in years.
- On many days during these months, the air quality in Mumbai sank lower than in Delhi.
- These findings are from India’s first indigenously-developed forecasting framework, SAFAR.
What caused this unusual development in Mumbai?
- Mainly due to emissions from anthropogenic and natural sources: Air quality deteriorates mainly due to emissions from anthropogenic and natural sources, and weather manoeuvres.
- La Nina, attributed to climate change, has played an unusual role: The reason for the sudden spike in the current pollution cycle in Mumbai is part of a larger meteorological phenomenon that needs to be studied further. Research suggests that the unprecedented triple dip in La Nina, attributed to climate change, has played an unusual role.
- Extreme weathers due to climate change but linkage with air quality remains elusive: Scientists have discovered that climate change is leading to extreme weather, changes in the ecosystem, and human displacements, but linkages with air quality remain elusive.
Value addition
- The weather or climate cannot generate emissions.
- Some cities like Delhi have a disadvantage due to their geographical location, being landlocked.
- But coastal cities like Mumbai enjoys a natural cleansing advantage.
- Stronger surface winds favour faster dispersion and wind reversal cycles of strong sea breezes that sweep away air pollutants from the land.
How this phenomenon has played an unusual role?
- Change in wind patterns: This phenomenon has led to the change in wind patterns affecting Mumbai, with frequent calmer wind spells, and delayed cleaner sea wind reversal around the region.
- Reducing dispersal rate of pollutants: This, in turn, affects the natural cleansing mechanism of the city by reducing the dispersal rate of pollutants and trapping the newly generated high-flying dust emissions.
- Import of transboundary pollution: The import of transboundary pollution from more polluted regions due to wind pattern changes is also adding to the misery. An increase in all sizes of particles (coarser and finer) has been observed.
- Dust emission is the major reason: It is scientifically prudent to conclude that the major share in the current worsening of air quality is from dust emissions. Many redevelopment and construction projects are operational across the city. So, the increase is due to intensifying emissions at the source, which usually consist of PM 2.5 made up of transport (31 per cent), industries (20 per cent), and resuspended dust (15 per cent), besides other smaller sources.
All you need to know about “SAFAR”
- SAFAR stands for System of Air Quality and Weather Forecasting and Research.
- It is an initiative of the Union Ministry of Earth Sciences for greater metropolitan cities of India to provide location-specific information on air quality in near real time and its forecast 1-3 days in advance.
- It was started under the plan scheme Metropolitan Advisories for Cities for Sports, Tourism (Metropolitan Air Quality and Weather Services)
- The SAFAR system is developed by Indian Institute of Tropical Meteorology, Pune, along with ESSO partner institutions namely India Meteorological Department (IMD) and National Centre for Medium Range Weather Forecasting (NCMRWF)
- The implementation of SAFAR is done with an active collaboration with local municipal corporations and various local educational institutions and governmental agencies in that Metro city.
- It was started on a Pilot basis in the cities of Pune, Ahmadabad, New Delhi and Mumbai.
Way ahead
- The battle against air pollution is long and difficult, but success is achievable beyond doubt.
- Putting green curtains around construction sites, regularly sprinkling water on truck tyres and debris before loading and unloading material, and ensuring smooth traffic flow to overcome snarls are some of the immediate remedies.
- In the medium term, transitioning to electric vehicles, addressing solid waste management, dumping grounds, and industrial toxin management are some actions that will help us achieve better air quality.
Conclusion
- Before we start to address the problem, we need to recognise it. Acting together and strengthening the fight against air pollution should be the order of the day. The situation is not currently urgent, but it is a clear early sign of the impact climate change can have. Hence, we must address the root cause of the problem anthropogenic emissions instead of looking for shortcuts.
Mains question
Q. Anthropogenic emissions are central to environmental issues, whether climate change or air quality. Give examples to support your arguments.
Get an IAS/IPS ranker as your 1: 1 personal mentor for UPSC 2024
Air Pollution
What is missing in Delhi’s breathing
From UPSC perspective, the following things are important :
Prelims level: Air pollution
Mains level: Impact of Air pollution and Delhi's annual air pollution problem and way ahead

Context
- Every year around Deepavali, and like clockwork, Delhi’s air quality makes it to the headlines. As firefighters we are doing well, but as planners doing very little. While nature will not change, emissions can be reduced. While a lot has been written and said about Delhi’s air quality, the question that still has to be answered is this: why is nothing changing after all these years?
Air pollution and its impact
- Air pollution a health crisis in making: Increasingly polluted air is a hazard and a health crisis in the making, in fact, it is already one.
- Air pollution related death in India: India now reports 2.5 million air pollution-related deaths annually.
- Air pollution not confined to external hazard: Pollution not only makes our throats and eyes burn but is much more insidious.
- Pollutants can enter bloodstreams: Some pollutants are so small that they are able to enter the bloodstream with ease, impacting almost every organ in the body and leading to the onset of health issues such as stroke, heart diseases, respiratory diseases and cancer, to name just a few serious health problems.
Click and get your FREE Copy of CURRENT AFFAIRS Micro Notes

Critique: Why is nothing changing after all these years?
- Applying same approach without through evaluation: A principal reason is that year after year, we are doing the same things to try and address the problem without actually trying to evaluate why those measures are not effective.
- Inefficiency of Commission for Air Quality Management: The Government formed the Commission for Air Quality Management, which, unfortunately, did not offer anything new. This body essentially issued the same orders the Ministry and the Environment Pollution (Prevention and Control) Authority used to, with just a slight change in the language used.
- Same advisory every year than the preventive measures: Every year schools are closed, people are advised to to stay indoors, or carpool and work from home, bans on firecrackers are reinforced, construction stopped, trucks and cars not allowed to enter the city, and industries running on fuel shut. These measures, and several others, are akin to dressing a bullet wound with band-aid.
Analysis: Is it only stubble burning is the culprit behind Delhi’s air pollution?
- Delhi’s bad air when stubble is not being burnt: Stubble burning in the neighbouring States being identified as the main culprit. However, the reality is that Delhi’s air is bad even when stubble is not being burnt.
- Burning of biomass in and around Delhi: The burning of biomass in and around Delhi, if audited properly, would be the same as stubble burning in other States. Unfortunately, none of the bodies, be it the municipal body or the government’s Public Works Department, is willing to take responsibility for this or address and find a solution to the problem.
- Less compliance on construction activities: Delhi chokes on its own dust and industrial activities. No clarity on how and who is ensuring compliance with the rules relating to the handling of construction and demolition waste.
- Heavy reliance on private Vehicles which is another major source of pollution: Vehicles are another source of pollution in the city. Despite an expanding fleet of public transport, citizens who primarily use two-wheelers have not moved to using the public transport system, buses and the metro. Reasons for this may include last-mile connectivity, the problem of crowding in buses and metros, and the inability to reach and navigate narrow lanes that two-wheelers can. The state of maintenance of buses could be another reason as well.

What needs to be done?
- Look beyond the measures that have already been tried: We have to be creative and look beyond the measures that have already been tried and proved they are at best a short-term solution to a recurring, long-term problem.
- Making efficient and coordinated governance mechanism: Core issue that needs to be addressed is the governance system. There needs to be a single entity that takes responsibility for air quality management. We cannot operate in silos where one system of governance is responsible for thinking, a second issues orders and a third is responsible for implementation. There need to be an efficient system that works in a coordinated way.
- Acknowledge the reality and not just taking the actions in the time of crisis: The reality also is that Delhi is not the sole offender. There are many other cities in India where safe levels of air quality are breached regularly. We need to take more comprehensive, long-term measures throughout the year and not just in the days and weeks when it begins to make news.
Conclusion
- This is not to say that stubble burning is not a problem. Some solutions have been tried out over the years, but with little success. Unless farmers are adequately compensated, the problem is unlikely to go away. What is required is a fundamental shift in agricultural patterns, and a strong political will to take bold decisions.
Mains question
Q. Do you agree with the statement that only stubble burning is the culprit behind Delhi’s air pollution?
Get an IAS/IPS ranker as your 1: 1 personal mentor for UPSC 2024
Air Pollution
Urban Pollution
From UPSC perspective, the following things are important :
Prelims level: Pollution related facts
Mains level: Air and Water pollution, Impact on health and measures

Context
- More than 1,10,000 infants are likely to have been killed by air pollution in India in 2019, almost immediately after being born while long-term exposure to outdoor and household air pollution was estimated to be responsible for about 1.67 million annual deaths amongst the adult population in the country.
What is pollution?
- Pollution is the introduction of harmful materials into the environment. These harmful materials are called pollutants. Pollutants can be natural, such as volcanic ash. They can also be created by human activity, such as trash or runoff produced by factories. Pollutants damage the quality of air, water, and land.

Menace of air pollution in urban areas
- Demands for air purifiers: Demand for air purifiers has boomed. Recently, in Delhi, pollution-related curbs were lifted and schools opened, despite air quality continuing to be in the “very poor” category.
- Health related problems: For the majority of urban north Indians who can’t afford air purifiers, life continues amidst dust, cough and breathlessness.
- Children are most affected: Our children in urban localities are growing up with stunted lungs, amidst poverty.
- High percentage of respiratory problems: Eighty per cent of all families in Delhi are noted to be suffering respiratory ailments due to severe pollution.
How we can reduce the air pollution?
- Expand green cover across urban areas to reduce dust pollution: Ahmedabad’s municipal corporation, for instance, has experimented with urban forests, with the city’s 43rd urban forest inaugurated in June 2021 over 20,000 trees have been in 7,625 sq. metres. Chandigarh has about 1,800 parks. Close to 46 per cent of the city was classified as a green area in 2019.
- Use of Miyawaki technique: Civil society could also help in Chennai, the NGO Thuvakkam, with a volunteer force of 1,800, has been able to grow 25 Miyawaki forests, raising over 65,000 trees. Such plantations are now being replicated in other cities including Tuticorin, Vellore and Kanchipuram.
- Push for airshed management: With a focus on understanding meteorological, seasonal and geographic patterns for air quality across a large region. In the US, the passage of the Air Quality Act (1967) saw the state of California being divided into 35 districts which had similar geographic and meteorological conditions and pollution was regulated at the state level. This approach was successful in reducing emissions by 98 per cent from 2010 to 2019.
- Heavy penalty on polluting cars: Inspiration can also be taken from London’s air pollution revolution an Ultra-Low Emission zone has been established in Central London, with hefty daily fees on cars that emit more than 75g/km of pollution.

Water pollution in Indian cities
- Untreated water into freshwater bodies: 72 per cent of urban sewage is untreated in India’s urban freshwater bodies. The Central Pollution Control Board reckons that more than 50 per cent of 351 river stretches (on 323 rivers) are polluted. Over 4,000 septic trucks (with each truck having 5,000 litres of human waste) dispose of their waste in the Ganga every day. In Delhi, about 941 MLPD of raw sewage finds its way to the river, killing off fish and preventing rituals on the banks.
- Riverine Pollution: Riverine pollution causes due to raw sewage overflowing from sewage treatment plants, untreated waste from unauthorized colonies, industrial effluents, sewer water from authorized colonies and inter-state pollution.
- Water scarcity: More than 40 per cent of Indians are expected to face water scarcity by 2050 and close to 35 million will face annual coastal flooding with sea level rise.
- Lack of planning: Apathy prevails as of May 2021, only 16 Indian cities had disclosed their plans to tackle climate change to international institutions, with only eight having actual sustainability-related targets in their urban master plans. Only 43 per cent of all Indian cities surveyed actually sought to address climate change adaption as a topic in their master plans, while only five had a GHG emission reduction target.

Do you know this harsh reality?
- In India, nearly 7 lakh premature deaths are attributed to water pollution
- Globally, 1.5 million children under five years die each year as a result of water-related diseases.
How to fight water pollution?
- Improving sewage treatment plant capacity: ensuring linkages with the drainage network. Mangalore’s City Corporation (MCC) has wastewater treatment plants with end-user linkages. The MCC offered to supply treated water to such industrial end-users in the city’s special economic zone if the latter agreed to fund about 70 per cent of the operations and maintenance cost of the pumps and the sewage treatment plant.
- Developing a sanitation network: The problem of untreated waste and sewer water from unauthorized colonies can be solved by investing in a sewerage network. Consider the example of Alandur, a small suburb of Chennai in 2000, it had no underground sewage lines, with most houses dependent on septic tanks. In the late 1990s, the local municipality in partnership with local resident welfare associations conducted collection drives to gain deposits (ranging from Rs 1,000 to Rs 1,500) for developing a sanitation network.
- Pump house: The project was launched with a push for creating a pump house, setting up over 5,650 manholes and providing sewerage connections to 23,700 households, a sewage treatment plant with a 12 MLD capacity was also set up. Going forward, many other municipalities in Tamil Nadu have sought to adopt this model.
- A systems-based approach should be adopted: along with a push for protecting “blue infra” areas places that act as natural sponges for absorbing surface runoff, allowing groundwater to be recharged. At the household level, we can encourage citizens to take up rainwater harvesting, urban roof terrace greening, urban roof water retention tanks and having a green corridor around residential buildings.
- Water permeable roads: Municipalities could be encouraged to make existing roads permeable with a push for green landscaping and rain gardens. At the city level and beyond, policymakers should push for “sponge cities” and incorporate disaster planning. A mindset shift, in citizenry and policymakers, is urgently needed.
Conclusion
- Urban planning and urban pollution are largely neglected in our governance model. Unplanned cities are facing the various problems. We must embrace the technology to fight the pollution in urban India.
Mains Question
How severe is the problem of Urban pollution? What steps can be taken to fight the urban pollution in India?
Click and Get your FREE copy of Current Affairs Micro notes
Get an IAS/IPS ranker as your 1: 1 personal mentor for UPSC 2024
Air Pollution
Genesis of the Delhi Air Pollution and its mitigation
From UPSC perspective, the following things are important :
Prelims level: Read the attached story
Mains level: Delhi Air Pollution issue

As the situation becomes an annually recurring one in New Delhi and NCR, here’s a look at how far back it goes and what policies have been adopted by the Centre and Delhi’s elected governments to curb air pollution over the years.
Do you know?
In November 2016, in an event known as the Great Smog of Delhi, the air pollution spiked far beyond acceptable levels. This tagged New Delhi to be world’s most polluted city ever.
Causes of Poor Air Quality
- Motor vehicle emissions are one of the causes of poor air quality.
- Badarpur Thermal Power Station, a coal-fired power plant was another major source of air pollution in Delhi.
- The drift/mist emissions from the wet cooling towers are also a source of particulate matter as they are widely used in industry and other sectors for dissipating heat in cooling systems.
- Although Delhi is kerosene free and 90% of the households use LPG for cooking, the remaining 10% uses wood, crop residue, cow dung, and coal for cooking. (Census-India, 2011)
- Fires in Bhalswa landfill is a major reason for airborne particles in Delhi.
- Burning of effigies during Vijayadashami and bursting of firecrackers burning during Diwali is often accused by the left-wing activists to cause of Delhi’s poor air quality.
- Agricultural stubble burning in Haryana and Punjab, coupled with north-westerly winds also affects Delhi’s air quality since the 1980s when crops are being harvested.
Evolution of policies
(1) Recognition of the broader issue (1995)
- In March 1995, the Supreme Court, while hearing a plea by environmentalist and lawyer M.C. Mehta about Delhi’s polluting industries
- It noted that Delhi was the world’s fourth most polluted city in terms of concentration of suspended particulate matter (SPM) in the ambient atmosphere as per the WHO’s 1989 report.
(2) Identifying major pollutants (1996)
- The Court took note of two polluting factors — vehicles and industries.
- In 1996, the court ordered the closure and relocation of over 1,300 highly-polluting industries from Delhi’s residential areas beyond the National Capital Region (NCR) in a phased manner.
- In 1996, Mr. Mehta filed another public interest litigation (PIL) alleging that vehicular emissions were leading to air pollution and that it posed a public health hazard.
(3) Action plan by Delhi Govt. (1996)
- The Delhi government submitted an action plan to the apex court.
- The court recognised the need for technical assistance and advice in decision-making and implementation of its orders.
(4) Establishment of EPCA (1998)
- The Supreme Court asked the Environment Ministry to establish an authority for Delhi, leading to the creation of the Environmental Pollution Control Authority of Delhi NCR (EPCA) in 1998.
- The EPCA submitted its report containing a two-year action.
- The Court subsequently ordered the Delhi Transport Corporation (DTC) bus fleet, taxis, and autos to switch to Compressed Natural Gas (CNG), and the phasing out of all pre-1990 autos.
- Coal-based power plants within Delhi were also converted to gas-based ones.
(5) National Air Quality Programme (NAMP)
- Around the same time, the Centre decided to establish a network of monitoring stations under the National Air Quality Programme (NAMP) to measure key pollutants.
- The NAMP monitors the four major pollutants as part of the AQI – sulphur dioxide, oxides of nitrogen, respirable particulate matter and fine particulate matter.
- It also checks wind speed and direction along with relative humidity and temperature.
How were air quality standards revised?
- The National Ambient Air Quality Standards (NAAQS) were specified by the Central Pollution Control Board (CPCB).
- It identified pollutants like PM10 (particulate matter with a diameter exceeding 10 microns), sulphur dioxide and nitrogen oxides were measured.
- The NAAQS were revised in 2009 to include 12 categories of pollutants including PM2.5 (particulate matter with a diameter under 2.5 microns
- Particulate Matter (PM) is primarily generated by fuel combustion from different sectors, including transport, energy, households, industry and agriculture.
Arriving finally at: Graded Response Action Plan (GRAP)
- According to the revised NAAQS, the acceptable annual limit for PM2.5 is 40 micrograms per cubic metre (ug/m3) and 60 ug/m3 for PM10.
- In the winter of 2016, Delhi witnessed one of its worst incidents of pollution-induced smog, with PM2.5 and PM10 levels reaching a whopping 999 ug/m3 in parts of Delhi on November 1.
- Subsequently, the Supreme Court in November 2016 told Delhi and NCR authorities to form a plan to deal with the air pollution.
- The MoEFCC in early 2017 came out with the Graded Response Action Plan (GRAP).
Try this question from CS Mains 2015:
Q.Mumbai, Delhi and Kolkata are the three megacities of the country but the air pollution is a much more serious problem in Delhi as compared to the other two. Why is this so?
Click and get your FREE Copy of CURRENT AFFAIRS Micro Notes
Get an IAS/IPS ranker as your 1: 1 personal mentor for UPSC 2024
Air Pollution
State Pollution Control Boards (SPCBs)
From UPSC perspective, the following things are important :
Prelims level: Role of SPCB
Mains level: Issues faced by SPCB and Suggested Solutions to making it effective
Context
- In the fight against air pollution in the Indo Gangetic Plain, there are several important protagonists, none more so than India’s frontline environmental regulators, the State Pollution Control Boards (SPCBs), and the Pollution Control Committees (PCCs) in the Union Territories. There is no future with clean air in which the SPCB’s do not perform at the highest level possible.
know about State Pollution Control Boards (SPCB)
- Constituted under Water (Prevention and Control of Pollution) Act, 1974: The SPCBs were initially constituted under the Water (Prevention and Control of Pollution) Act, 1974. Under the Air (Prevention and Control of Pollution) Act, 1981, the SPCB mandate was expanded to include air quality management.
- New responsibility without capacity: Subsequently, several new environmental regulations added to their roles and functions. Unfortunately, this enhanced mandate has not been matched with increased capacity and capability in the Boards. As environmental indicators such as air quality and water quality worsen in many parts of the country, the Boards are evidently failing to effectively discharge their statutory mandate.
Analyzing the performance of SPCB’s
- Poor performance of SPCBs: Over the years, several reports that have been published, including those by the parliamentary standing committee and government committees, have identified reasons for the poor performance of the SPCBs.
- Experts are excluded from composition: The composition of SPCBs is a matter of serious concern as important stakeholders and those with crucial expertise are missing in most States. Boards are multimember bodies headed by a chairperson and a member secretary. Their decisions and policies guide the day-to-day functioning of the organisation.
- Conflict of interest: Over 50% of the Board members across the 10 SPCBs and PCC studied represent potential polluters: local authorities, industries, and public sector corporations. They are subject to the SPCB’s regulatory measures, and their overwhelming presence raises fundamental questions around conflicts of interest.
- SPCBs Does not meet the statutory requirement: At the same time, scientists, medical practitioners, and academics constitute only 7% of the Board members. What is even more worrying is that most Boards do not meet the statutory requirement of having at least two Board members who have knowledge of, and experience in, air quality management.
- SPCB’s leadership and uncertain tenure: The chairperson and the member secretary do not enjoy a long, stable, and fulltime tenure. In many States, persons in these two posts hold an additional charge in other government departments. Data also show that several chairpersons and member secretaries have held their posts for less than a year. For example, the shortest tenure for a chairperson has been 18 days (Chhattisgarh) and 15 days for a member secretary (Haryana and Uttar Pradesh).
- Short tenure with multiple roles: With the focus of the leadership of SPCB spread thin across multiple roles and their tenures being short, often they do not even have the time to understand their mandate fully before they are moved out. In such a scenario, long term policy planning, strategic interventions and effective execution aimed at reducing air pollution substantially are extremely difficult.
- Problem of Understaffing: The SPCBs are critically understaffed. At least 40% of all sanctioned posts are vacant across nine SPCBs/PCCs for which there is data. Vacancy levels in technical positions are as high as 84% in Jharkhand, and over 75% in Bihar and Haryana. An inadequate staff strength forces the Boards to recast their priorities among their various functions.
- Less regulatory scrutiny: Less staff strength also means weaker regulatory scrutiny and poor impact assessment. For example, given their workload, engineers in Bihar, Jharkhand, Punjab and Uttar Pradesh have less than a day to inspect, evaluate and decide on each consent application. With Board staff running on empty, this is clearly an unsustainable situation.
What are the recommendations for effective SPCBs?
- Addressing Leadership and human resource needs: Strengthening manpower at the SPCBs will not only require hiring new resources, but also training existing staff by leveraging institutions such as the Indian Institutes of Technology, NEERI, and others. These in-service training programs would also serve as an incentive for staff both new and existing.
- Better Pay structures: The Pay structure need to be revised to align with sectoral norms to ensure that SPCBs are not regularly losing trained manpower to industry and other sectors.
- Modern infrastructure: The infrastructure of PCBs also needs to be improved along with manpower i.e., facilities such as adequate computers, improved lab facility etc. The instruments used for monitoring are not maintained properly or outdated. Sometimes labs are also not equipped enough to do the necessary analysis.
- Expert should lead the SPCBs: It is imperative for their effective functioning that States should nominate to leadership positions, individuals of technical expertise and distinguished service such that effective decision making can be carried out.
- Providing the fixed tenure: They should be appointed for a fixed tenure and in full-time roles, with the sword of removal or termination not hanging over their heads.
- Reduction is composition for effective functioning: The size of the boards themselves may also be reduced to aid in effective functioning, with preference in membership given to technical experts, as is the international best practice. These moves would ensure that the Boards function effectively as independent agencies, as envisioned in their foundational legislation.
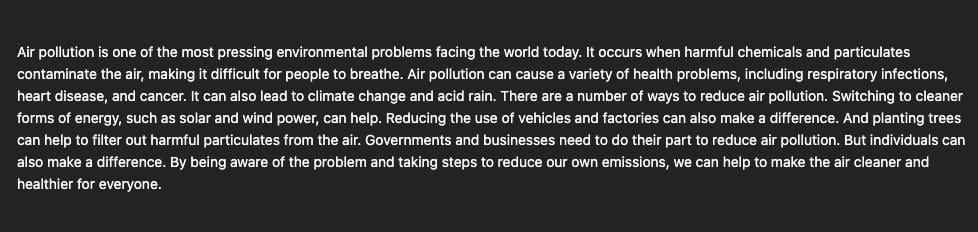
Read the basics-Air pollution
- Air pollution is contamination of the indoor or outdoor environment by any chemical, physical or biological agent that modifies the natural characteristics of the atmosphere.
- Household combustion devices, motor vehicles, industrial facilities and forest fires are common sources of air pollution. Pollutants of major public health concern include particulate matter, carbon monoxide, ozone, nitrogen dioxide and sulfur dioxide. Outdoor and indoor air pollution cause respiratory and other diseases and are important sources of morbidity and mortality.
Conclusion
- Given the scale and causes of air pollution in India, multidisciplinary expertise is needed to tackle it; there must also be an explicit focus on health while designing air pollution policy. The lack of expertise and skewed representation of stakeholders on the Boards can only be a hindrance to effective policy making.
Get an IAS/IPS ranker as your 1: 1 personal mentor for UPSC 2024
Air Pollution
What is Air Quality Index (AQI)?
From UPSC perspective, the following things are important :
Prelims level: Air Quality Index
Mains level: Not Much


Air Quality Index (AQI)
- AQI measures how safe the air around you is for breathing. Organizations that report AQI measure the density of various pollutants in the air (such as PM2.5, PM10, nitrogen dioxide, ozone, etc) at different monitoring stations.
- The widely-used National Air Quality Index (NAQI) given by the Central Pollution Control Board is a 24-hour average.
- Its unit is micrograms per cubic meter.
- A particular amount of one pollutant may not be as harmful as the same amount of another pollutant.
- So, each pollutant’s quantity in the air is adjusted to a common scale (say, 0 to 500) that works for all pollutants.
- Finally, the pollutant with the worst sub-index determines the AQI for that time and location.
What are NAAQ standards?
- The mandate provided to the Central Pollution Control Board (CPCB) under the Air (Prevention and Control of Pollution) Act empowers it to set standards for the quality of air.
- Hence the current National Ambient Air Quality Standards were notified in November 2009 by the CPCB.
- Prior to this, India had set Air Quality standards in 1994, and this was later revised in 1998.
- The 2009 standards further lowered the maximum permissible limits for pollutants and made the standards uniform across the nation.
- Earlier, less stringent standards were prescribed for industrial zones as compared to residential areas.
Pollutants covered:
- Sulphur Dioxide (SO2)
- Nitrogen Dioxide (NO2),
- Particulate Matter (size less than 10 µm) or PM 10
- Particulate Matter (size less than 2.5 µm) or PM2.5
- Ozone (O3)
- Carbon Monoxide (CO)
- Ammonia (NH3)
(Air Pollutants that most of us NEVER heard of)
- Lead
- Benzene (C6H6)
- Benzo(a)Pyrene (BaP)
- Arsenic(As)
- Nickel (Ni)
What are Initiatives taken by India for Controlling Air Pollution?
- System of Air Quality and Weather Forecasting and Research (SAFAR) Portal
- Air Quality Index: AQI has been developed for eight pollutants viz. PM2.5, PM10, Ammonia, Lead, nitrogen oxides, sulphur dioxide, ozone, and carbon monoxide.
- Graded Response Action Plan
- For Reducing Vehicular Pollution: BS-VI Vehicles, Push for Electric Vehicles (EVs),Odd-Even Policy as an emergency measure
- New Commission for Air Quality Management
- Subsidy to farmers for buying Turbo Happy Seeder (THS) Machine
UPSC 2023 countdown has begun! Get your personal guidance plan now! (Click here)
Get an IAS/IPS ranker as your 1: 1 personal mentor for UPSC 2024
Air Pollution
CBG: Renewable energy revolution
From UPSC perspective, the following things are important :
Prelims level: CBG
Mains level: Stubble burning, air pollution and solutions, CBG

Context
- The beginnings of a renewable energy revolution rooted in agriculture are taking shape in India with the first bio-energy plant of a private company in Sangrur district of Punjab having commenced commercial operations on October 18. It will produce Compressed Biogas (CBG) from paddy straw, thus converting agricultural waste into wealth.
Background
- Stubble burning every year in north and northwest: It has become common practice among farmers in Punjab, Haryana and western Uttar Pradesh to dispose of paddy stubble and the biomass by setting it on fire to prepare fields for the next crop, which has to be sown in a window of three to four weeks. This is spread over millions of hectares.
- Resultant smog polluting environment: The resultant clouds of smoke engulf the entire National Capital Territory of Delhi and neighbouring States for several weeks between October to December. This plays havoc with the environment and affects human and livestock health.
- Stubble burning practice spreading rapidly across the country: Though paddy stubble burning in northwest India has received a lot of attention because of its severity of pollution, the reality is that crop residue burning is spreading even to rabi crops and the rest of the country. Unless these practices are stopped, the problem will assume catastrophic proportions.
What is Stubble Burning?
- Stubble (parali) burning is a method of removing paddy crop residues from the field to sow wheat from the last week of September to November.
- It is usually required in areas that use the combined harvesting method which leaves crop residue behind.
- This practice mostly carried out in Punjab, Haryana and UP contributes solely to the grave winter pollution in the national capital.

How stubble burning impacts environment and Human health?
- Deteriorates air quality: The process of burning farm residue is one of the major causes of air pollution in parts of north India, deteriorating the air quality.
- Source of various harmful gases: Stubble burning is a significant source of carbon dioxide (CO2), volatile organic compounds (VOCs), nitrogen oxides (NOx) and hydrocarbons (HC).
- Air Pollution: Stubble burning emits toxic pollutants in the atmosphere containing harmful gases like Carbon Monoxide (CO), methane (CH4), carcinogenic polycyclic aromatic hydrocarbons, volatile organic compounds (VOC). These pollutants disperse in the surroundings and eventually affect air quality and people’s health by forming a thick blanket of smog. Along with vehicular emissions, it affects the Air Quality Index (AQI) in the national capital and NCR.
- Soil degradation: Soil becomes less fertile and its nutrients are destroyed when the husk is burned on the ground. Organic content of soil is completely destroyed. Stubble burning generates heat that penetrates into the soil, causing an increase in erosion, loss of useful microbes and moisture.

Some of the measures taken by Government for the effective prevention and control of stubble burning
- The Commission for Air Quality Management: The Commission for Air Quality Management in National Capital Region and Adjoining Areas (CAQM) had developed a framework and action plan for the effective prevention and control of stubble burning,
- In-situ management: The framework/action plan includes in-situ management, i.e., incorporation of paddy straw and stubble in the soil using heavily subsidized machinery (supported by crop residue management (CRM) Scheme of the Ministry of Agriculture and Farmers Welfare).
- Ex-situ management: Ex-situ CRM efforts include the use of paddy straw for biomass power projects and co-firing in thermal power plants, and as feedstock for 2G ethanol plants, feed stock in CBG plants, fuel in industrial boilers, waste-to-energy (WTE) plants, and in packaging materials, etc.
- Awareness generation programme: Additionally, measures are in place to ban stubble burning, to monitor and enforce this, and initiating awareness generation.
- Project by NITI Aayog along with FAO: NITI Aayog approached FAO India in 2019 to explore converting paddy straw and stubble into energy and identify possible ex-situ uses of rice straw to complement the in-situ programme.
- Rice straw for producing CBG: A techno-economic assessment of energy technologies suggested that rice straw can be cost-effective for producing CBG and pellets. Pellets can be used in thermal power plants as a substitute of coal and CBG as a transport fuel.
- SATAT initiative: With 30% of the rice straw produced in Punjab, a 5% CBG production target set by the Government of India scheme, “Sustainable Alternative Towards Affordable Transportation (SATAT)” can be met. It could also increase local entrepreneurship, increase farmers’ income and reduce open burning of rice straw.
- Encouraging private players to produce CBG more and reduce CO2 emissions: Verbio India Private Limited, a 100% subsidiary of the German Verbio AG, got approval from the Punjab government in April 2018 to set up a bio-CNG project that will utilise about 2.1 lakh tonnes of a total of 18.32 million tonnes of paddy straw annually. The plant will use one lakh tonnes of paddy straw produced from approximately 16,000 hectares of paddy fields. Paddy residue will be collected from this year to produce 33 tons of CBG and 600-650 tonnes of fermented organic manure/slurry per day this will reduce up to 1.5 lakh tonnes of CO2 emissions per year.
FAO Study on developing crop residue supply chain
- Use of Rice straw: In technical consultations with the public and private sectors, the FAO published its study on developing a crop residue supply chain in Punjab that can allow the collection, storage and final use of rice straw for other productive services, specifically for the production of renewable energy.
- Required Investment and benefits farmers: The results suggest that to mobilise 30% of the rice straw produced in Punjab, an investment of around ₹2,201 crore ($309 million) would be needed to collect, transport and store it within a 20-day period. This would reduce greenhouse gas (GHG) emissions by about 9.7 million tonnes of CO2 equivalent and around 66,000 tonnes of PM2.5. Further, depending on market conditions, farmers can expect to earn between ₹550 and ₹1,500 per ton of rice straw sold, depending on market conditions.

Interesting to read: Compressed Bio Gas (CBG)
- Biogas is produced naturally through a process of anaerobic decomposition from waste / bio-mass sources like agriculture residue, cattle dung, sugarcane press mud, municipal solid waste, sewage treatment plant waste, etc.
- After purification, it is compressed and called CBG, which has a pure methane content of over 95%.
- CBG is exactly similar to the commercially available natural gas in its composition and energy potential.
- With calorific value (~52,000 KJ/kg) and other properties similar to CNG, CBG can be used as an alternative, renewable automotive fuel.
- Given the abundance of biomass in the country, CBG has the potential to replace CNG in automotive, industrial and commercial uses in the coming years.
Conclusion
- Encouraging private players for producing CBG appears to be a first win-win initiative in the form of environmental benefits, renewable energy, value addition to the economy, farmers’ income and sustainability. This initiative is replicable and scalable across the country and can be a game changer for the rural economy.
Mains Question
Q. What is Stubble burning? Discuss the measures taken by Government for the effective prevention and control of stubble burning and producing CBG could be a win-win situation.
UPSC 2023 countdown has begun! Get your personal guidance plan now! (Click here)
Get an IAS/IPS ranker as your 1: 1 personal mentor for UPSC 2024
Air Pollution
GRAP Stage II kicks in as Delhi’s air quality may turn ‘very poor’
From UPSC perspective, the following things are important :
Prelims level: Graded Response Action Plan- GRAP
Mains level: Delhi Air Pollution issue
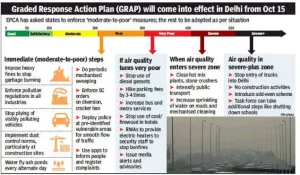
The Commission for Air Quality Management directed New Delhi authorities to enforce stage II of the Graded Response Action Plan (GRAP) with immediate effect.
Graded Response Action Plan (GRAP)
- In 2014, when a study by the WHO found that Delhi was the most polluted city in the world, panic spread in the Centre and the state government.
- Approved by the Supreme Court in 2016, the plan was formulated after several meetings that the Environment Pollution (Prevention and Control) Authority (EPCA) held with state government and experts.
- The result was a plan that institutionalized measures to be taken when air quality deteriorates.
- GRAP also works as an emergency measure.
- It includes strict measures such as a ban on the entry of heavy vehicles, the odd-even road rationing restrictions, and a halt of construction work – each of which is likely to be impractical at a time when the pandemic has exacted heavy economic costs and public transport has been seen as an infection risk.
How does it work?
- As such, the plan does not include action by various state governments to be taken throughout the year to tackle industrial, vehicular and combustion emissions.
- When the air quality shifts from poor to very poor, the measures listed under both sections have to be followed since the plan is incremental in nature.
- If air quality reaches the severe+ stage, GRAP talks about shutting down schools and implementing the odd-even road-space rationing scheme.
Measures taken under GRAP
1) Severe+ or Emergency
(PM 2.5 over 300 µg/cubic metre or PM10 over 500 µg/cu. m. for 48+ hours)
- Stop entry of trucks into Delhi (except essential commodities)
- Stop construction work
- Introduce odd/even scheme for private vehicles and minimise exemptions
- Task Force to decide any additional steps including shutting of schools
2) Severe
(PM 2.5 over 250 µg/cu. m. or PM10 over 430 µg/cu. m.)
- Close brick kilns, hot mix plants, stone crushers
- Maximise power generation from natural gas to reduce generation from coal
- Encourage public transport, with differential rates
- More frequent mechanized cleaning of road and sprinkling of water
3) Very Poor
(PM2.5 over 121-250 µg/cu. m. or PM10 over 351-430 µg/cu. m.)
- Stop use of diesel generator sets
- Enhance parking fee by 3-4 times
- Increase bus and Metro services
- Apartment owners to discourage burning fires in winter by providing electric heaters during winter
- Advisories to people with respiratory and cardiac conditions to restrict outdoor movement
4) Moderate to poor
(PM2.5 over 61-120 µg/cu. m. or PM10 over 101-350 µg/cu. m.)
- Heavy fines for garbage burning
- Close/enforce pollution control regulations in brick kilns and industries
- Mechanized sweeping on roads with heavy traffic and water sprinkling
- Strictly enforce a ban on firecrackers
UPSC 2023 countdown has begun! Get your personal guidance plan now! (Click here)
Get an IAS/IPS ranker as your 1: 1 personal mentor for UPSC 2024
Air Pollution
What are Green Crackers?
From UPSC perspective, the following things are important :
Prelims level: Green crackers
Mains level: Not Much

Many states have outlawed firecrackers and mandated the production, sale, and usage of only green firecrackers in light of Diwali’s impending arrival and the air pollution crisis.
What are green crackers?
- Green Crackers are fireworks that are healthy to the environment and can lessen the air pollution that conventional firecrackers produce.
- The Council for Scientific and Industrial Research (CSIR) created these.
- These green crackers, designed by the National Environmental and Engineering Research Institute (NEERI), a CSIR lab, contain flower pots, pencils, fireworks, maroons, bombs, and chakkar.
How are they made?
- Green crackers, also known as eco-friendly crackers, are made from alternative raw materials to have a smaller negative impact on the environment and to pose fewer health hazards.
- It has been stated that green crackers are environmentally friendly because they don’t contain aluminum, barium, potassium nitrate, or carbon.
Are they totally pollution free?
- Green crackers are 30% less polluting than regular ones.
- Green crackers have less or no barium, and that the chemical barium nitrate is what causes the smoke and emissions.
- In addition to lowering air pollution, green crackers are said to have a lower sound level than the ordinary crackers—between 110 and 125 decibels as opposed to roughly 160 decibels for conventional crackers.
- Despite all of their benefits, these environmentally friendly firecrackers are more expensive than standard ones.
Types of green crackers
(1) SWAS – Safe Water Releaser
- They will discharge water vapour into the atmosphere, which will dampen the discharged dust.
- It won’t contain sulphur or potassium nitrate.
- There will be a release of a diluent for gaseous emissions.
- There will be a 30% reduction in the amount of particle dust emitted.
(2) STAR – Safe Thermite Cracker
- Does not contain sulphur and potassium nitrate
- Discharge of less particulate matter
- Lowered noise level
(3) SAFAL – Safe Minimal Aluminum
- Does not contain sulphur and potassium nitrate
- Discharge of less particulate matter
- Lowered noise level as compared to traditional ones
Judicial observation over fire-crackers
- It is made clear that there is no total ban on the use of firecrackers.
- Only those firecrackers are banned (joined, chemical) which are found to be injurious to health and affect the health of the citizens particularly the senior citizens and the children.
What are the traders’ concerns?
- Traders have expressed concerns about the crackers’ shelf life due to the new green cracker composition.
- Manufacturers also need to overcome the rigorous certification process run by the Petroleum and Explosives Safety Organisation (PESO).
UPSC 2023 countdown has begun! Get your personal guidance plan now! (Click here)
Get an IAS/IPS ranker as your 1: 1 personal mentor for UPSC 2024
Air Pollution
Centre to set up Paddy Straw Pellet Units to arrest Stubble Burning
From UPSC perspective, the following things are important :
Prelims level: GHGs relased by Stubble Burning
Mains level: Delhi Air Pollution issue

To prevent stubble burning, the Union Environment Ministry announced a ₹50 crore scheme on to incentivise industrialists and entrepreneurs to set up paddy straw pelletization and torrefaction plants.
What is Stubble Burning?
- Stubble (parali) burning is a method of removing paddy crop residues from the field to sow wheat from the last week of September to November.
- It is usually required in areas that use the combined harvesting method which leaves crop residue behind.
- This practice mostly carried out in Punjab, Haryana and UP contributes solely to the grave winter pollution in the national capital.
Emissions from stubble burning
- The process of burning farm residue is one of the major causes of air pollution in parts of north India, deteriorating the air quality.
- Stubble burning is a significant source of carbon dioxide (CO2), volatile organic compounds (VOCs), nitrogen oxides (NOx) and hydrocarbons (HC).
Despite emissions, why do farmers burn stubble?
- Crop residue burning is practised by the farmers to prepare the land for the next cultivation.
- The major reason behind the stubble burning is the short time available between rice harvesting and sowing of wheat as delay in sowing wheat affects the wheat crop.
- Between the harvesting of the paddy crop and the sowing of the next crop, there is only a two to three weeks’ time window is left.
- Even though farmers are aware that the burning of straw is harmful to health, they do not have alternatives for utilizing them effectively.
- The farmers are ill-equipped to deal with waste because they cannot afford the new technology that is available to handle the waste material.
- Therefore, stubble burning is considered one of the cheapest methods to clean the field after the harvesting season.
Impact of stubble burning
- Air Pollution: Stubble burning emits toxic pollutants in the atmosphere containing harmful gases like Carbon Monoxide (CO), methane (CH4), carcinogenic polycyclic aromatic hydrocarbons, volatile organic compounds (VOC). These pollutants disperse in the surroundings and eventually affect air quality and people’s health by forming a thick blanket of smog. Along with vehicular emissions, it affects the Air Quality Index (AQI) in the national capital and NCR.
- Soil degradation: Soil becomes less fertile and its nutrients are destroyed when the husk is burned on the ground. Organic content of soil is completely destroyed. Stubble burning generates heat that penetrates into the soil, causing an increase in erosion, loss of useful microbes and moisture.
Alternative solutions
- Power generation: The available paddy straw can be effectively used for power generation, which will go a long way towards overcoming the problem of disposal of crop residues and power deficit in the region.
- In-situ decomposition: Suitable machinery for collection, chopping and in situ incorporation of straw is required. We can use Pusa Biodecomposer, Biomethanation etc.
- Organic manuring: Convert the removed residues into enriched organic manure through composting.
Conclusion
- Unless financial assistance is to be provided by the Centre for boosting farm mechanization, it is difficult to completely stop stubble burning.
- States need to make alternative arrangements for the consumption of paddy straw into the soil as per the directions of the NGT.
UPSC 2023 countdown has begun! Get your personal guidance plan now! (Click here)
Get an IAS/IPS ranker as your 1: 1 personal mentor for UPSC 2024
Air Pollution
Stubble burning in Punjab at 3-year low
From UPSC perspective, the following things are important :
Prelims level: GHGs relased by Stubble Burning
Mains level: Stubble Burning

Though early days, the number of crop fires reported out of Punjab are at a three-year low, suggest data from the Indian Agricultural Research Institute (IARI) that tracks such fires via satellite.
What is Stubble Burning?
- Stubble (parali) burning is a method of removing paddy crop residues from the field to sow wheat from the last week of September to November.
- It is usually required in areas that use the combined harvesting method which leaves crop residue behind.
- This practice mostly carried out in Punjab, Haryana and UP contributes solely to the grave winter pollution in the national capital.
Emissions from stubble burning
- The process of burning farm residue is one of the major causes of air pollution in parts of north India, deteriorating the air quality.
- Stubble burning is a significant source of carbon dioxide (CO2), volatile organic compounds (VOCs), nitrogen oxides (NOx) and hydrocarbons (HC).
Despite emissions, why do farmers burn stubble?
- Crop residue burning is practised by the farmers to prepare the land for the next cultivation.
- The major reason behind the stubble burning is the short time available between rice harvesting and sowing of wheat as delay in sowing wheat affects the wheat crop.
- Between the harvesting of the paddy crop and the sowing of the next crop, there is only a two to three weeks’ time window is left.
- Even though farmers are aware that the burning of straw is harmful to health, they do not have alternatives for utilizing them effectively.
- The farmers are ill-equipped to deal with waste because they cannot afford the new technology that is available to handle the waste material.
- Therefore, stubble burning is considered one of the cheapest methods to clean the field after the harvesting season.
Impact of stubble burning
- Air Pollution: Stubble burning emits toxic pollutants in the atmosphere containing harmful gases like Carbon Monoxide (CO), methane (CH4), carcinogenic polycyclic aromatic hydrocarbons, volatile organic compounds (VOC). These pollutants disperse in the surroundings and eventually affect air quality and people’s health by forming a thick blanket of smog. Along with vehicular emissions, it affects the Air Quality Index (AQI) in the national capital and NCR.
- Soil degradation: Soil becomes less fertile and its nutrients are destroyed when the husk is burned on the ground. Organic content of soil is completely destroyed. Stubble burning generates heat that penetrates into the soil, causing an increase in erosion, loss of useful microbes and moisture.
Alternative solutions
- Power generation: The available paddy straw can be effectively used for power generation, which will go a long way towards overcoming the problem of disposal of crop residues and power deficit in the region.
- In-situ decomposition: Suitable machinery for collection, chopping and in situ incorporation of straw is required. We can use Pusa Biodecomposer, Biomethanation etc.
- Organic manuring: Convert the removed residues into enriched organic manure through composting.
Conclusion
- Unless financial assistance is to be provided by the Centre for boosting farm mechanization, it is difficult to completely stop stubble burning.
- States need to make alternative arrangements for the consumption of paddy straw into the soil as per the directions of the NGT.
UPSC 2023 countdown has begun! Get your personal guidance plan now! (Click here)
Get an IAS/IPS ranker as your 1: 1 personal mentor for UPSC 2024
Air Pollution
PUC Certificate must to buy fuel in New Delhi
From UPSC perspective, the following things are important :
Prelims level: PUC Certification
Mains level: Delhi Air Pollution issue
Motorists will not be able to buy fuel in Delhi without a valid Pollution Under Control (PUC) certificate from October 25.
What is PUC Certificate?
- The PUC certificate is a document that any person driving a motor vehicle can be asked to produce by a police officer in uniform authorized by the state government.
- These issue certificates if a vehicle is found complying with the prescribed emission norms.
- Since the Motor Vehicles (Amendment) Act, 2019 came into force, PUC certificate has been made mandatory.
- A PUC certificate contains information such as the vehicle’s license plate number, PUC test reading, date on which the PUC test was conducted and the expiry date.
Compliance rules
- According to Central Motor Vehicles Rules, 1989, every motor vehicle is required to carry a valid PUC Certificate after the expiry of period of one year from the date of its first registration.
- This includes those conforming to BS-I/ BS-II/ BS-III/BS-IV /BS-VI as well as vehicles plying on CNG/LPG.
- However, the validity of four-wheeled BS-IV compliant vehicles is one year and for other vehicles it is three months.
How is a pollution control check carried out?
- The computerized model for pollution check was developed by the Society of Indian Automobile manufacturers.
- A gas analyzer is connected to a computer, to which a camera and a printer are attached.
- The gas analyzer records the emission value and sends it to the computer directly, while the camera captures the license plate of the vehicle.
- Subsequently, a certificate may be issued if the emission values are within the limits.
Why obtain PUC Certificate?
- Emissions from automobiles are major contributors to air pollution all over the world.
- The smoke emitted from vehicles contains the following pollutants:
- Hydrocarbons (HC)
- Carbon Monoxide (CO)
- Oxides of Nitrogen (NOx)
- Particulate Matter (PM)
- Sulphur Dioxide (SO2)
- Carbon Dioxide (CO2)
- Nitrous Oxide (N2O)
UPSC 2023 countdown has begun! Get your personal guidance plan now! (Click here)
Get an IAS/IPS ranker as your 1: 1 personal mentor for UPSC 2024
Air Pollution
What is Graded Response Action Plan (GRAP)?
From UPSC perspective, the following things are important :
Prelims level: Graded Response Action Plan- GRAP
Mains level: Delhi Air Pollution issue
The Delhi CM has announced a 15-point Winter Action Plan to be implemented along with the Graded Response Action Plan (GRAP).
Graded Response Action Plan- GRAP
- GRAP is a set of measures to be taken to reduce Air Pollution depending on the current level of pollution.
- It was notified by the Union Environment Ministry in 2017 to fight air pollution, based on the SC directions.
- In 2014, when a study by the WHO found that Delhi was the most polluted city in the world, panic spread in the Centre and the state government.
- Approved by the Supreme Court in 2016, the plan was formulated after several meetings that the Environment Pollution (Prevention and Control) Authority (EPCA) held with state government and experts.
- The result was a plan that institutionalized measures to be taken when air quality deteriorates.
- GRAP works only as an emergency measure.
How does it work?
- As such, the plan does not include action by various state governments to be taken throughout the year to tackle industrial, vehicular and combustion emissions.
- When the air quality shifts from poor to very poor, the measures listed under both sections have to be followed since the plan is incremental in nature.
- If air quality reaches the severe+ stage, GRAP talks about shutting down schools and implementing the odd-even road-space rationing scheme.
Measures taken under GRAP
1) Severe+ or Emergency
(PM 2.5 over 300 µg/cubic metre or PM10 over 500 µg/cu. m. for 48+ hours)
- Stop entry of trucks into Delhi (except essential commodities)
- Stop construction work
- Introduce odd/even scheme for private vehicles and minimise exemptions
- Task Force to decide any additional steps including shutting of schools
2) Severe
(PM 2.5 over 250 µg/cu. m. or PM10 over 430 µg/cu. m.)
- Close brick kilns, hot mix plants, stone crushers
- Maximise power generation from natural gas to reduce generation from coal
- Encourage public transport, with differential rates
- More frequent mechanized cleaning of road and sprinkling of water
3) Very Poor
(PM2.5 121-250 µg/cu. m. or PM10 351-430 µg/cu. m.)
- Stop use of diesel generator sets
- Enhance parking fee by 3-4 times
- Increase bus and Metro services
- Apartment owners to discourage burning fires in winter by providing electric heaters during winter
- Advisories to people with respiratory and cardiac conditions to restrict outdoor movement
4) Moderate to poor
(PM2.5 61-120 µg/cu. m. or PM10 101-350 µg/cu. m.)
- Heavy fines for garbage burning
- Close/enforce pollution control regulations in brick kilns and industries
- Mechanized sweeping on roads with heavy traffic and water sprinkling
- Strictly enforce a ban on firecrackers
Has GRAP helped?
- The biggest success of GRAP has been in fixing accountability and deadlines.
- For each action to be taken under a particular air quality category, executing agencies are clearly marked.
- In a territory like Delhi, where a multiplicity of authorities has been a long-standing impediment to effective governance, this step made a crucial difference.
UPSC 2023 countdown has begun! Get your personal guidance plan now! (Click here)
Get an IAS/IPS ranker as your 1: 1 personal mentor for UPSC 2024
Air Pollution
Recovery of Ozone Layer achieves significant milestone
From UPSC perspective, the following things are important :
Prelims level: Ozone, Ozone Hole
Mains level: Ozone recovery

The concentration of ozone-depleting substances in the atmosphere has reduced to reach a significant milestone this year.
What is Ozone and Ozone Layer?

- An ozone molecule consists of three oxygen atoms instead of the usual two (the oxygen we breathe, O2, makes up 21% of the atmosphere).
- It only exists in the atmosphere in trace quantities (less than 0.001%), but its effects are very important.
- Ozone molecules are created by the interaction of ultra-violet (UV) radiation from the Sun with O2 molecules.
- Because UV radiation is more intense at higher altitudes where the air is thinner, it is in the stratosphere where most of the ozone is produced, giving rise to what is called the ‘ozone layer’.
- The ozone layer, containing over 90% of all atmospheric ozone, extends between about 10 and 40km altitude, peaking at about 25km in Stratosphere.
Why need Ozone Layer?
- The ozone layer is very important for life on Earth because it has the property of absorbing the most damaging form of UV radiation, UV-B radiation which has a wavelength of between 280 and 315 nanometres.
- As UV radiation is absorbed by ozone in the stratosphere, it heats up the surrounding air to produce the stratospheric temperature inversion.
What is Ozone Hole?
- Each year for the past few decades during the Southern Hemisphere spring, chemical reactions involving chlorine and bromine cause ozone in the southern polar region to be destroyed rapidly and severely.
- The Dobson Unit (DU) is the unit of measure for total ozone.
- The chemicals involved ozone depletion are chlorofluorocarbons (CFCs for short), halons, and carbon tetrachloride.
- They are used for a wide range of applications, including refrigeration, air conditioning, foam packaging, and making aerosol spray cans.
- The ozone-depleted region is known as the “ozone hole”.
Tropical Ozone Hole
- According to the study, the ozone hole is located at altitudes of 10-25 km over the tropics.
- This hole is about seven times larger than Antarctica, the study suggested.
- It also appears across all seasons, unlike that of Antarctica, which is visible only in the spring.
- The hole has become significant since the 1980s. But it was not discovered until this study.
What caused an ozone hole in the tropics?
- Studies suggested another mechanism of ozone depletion: Cosmic rays.
- Chlorofluorocarbon’s (CFC) role in depleting the ozone layer is well-documented.
- The tropical stratosphere recorded a low temperature of 190-200 Kelvin (K).
- This can explain why the tropical ozone hole is constantly formed over the seasons.
Significance of the finding
- The tropical ozone hole, which makes up 50 percent of Earth’s surface, could cause a global concern due to the risks associated with it.
- It is likely to cause skin cancer, cataracts and other negative effects on the health and ecosystems in tropical regions.
Try this PYQ
Q.Consider the following statements:
Chlorofluorocarbons, known as ozone-depleting substances are used:
- In the production of plastic foams
- In the production of tubeless tyres
- In cleaning certain electronic components
- As pressurizing agents in aerosol cans
Which of the statements given above is/are correct?
(a) 1, 2 and 3 only
(b) 4 only
(c) 1, 3 and 4 only
(d) 1, 2, 3 and 4
Post your answers here
UPSC 2023 countdown has begun! Get your personal guidance plan now! (Click here)
Get an IAS/IPS ranker as your 1: 1 personal mentor for UPSC 2024
Air Pollution
Inter-State collaboration to deal with air pollution
From UPSC perspective, the following things are important :
Prelims level: Zonal Councils
Mains level: Paper 3- Inter-State collaboration for dealing with pollution crisis
Context
With the Aam Aadmi Party (AAP) governing both Delhi and Punjab, collaboration for clean air should be the mantra for both State governments.
Impact of air pollution on Delhi and Punjab
- Punjab is home to nine of the 132 most polluted cities in the country identified by the Central Pollution Control Board.
- In 2019, Delhi and Punjab together faced economic losses estimated to be approximately ₹18,000 crore due to worsening air pollution.
- Therefore, by collaborating for clean air, both States can ensure improvements in citizen well-being and labour productivity.
How can the two States collaborate?
1] Arrive at a common understanding of sources
- Those in charge of the two States must talk.
- Setting aside their disagreements on the contribution of stubble burning to Delhi’s air pollution, the States should arrive at a common understanding of sources polluting the region.
2] Create platforms for knowledge exchange
- Cross-learning on possible solutions: A common knowledge centre should be set up to facilitate cross-learning on possible solutions to developmental challenges in both States.
- Such a centre would especially benefit Punjab given the host of measures that the Delhi government has already taken to improve air quality in Delhi.
- Information on air quality levels and source assessment studies are critical in developing long-term strategies for pollution mitigation.
3] Collaborate to execute proven solutions
- Co-design solutions: The two States could co-design solutions that would improve air quality.
- Institutionalise a task force: They could jointly institutionalise a task force comprising experts from State-run institutions to pilot these solutions and assess their impact.
- This would ensure wider acceptance of the proposed solution, which has not been the case in the past.
- For instance, the PUSA bio-decomposer (developed by the Indian Agricultural Research Institute), has received mixed reviews from farmers.
- The decomposer only makes sense for early maturing varieties of paddy, as even with the decomposer, stubble would take between 25 to 30 days to decompose.
- Therefore, it is of little use in high burn districts such as Sangrur, Punjab, where late-maturing paddy varieties are dominant.
4] Create a market for diversified crop products
- Moving away from paddy-wheat cycle: Shifting away from the ‘paddy-wheat cycle’ through crop diversification is a sure shot solution to stubble burning.
- But, the lack of an assured market for agricultural products, other than wheat and paddy, has acted as a deterrent.
- For years now, the Delhi government has toyed with the idea of introducing ‘Aam Aadmi kitchens’ in Delhi.
- These community kitchens could potentially incorporate crops other than wheat and paddy in meals offered.
5] Extending inter-State cooperation to other States in Indo-Gangetic plains
- Both State governments should assert the need for extending inter-State cooperation to other States in the Indo-Gangetic plains in different inter-State forums.
- One such forum is the Northern Zonal Council which has representation from Chandigarh, Delhi, Punjab, Haryana, Rajasthan, Himachal Pradesh, Jammu and Kashmir and Ladakh.
- Both Delhi and Punjab must use this platform to highlight the need for coordination with neighbouring States to alleviate the pollution crisis.
Conclusion
With a collaborative plan of action, we can be optimistic about cleaner air in the years to come.
UPSC 2022 countdown has begun! Get your personal guidance plan now! (Click here)
Get an IAS/IPS ranker as your 1: 1 personal mentor for UPSC 2024
Air Pollution
13% reduction in air pollution deaths due to UJJAWALA Scheme
From UPSC perspective, the following things are important :
Prelims level: PM UJJWALA Scheme
Mains level: Outcomes of the Scheme
Greater penetration and usage of LPG as a cooking fuel is estimated to have prevented at least 1.5 lakh pollution-related premature deaths in the year 2019 alone, according to the first independent impact assessment of the government’s flagship Ujjwala program.
About the PM Ujjwala Yojana
- Pradhan Mantri Ujjwala Yojana (PMUY) was launched in 2016, with the aim to provide Liquefied petroleum gas (LPG) connections to five crore women members of below poverty line (BPL) households in the first phase.
- he scheme was expanded in April 2018 to include women beneficiaries from seven more categories (SC/ST, PMAY, AAY, Most backward classes, tea garden, forest dwellers, Islands).
- In the second phase the target was expanded to eight crore LPG connections.
Why was this scheme launched?
- Indoor air pollution is also responsible for a significant number of acute respiratory illnesses in young children.
- Providing LPG connections to BPL households will ensure universal coverage of cooking gas in the country.
- This measure has empowered women and protected their health. It reduced drudgery and the time spent on cooking.
- It will also provide employment for rural youth in the supply chain of cooking gas.
Ujjwala 2.0
- Under Ujjwala 2.0 migrant workers would no longer have to struggle to get address proof documents to get the gas connections.
- Now migrant workers would only be required to submit a self-declaration of their residential address to get the gas connection.
- Along with a deposit-free LPG connection, Ujjwala 2.0 will provide the first refill and a hotplate free of cost to the beneficiaries.
Significance of Ujjwala 2.0
- LPG infrastructure has expanded manifold in the country due to the Ujjwala scheme.
- In the last six years, more than 11,000 new LPG distribution centres have opened across the country.
- The LPG coverage in India is now very close to becoming 100 per cent.
UPSC 2022 countdown has begun! Get your personal guidance plan now! (Click here)
Get an IAS/IPS ranker as your 1: 1 personal mentor for UPSC 2024
Air Pollution
What is Pollution-Under-Control (PUC) Certificate?
From UPSC perspective, the following things are important :
Prelims level: PUC Certificate
Mains level: Not Much
Delhi govt will soon make PUC certificate mandatory for fuel at filling stations.
What is PUC Certificate?
- The PUC certificate is a document that any person driving a motor vehicle can be asked to produce by a police officer in uniform authorized by the state government.
- These issue certificates if a vehicle is found complying with the prescribed emission norms.
- Since the Motor Vehicles (Amendment) Act, 2019 came into force, PUC certificate has been made mandatory.
- A PUC certificate contains information such as the vehicle’s license plate number, PUC test reading, date on which the PUC test was conducted and the expiry date.
How is a pollution control check carried out?
- The computerized model for pollution check was developed by the Society of Indian Automobile manufacturers.
- A gas analyzer is connected to a computer, to which a camera and a printer are attached.
- The gas analyzer records the emission value and sends it to the computer directly, while the camera captures the license plate of the vehicle.
- Subsequently, a certificate may be issued if the emission values are within the limits.
Fines for non-compliance
- The test costs between Rs 60 and Rs 100.
- The validity of the test is one year for BS IV vehicles and three months for others.
- The fine for PUC violations has now gone up to Rs 10,000; it used to be Rs 1,000 for the first offence and Rs 2,000 for subsequent violations before the amendments came into force.
UPSC 2022 countdown has begun! Get your personal guidance plan now! (Click here)
Get an IAS/IPS ranker as your 1: 1 personal mentor for UPSC 2024
Air Pollution
What are Smog Towers?
From UPSC perspective, the following things are important :
Prelims level: Smog Tower
Mains level: Effectiveness of smog towers

Some researchers in New Delhi have observed paradoxical phenomena near the smog towers. The air closest to the tower should be cleanest, but the device recorded the opposite in several instances.
What are Smog Towers?
- Smog towers are structures designed to work as large-scale air purifiers. They are fitted with multiple layers of air filters and fans at the base to suck the air.
- After the polluted air enters the smog tower, it is purified by multiple layers before being re-circulated into the atmosphere.
Structure of the Delhi smog tower

- The structure is 24 m high, about as much as an 8-storey building — an 18-metre concrete tower, topped by a 6-metre-high canopy. At its base are 40 fans, 10 on each side.
- Each fan can discharge 25 cubic metres per second of air, adding up to 1,000 cubic metres per second for the tower as a whole. Inside the tower in two layers are 5,000 filters.
- The filters and fans have been imported from the United States.
How does it work?
- The tower uses a ‘downdraft air cleaning system’ developed by the University of Minnesota.
- Polluted air is sucked in at a height of 24 m, and filtered air is released at the bottom of the tower, at a height of about 10 m from the ground.
- When the fans at the bottom of the tower operate, the negative pressure created sucks in air from the top.
- The ‘macro’ layer in the filter traps particles of 10 microns and larger, while the ‘micro’ layer filters smaller particles of around 0.3 microns.
- The downdraft method is different from the system used in China, where a tower uses an ‘updraft’ system — air is sucked in from near the ground, and is propelled upwards by heating and convection.
- Filtered air is released at the top of the tower.
Likely impact
- Computational fluid dynamics modelling suggests the tower could have an impact on the air quality up to 1 km from the tower.
- The actual impact will also determine how the tower functions under different weather conditions, and how levels of PM2.5 vary with the flow of air.
Issues with smog towers
- Many experts say that the smog towers are not a viable method to clean city’s air.
- The government had talked about 80% pollution reduction at inlet and outlet of the tower but never mentioned about the effect of distance from the tower.
- Instead of spending ₹40 crore on two towers, the government could have spent the funds on several other options such as replacing the small and polluting industrial boilers or chimneys etc.
UPSC 2022 countdown has begun! Get your personal guidance plan now! (Click here)
Get an IAS/IPS ranker as your 1: 1 personal mentor for UPSC 2024
Air Pollution
National Ambient Air Quality Standards (NAAQS)
From UPSC perspective, the following things are important :
Prelims level: Various air pollutants
Mains level: NAAQ standards
Delhi and most of the other non-attainment cities under the National Clean Air Programme (NCAP) have shown only a marginal improvement, said a new analysis released.
About NCAP
- The NCAP was implemented across India in 2019 to reduce particulate matter levels in 132 cities by 20-30% in 2024.
- Cities are declared non-attainment if they consistently fail to meet the National Ambient Air Quality Standards (NAAQS) over a five-year period.
What are NAAQ standards?
- The mandate provided to the Central Pollution Control Board (CPCB) under the Air (Prevention and Control of Pollution) Act empowers it to set standards for the quality of air.
- Hence the current National Ambient Air Quality Standards were notified in November 2009 by the CPCB.
- Prior to this, India had set Air Quality standards in 1994, and this was later revised in 1998.
- The 2009 standards further lowered the maximum permissible limits for pollutants and made the standards uniform across the nation.
- Earlier, less stringent standards were prescribed for industrial zones as compared to residential areas.
Pollutants covered:
- Sulphur Dioxide (SO2)
- Nitrogen Dioxide (NO2),
- Particulate Matter (size less than 10 µm) or PM 10
- Particulate Matter (size less than 2.5 µm) or PM2.5
- Ozone (O3)
- Carbon Monoxide (CO)
- Ammonia (NH3)
(Air Pollutants that most of us NEVER heard of:)
- Lead
- Benzene (C6H6)
- Benzo(a)Pyrene (BaP)
- Arsenic(As)
- Nickel (Ni)
Source: Arthpaedia
UPSC 2022 countdown has begun! Get your personal guidance plan now! (Click here)
Get an IAS/IPS ranker as your 1: 1 personal mentor for UPSC 2024
Air Pollution
[pib] Global Methane Initiative (GMI)
From UPSC perspective, the following things are important :
Prelims level: Global Methane Initiative, GMI
Mains level: GHGs emission
India has co-chaired along with Canada the Global Methane Initiative leadership meet held virtually.
About Methane
- Methane is a greenhouse gas, which is also a component of natural gas.
- There are various sources of methane including human and natural sources.
- The anthropogenic sources are responsible for 60 per cent of global methane emissions.
- It includes landfills, oil and natural gas systems, agricultural activities, coal mining, wastewater treatment, and certain industrial processes.
- The oil and gas sectors are among the largest contributors to human sources of methane.
- These emissions come primarily from the burning of fossil fuels, decomposition in landfills and the agriculture sector.
Global Methane Initiative (GMI)
- GMI is a voluntary Government and an informal international partnership having members from 45 countries including the United States and Canada.
- The forum has been created to achieve global reduction in anthropogenic methane emission through partnership among developed and developing countries having economies in transition.
- The forum was created in 2004 and India is one of the members since its inception and has taken up Vice-Chairmanship for the first time in the Steering Leadership along with USA.
- National governments are encouraged to join GMI as Partner Countries, while other non-State organizations may join GMI’s extensive Project Network.
Focus areas
The initiative currently focuses on five sectors, which are known sources of anthropogenic methane emissions:
- Agriculture
- Coal mining
- Municipal solid waste
- Municipal wastewater
- Oil and gas systems
Why focus on Methane?
- The emission of methane is a big concern as it is a greenhouse gas having 25-28 times harmful effect than carbon dioxide
- According to the UN, 25 % of the warming that the world is experiencing today is because of methane.
- Methane is the second-most abundant greenhouse gas in the atmosphere, after carbon dioxide.
- According to IPCC, methane accounts for about half of the 1.0 degrees Celsius net rise in global average temperature since the pre-industrial era.
Back2Basics: CO2 Equivalents
- Each greenhouse gas (GHG) has a different global warming potential (GWP) and persists for a different length of time in the atmosphere.
- The three main greenhouse gases (along with water vapour) and their 100-year global warming potential (GWP) compared to carbon dioxide are:
1 x – carbon dioxide (CO2)
25 x – methane (CH4) – I.e. Releasing 1 kg of CH4into the atmosphere is about equivalent to releasing 25 kg of CO2
298 x – nitrous oxide (N2O)
- Water vapour is not considered to be a cause of man-made global warming because it does not persist in the atmosphere for more than a few days.
- There are other greenhouse gases which have far greater global warming potential (GWP) but are much less prevalent. These are sulphur hexafluoride (SF6), hydrofluorocarbons (HFCs), and perfluorocarbons (PFCs).
- There are a wide variety of uses for SF6, HFCs, and PFCs but they have been most commonly used as refrigerants and for fire suppression.
- Many of these compounds also have a depleting effect on ozone in the upper atmosphere.
UPSC 2022 countdown has begun! Get your personal guidance plan now! (Click here)
Get an IAS/IPS ranker as your 1: 1 personal mentor for UPSC 2024
Air Pollution
To check stubble burning, monitor policy implementation
From UPSC perspective, the following things are important :
Prelims level: Impact of stubble burning
Mains level: Paper 3- Measures to stop stubble burning
Context
Every October and November, parts of north India are engulfed by a dense fog. Farmers resort to the practice due to the limited time they have between the harvesting of kharif paddy and sowing of the rabi wheat.
Government initiatives to stop the stubble burning
- Policy measures: In 2014, the Ministry of Agriculture and Farmers Welfare developed a National Policy for the Management of Crop Residue.
- Ban by NGT: In 2015, the National Green Tribunal banned stubble burning in Rajasthan, Uttar Pradesh, Delhi, Haryana and Punjab.
- Weak enforcement: The enforcement of the ban has, however, been weak, largely due to inadequate political will.
- Legal measures: Stubble burning was considered an offence under Section 188 of the Indian Penal Code and in the Air and Pollution Control Act, 1981.
- However, it has now been decriminalised as per a recent government announcement.
- The Central Scheme on Promotion of Agricultural Mechanisation for In-Situ Management of Crop Residue was introduced in 2018-19.
- Over 1.5 lakh crop residue management machineries have been supplied to farmers and custom hiring centres between 2018-19 to 2020-21.
How successful were the measures?
- As a result of these efforts, the number of crop residue burning events declined from 2016 to 2019.
- This year satellite data did show an almost 50 per cent decline in the number of stubble burning events in Punjab, Haryana and UP in October.
- However, after including burning events till November 21, the decline reduced to about 8 per cent.
- Experts suggest that the respite in October was temporary as the initial decline can be attributed to the delayed withdrawal of monsoon.
- It is thus evident that despite various government initiatives, substantial stubble burning continues in several states.
Suggestions
- Subsidise operational cost for crop residue management: To ease farmers’ financial burden, the government could consider subsidising operational costs along with providing farmers capital subsidy on crop residue management equipment.
- Ex-situ management of crop residue: Ex-situ management of crop residue can also be explored under the schemes covering products such as bales and pellets for biomass power generation and supplementary feedstock in coal-fired power plants.
- Awareness generation: Awareness generation and trust building exercises should be undertaken with the support of local civil society organisations.
- Adopt targeted and cluster-based approach: Stubble burning is fairly concentrated in regions within states.
- A targeted and cluster-based approach can be undertaken by identifying districts with a higher number of stubble burning incidents.
- Central and state government interventions can then be concentrated in these districts.
- Monitoring system at local level: To make these interventions effective, there is a requirement for formulating a robust monitoring system at the local level to track the progress of different activities.
Consider the question “Stubble burning by farmers of the adjacent states contributes significantly to the air pollution in Delhi. In this context, examine the initiatives taken by the government to deal with the problem and suggest the way forward.”
Conclusion
Dealing with the practice of stubble burning requires efforts on multiple levels. A combination of these measures can complement the existing initiatives to encourage farmers to adopt zero stubble burning practices.
Get an IAS/IPS ranker as your 1: 1 personal mentor for UPSC 2024
Air Pollution
Centre and states must work together to tackle the pollution in the NCR
From UPSC perspective, the following things are important :
Prelims level: Not much
Mains level: Paper 3- Tackling air pollution through solar farming
Context
Supreme Court (SC) judges have pulled up the Delhi and central governments for not doing enough to correct the dire air quality situation. They also remarked on what message we are sending to the world.
The pollution problem raises doubt about the quality of urbanisation in India
- If one looks at the capitals of G20 countries, Delhi’s air quality index (AQI) during November 1-15, is by far the worst at 312, as per World Air Quality Index Project.
- India’s distinction goes beyond Delhi.
- As per the World Air Quality Report of 2020, prepared by IQAir (a Swiss organisation), of the 30 most polluted cities in the world, 22 are in India.
- The problem is much deeper, raising doubts about the quality of our urbanisation.
Contributing sources and their share
- Contributing sources: As per the report of the Ministry of Environment, Forest, and Climate Change submitted to the UN Framework Convention on Climate Change following sources contribute in the given proportion:
- Energy generation (largely coal-based thermal power) is the biggest culprit with a share of 44 per cent in greenhouse gas emissions,
- Energy generation is followed by manufacturing and construction-18 per cent.
- Agriculture-14 per cent.
- Transport-13 per cent industrial processes and product use- 8 per cent and waste burning- 3 per cent.
Suggestions to tackle Delhi’s pollution
- As per the System of Air Quality Forecasting and Research (SAFAR), the reasons for poor AQI differ day to day.
- On a particular day, say November 7, stubble burning contributed 48 per cent of Delhi’s air pollution, which fell to just 2 per cent on November 18.
- Reduce rice cultivation: The Centre needs to sit down with neighbouring states and come up with a plan to reduce the rice area in this belt, which is already depleting the water table, creating methane and nitrous oxide, to incentivise farmers to switch to other crops through better returns than in rice cultivation.
- Adopt EVs: To tackle vehicular pollution, we need a massive drive towards electric vehicles (EVs), and later towards green hydrogen when it becomes competitive with fossil fuels.
- Charging stations: Scaling up EVs quickly demands creating charging stations on a war footing.
- Develop carbon sink: Delhi also needs a good carbon sink.
- Rejuvenating the Ridge area with dense forests and developing thick forests on both sides of the Yamuna may help.
Enhancing farmers income through solar farming
- The Prime Minister has done a commendable job in Glasgow to commit that 50 per cent of India’s energy will be from renewable sources by 2030.
- To replace coal in energy generation, solar and wind is the way to go at the all-India level.
- The current model in solar energy is heavily tilted towards companies.
- They are setting up large solar farms on degraded or less fertile lands.
- We can supplement that model by developing solar farms on farmers’ fields.
- This would require solar panels to be fixed at a 10 feet height with due spacing to let enough sunlight come to the plants for photosynthesis.
- These “solar trees” can then become the “third crop” for the farmers, earning them regular income throughout the year, provided the law allows them to sell this power to the national grid.
- The Delhi government’s pilot in Ujwa KVK land on these lines showed that farmers can earn up to Rs 1 lakh per acre per year from this “solar farming”.
- This is on top of the two crops they can keep growing under those solar trees.
- This will double farmers’ income within a year.
Conclusion
As deteriorating air quality grips the whole country, we need to work on multiple levels with coordination to tackle the problem.
Get an IAS/IPS ranker as your 1: 1 personal mentor for UPSC 2024
Air Pollution
Perform, Achieve and Trade (PAT) Scheme
From UPSC perspective, the following things are important :
Prelims level: PAT Scheme
Mains level: Schemes for emission control
A recent report by the Centre for Science and Environment (CSE) has attributed the inefficiency of the PAT scheme to non-transparency, loose targets and overlooked deadlines.
PAT Scheme
- Perform Achieve and Trade (PAT) scheme is a flagship program of Bureau of Energy Efficiency under the National Mission for Enhanced Energy Efficiency (NMEEE).
- NMEEE is one of the eight national missions under the National Action Plan on Climate Change (NAPCC) launched by the Government of India in the year 2008
Working of the scheme
- PAT is a market-based compliance mechanism to accelerate improvements in energy efficiency in energy-intensive industries.
- The energy savings achieved by notified industries is converted into tradable instruments called Energy Saving Certificates (ESCerts).
- The ESCerts after issuance by the Bureau of Energy Efficiency are traded at Power Exchanges.
What is PAT cycle?
- The government shortlists industries and restricts the amount of energy they can consume and defines a time limit of three years by when this restriction should be met as part of PAT.
- These three years of time are called one PAT cycle.
- The industries are chosen after in-depth, sector-wise analysis by the government.
- Industries that participate in this scheme are called designated consumers (DC).
- Those that overachieve their targets are issued energy savings certificates (ESCerts) that can be traded with industries that have not achieved their targets.
- Non-achievers have to buy the ESCerts after the three years for compliance.
Various PAT cycles
- PAT covered about 13 energy-intensive sectors
- Sectors included are thermal power plants (TPP), cement, aluminium, iron and steel, pulp and paper, fertilizer, chlor-alkali, petroleum refineries, petrochemicals, distribution companies, railways, textile and commercial buildings (hotels and airports)
- Announcements for six cycles since 2012 have been made so far
UPSC 2022 countdown has begun! Get your personal guidance plan now! (Click here)
Get an IAS/IPS ranker as your 1: 1 personal mentor for UPSC 2024
Air Pollution
Graded Response Action Plan (GRAP)
From UPSC perspective, the following things are important :
Prelims level: Graded Response Action Plan (GRAP)
Mains level: Air quality issue in New Delhi

States in the National Capital Region were directed to be ready to implement actions under the ‘emergency’ category of the Graded Response Action Plan (GRAP) to control air pollution, said an official order.
Graded Response Action Plan (GRAP)
- In 2014, when a study by the WHO found that Delhi was the most polluted city in the world, panic spread in the Centre and the state government.
- Approved by the Supreme Court in 2016, the plan was formulated after several meetings that the Environment Pollution (Prevention and Control) Authority (EPCA) held with state government and experts.
- The result was a plan that institutionalized measures to be taken when air quality deteriorates.
- GRAP works only as an emergency measure.
How does it work?
- As such, the plan does not include action by various state governments to be taken throughout the year to tackle industrial, vehicular and combustion emissions.
- When the air quality shifts from poor to very poor, the measures listed under both sections have to be followed since the plan is incremental in nature.
- If air quality reaches the severe+ stage, GRAP talks about shutting down schools and implementing the odd-even road-space rationing scheme.
Measures taken under GRAP
1) Severe+ or Emergency
(PM 2.5 over 300 µg/cubic metre or PM10 over 500 µg/cu. m. for 48+ hours)
- Stop entry of trucks into Delhi (except essential commodities)
- Stop construction work
- Introduce odd/even scheme for private vehicles and minimise exemptions
- Task Force to decide any additional steps including shutting of schools
2) Severe
(PM 2.5 over 250 µg/cu. m. or PM10 over 430 µg/cu. m.)
- Close brick kilns, hot mix plants, stone crushers
- Maximise power generation from natural gas to reduce generation from coal
- Encourage public transport, with differential rates
- More frequent mechanized cleaning of road and sprinkling of water
3) Very Poor
(PM2.5 121-250 µg/cu. m. or PM10 351-430 µg/cu. m.)
- Stop use of diesel generator sets
- Enhance parking fee by 3-4 times
- Increase bus and Metro services
- Apartment owners to discourage burning fires in winter by providing electric heaters during winter
- Advisories to people with respiratory and cardiac conditions to restrict outdoor movement
4) Moderate to poor
(PM2.5 61-120 µg/cu. m. or PM10 101-350 µg/cu. m.)
- Heavy fines for garbage burning
- Close/enforce pollution control regulations in brick kilns and industries
- Mechanized sweeping on roads with heavy traffic and water sprinkling
- Strictly enforce a ban on firecrackers
Has GRAP helped?
- The biggest success of GRAP has been in fixing accountability and deadlines.
- For each action to be taken under a particular air quality category, executing agencies are clearly marked.
- In a territory like Delhi, where a multiplicity of authorities has been a long-standing impediment to effective governance, this step made a crucial difference.
UPSC 2022 countdown has begun! Get your personal guidance plan now! (Click here)
Get an IAS/IPS ranker as your 1: 1 personal mentor for UPSC 2024
Air Pollution
Mass Emission Standards for E12 AND E15 fuels
From UPSC perspective, the following things are important :
Prelims level: Ethanol Blended Petrol (EBP) Programme
Mains level: Not Much
The Ministry of Road Transport and Highways (MoRTH) has notified mass emission standards for E 12 (12% Ethanol with Gasoline) and E15 (15% Ethanol 12 with gasoline) fuels.
What is the news?
- The ministry has notified test standards for vehicles compliant with ethanol-blended fuel variants E12 and E15.
- The ministry made it mandatory for all automobile manufacturers to put “clearly visible stickers” on every vehicle informing about its compatibility to the level of ethanol blend (E12, E15, E20).
- Currently, India is using E10 fuel (petrol blended with 10% ethanol).
Ethanol Blended Petrol (EBP) Programme
- Ethanol Blended Petrol (EBP) programme was launched in January, 2003 for supply of 5% ethanol blended Petrol.
- The programme sought to promote the use of alternative and environment-friendly fuels and to reduce import dependency for energy requirements.
- OMCs are advised to continue according priority of ethanol from 1) sugarcane juice/sugar/sugar syrup, 2) B-heavy molasses 3) C-heavy molasses and 4) damaged food grains/other sources.
- At present, this programme has been extended to whole of India except UTs of Andaman Nicobar and Lakshadweep islands with effect from 01st April, 2019 wherein OMCs sell petrol blended with ethanol up to 10%.
Why ethanol blending?
- Agricultural waste management: Ethanol blending will solve the problem of agricultural waste as well as sugar rates due to excess production, therefore providing security to sugarcane farmers.
- Reducing emission: It can help accomplish dual goal of strengthening energy security with low carbon emission.
- Enhanced participation: It will enable local enterprises and farmers to participate in the energy economy.
- Reducing import bill: It is another significant benefit. India imports 85% of crude oil.
- Fuel efficiency: Ethanol blending increases octane number thereby increasing fuel quality in terms of anti-knocking tendency (engine sound)
Also read:
UPSC 2022 countdown has begun! Get your personal guidance plan now! (Click here)
Get an IAS/IPS ranker as your 1: 1 personal mentor for UPSC 2024
Air Pollution
Probe shows use of toxic material in firecrackers: Supreme Court
From UPSC perspective, the following things are important :
Prelims level: Air pollutants in crackers, Green Crackers
Mains level: Air pollution due to firecrackers

The Supreme Court has said a preliminary enquiry by the CBI into the firecracker industry, including in Tamil Nadu, revealed rampant violation of its ban on use of toxic ingredients like Barium and its salts.
Air Pollution created by firecrackers
- Firing crackers increase the concentration of dust and pollutants in the air.
- After firing, the fine dust particles get settled on the surrounding surfaces which are packed with chemicals like copper, zinc, sodium, lead, magnesium, cadmium and pollutants like oxides of sulphur and nitrogen.
- These invisible yet harmful particles affect the environment and in turn, put our health at stake.
Harmful elements used
- Copper: Irritates the respiratory tract.
- Cadmium: Leads to anemia by reducing the capacity of blood to carry oxygen.
- Zinc: Can cause metal fume fever and induces vomiting.
- Lead: Harms the nervous system.
- Magnesium: Metal fume fever is caused by Magnesium fumes.
- Sodium: It is a highly reactive element and caused burns when it is combined with moisture.
Why is the issue in news now?
Ans. Barium content
- A chemical analysis of the samples of finished and semi-finished firecrackers and raw materials taken from the manufacturers showed Barium content.
- The court stated that loose quantities of Barium were purchased from the market.
- Also, firecracker covers did not show the manufacture or expiry dates.
Issues with Barium
- Barium nitrate, which emits green flames when a cracker is lit, is a metal oxide that increases both air and noise pollution.
- There is is no clarity on whether barium nitrate can actually be used or not.
Alternatives: Green Crackers
- The new CSIR-NEERI formulation for green crackers has NO barium nitrate — one of the key ingredients of traditional firecrackers.
- These crackers have been named “safe water releaser (SWAS)”, “safe minimal aluminium (SAFAL)” and “safe thermite cracker (STAR)”.
- The three crackers release water vapour or air as a dust suppressant and diluent for gaseous emissions.
- These products can only be manufactured by those who have signed a non-disclosure agreement (NDA) with CSIR-NEERI.
- The green crackers are sold with a unique logo on the box, and will also have a QR code with production and emission details.
UPSC 2022 countdown has begun! Get your personal guidance plan now! (Click here)
Get an IAS/IPS ranker as your 1: 1 personal mentor for UPSC 2024
Air Pollution
WHO tightens Global Air Quality norms
From UPSC perspective, the following things are important :
Prelims level: Global Air Quality Guidelines (AQGs) 2021
Mains level: Air pollution
The World Health Organisation (WHO) in its first-ever update since 2005 has tightened global air pollution standards.
Global Air Quality Guidelines (AQGs) 2021
- WHO announces limits for six pollutant categories —particulate matter (PM) 2.5 and 10, ozone (O3), nitrogen dioxide (NO2) sulphur dioxide (SO2) and carbon monoxide (CO).

Air quality standards in India
- India aligns with the WHO guidelines only in the case of ozone and carbon monoxide, as these have not changed. But both NO2 and SO2 guidelines are tighter than the current Indian standard.
- The move doesn’t immediately impact India as the National Ambient Air Quality Standards (NAAQS) don’t meet the WHO’s existing standards.
- The government has a dedicated National Clean Air Programme that aims for a 20% to 30% reduction in particulate matter concentrations by 2024 in 122 cities, keeping 2017 as the base year.
Significance of WHO’s AQG
Ans. It sets the stage for eventual shifts in policy
- WHO move sets the stage for eventual shifts in policy in the government towards evolving newer stricter standards.
- This will soon become part of policy discussions — much like climate targets to reduce greenhouse gas emissions keep getting stricter over time.
- Once cities and States are set targets for meeting pollution emission standards, it could lead to overall changes in national standards.
Challenges for India
- The current challenge in India is to meet its national ambient air quality standards in all the regions.
- The hard lockdown phases during the pandemic have demonstrated the dramatic reduction that is possible when local pollution and regional influences can be minimised.
- This has shown that if local action is strengthened and scaled up at speed across the region, significant reduction to meet a much tighter target is possible.
- The influence of geo-climatic attributes is quite pronounced in all regions of India, which further aggravates the local build-up of pollution.
- This is further worsened due to the rapid proliferation of pollution sources and weak air quality management systems.
- India may require a more nuanced regional approach to maximise benefits and sustain air quality gains.
Conclusion
- Air pollution is a threat to health in all countries, but it hits people in low- and middle-income countries the hardest.
- WHO’s new Air Quality Guidelines are an evidence-based and practical tool for improving the quality of the air on which all life depends.
UPSC 2022 countdown has begun! Get your personal guidance plan now! (Click here)
Get an IAS/IPS ranker as your 1: 1 personal mentor for UPSC 2024
Air Pollution
[pib] Transport Initiative for Asia (TIA) Project
From UPSC perspective, the following things are important :
Prelims level: Transport Initiative for Asia
Mains level: Not Much
NITI Aayog and World Resources Institute (WRI), India, jointly launched the ‘Forum for Decarbonizing Transport’ in India as part of the NDC-Transport Initiative for Asia (NDC-TIA).
Transport Initiative for Asia
- The NDC Transport Initiative for Asia (TIA 2020-2023) is a joint programme that will engage China, India, and Vietnam in promoting a comprehensive approach to decarbonizing transport in their respective countries.
- The project is part of the International Climate Initiative (IKI).
- NITI Aayog is the implementing partner for the India component of the project.
- The project aims at bringing down the peak level of GHG emissions (transport sector) in Asia (in line with a well below 2-degree pathway), resulting in problems like congestion and air pollution.
Why need such initiative?
- India has a massive and diverse transport sector, which is also the third most CO2 emitting sector.
- Data suggests that within the transport sector, road transport contributes to more than 90% of the total CO2 emissions.
- The NDC-TIA India component focuses on developing a coherent strategy of effective policies and the formation of a multi-stakeholder platform for decarbonizing transport in the country.
UPSC 2022 countdown has begun! Get your personal guidance plan now! (Click here)
Get an IAS/IPS ranker as your 1: 1 personal mentor for UPSC 2024
Air Pollution
Delhi’s new Smog Tower
From UPSC perspective, the following things are important :
Prelims level: Smog Tower
Mains level: Air quality issue in New Delhi

Ahead of its infamous smog season, Delhi has got a ‘smog tower’, a technological aid to help combat air pollution.
What are Smog Towers?
- Smog towers are structures designed to work as large-scale air purifiers. They are fitted with multiple layers of air filters and fans at the base to suck the air.
- After the polluted air enters the smog tower, it is purified by the multiple layers before being re-circulated into the atmosphere.
Structure of the Delhi smog tower
- The structure is 24 m high, about as much as an 8-storey building — an 18-metre concrete tower, topped by a 6-metre-high canopy. At its base are 40 fans, 10 on each side.
- Each fan can discharge 25 cubic metres per second of air, adding up to 1,000 cubic metres per second for the tower as a whole. Inside the tower in two layers are 5,000 filters.
- The filters and fans have been imported from the United States.
How does it work?
- The tower uses a ‘downdraft air cleaning system’ developed by the University of Minnesota.
- Polluted air is sucked in at a height of 24 m, and filtered air is released at the bottom of the tower, at a height of about 10 m from the ground.
- When the fans at the bottom of the tower operate, the negative pressure created sucks in air from the top.
- The ‘macro’ layer in the filter traps particles of 10 microns and larger, while the ‘micro’ layer filters smaller particles of around 0.3 microns.
- The downdraft method is different from the system used in China, where a tower uses an ‘updraft’ system — air is sucked in from near the ground, and is propelled upwards by heating and convection.
- Filtered air is released at the top of the tower.
Likely impact
- Computational fluid dynamics modelling suggests the tower could have an impact on the air quality up to 1 km from the tower.
- The actual impact will also determine how the tower functions under different weather conditions, and how levels of PM2.5 vary with the flow of air.
UPSC 2022 countdown has begun! Get your personal guidance plan now! (Click here)
Get an IAS/IPS ranker as your 1: 1 personal mentor for UPSC 2024
Air Pollution
Air Quality Commission Bill, 2021
From UPSC perspective, the following things are important :
Prelims level: AQC and its jurisdiction
Mains level: Air pollution
The Lok Sabha has passed the Bill to formalize the Commission for Air Quality Management For National Capital Region and Adjoining Areas.
Highlights of the AQC Bill
- The AQC would be a ‘permanent’ body to address pollution in the National Capital Region Delhi and address sources of pollution in Delhi, Punjab, Rajasthan, Haryana and Uttar Pradesh.
- The all-powerful body assumed several powers to coordinate action among States, levy fines — ranging up to ₹1 crore or five years of prison — to address air pollution.
Key features
- Over-riding powers: While the Central Pollution Control Board (CPCB) and its state branches have the powers to implement provisions of the Environment Protection Act for air, water and land pollution.
- In case of dispute or a clash of jurisdictions, the AQC’s writ would prevail specific to matters concerning air pollution.
- Chair: The body has a full-time chairperson and a range of members consisting of both representatives from several Ministries as well as independent experts and will have the final say on evolving policy and issuing directions.
- Curb on stubble burning: the Commission may impose and collect environment compensation causing pollution by stubble burning.
- No penalties to farmers: The Centre, facing flak earlier this year from farmers protesting the farm laws, had committed to removing a clause in the Air Commission Bill that would penalize farmers for burning stubble, an important contributor to noxious air quality.
Get an IAS/IPS ranker as your 1: 1 personal mentor for UPSC 2024
Air Pollution
[pib] Centre launches Secured Logistics Document Exchange (SLDE) and GHG Calculator
From UPSC perspective, the following things are important :
Prelims level: SLDE, GHG Calculator
Mains level: NA
With an aim to further improve ease of doing business, Centre today launched the “Secured Logistics Document Exchange” along with a Calculator for Green House Gas Emissions.
Secured Logistics Document Exchange (SLDE)
- The SLDE platform is a solution to replace the present manual process of generation, exchange and compliance of logistics documents with a digitized, secure and seamless document exchange system.
- It is set to improve logistics efficiency, reduce logistics cost, and promote multi-modality and sustainability in a big way.
- This will enable generation, storage and interchange of logistics-related documents digitally using Aadhaar and blockchain-based security protocols for data security and authentication.
- It will also provide a complete audit trail of document transfer, faster execution of transaction, lower cost of shipping and overall carbon footprint, easy verification of authenticity of documents, lowered risk of fraud, etc.
- The proof of concept of the platform has been developed and executed with banks (ICICI, Axis Bank, State Bank of India and HDFC Bank) and stakeholders including freight forwarders, exporters, importers and vessel operators.
Green House Gas (GHG) Emission Calculator
- The GHG Calculator is an efficient, user-friendly tool and provides for calculating and comparing GHG emissions across different modes.
- It allows for a commodity-wise comparison of GHG emissions and total cost of transportation, including their environmental cost, between movement by road and rail.
- The tool is intended to facilitate appropriate modal choice for all concerned.
Back2Basics: Green House Gases (GHGs)
- A greenhouse gas (GHG) is a gas that absorbs and emits radiant energy within the thermal infrared range, causing the greenhouse effect.
- The primary greenhouse gases in Earth’s atmosphere are water vapor (H 2O), carbon dioxide (CO 2), methane (CH 4), nitrous oxide (N 2O), and ozone (O3).
- Without greenhouse gases, the average temperature of Earth’s surface would be about −18 °C (0 °F), rather than the present average of 15 °C (59 °F).
- The atmospheres of Venus, Mars, and Titan also contain greenhouse gases.
Get an IAS/IPS ranker as your 1: 1 personal mentor for UPSC 2024
Air Pollution
[pib] Aerosol Nucleation
From UPSC perspective, the following things are important :
Prelims level: Aerosol Nucleation
Mains level: Air pollution
Scientists tracing the concentration, size and evolution of aerosol particles smaller than 3 nanometers at an urban location in India have found the frequent formation of sub-3nm aerosol particles in the atmosphere.
What is Aerosol Nucleation?
- The formation of small molecular clusters of sub-3nm size is technically called aerosol nucleation, and subsequent growth of these newly formed clusters to the large sizes is called atmospheric new particle formation (NPF).
- NPF occurs everywhere in the terrestrial troposphere, and therefore it is a large source of aerosol numbers to the atmosphere.
- Though extensively studied globally using field observations, laboratory experiments and modelling approach, it is largely unexplored in India.
What has the new research found?
- The research showed that a pool of sub-3nm particles is often present in the atmosphere, but how fast these clusters grow depends on various factors.
- The scientists observed that only half of these events showed newly formed molecular clusters growing past 10 nm size.
- Thus particle size distributions display a conventional banana-shaped aerosol growth, which is indicative of regional NPF event.
Role of Sulphur
- The team found a strong positive correlation between sub-3nm particle concentrations and sulphuric acid concentrations, confirming the potential role of sulfuric acid in the formation of sub-3nm particles.
- While NPF often starts with sulphuric acid in the atmosphere, sulphuric acid alone fails to explain observed particle formation and growth rates in the atmosphere.
- Other vapours such as ammonia, amines and organics play a crucial role in the growth of newly formed particles.
- This has critical importance as a major fraction of these newly formed particles can reach to sizes of cloud condensation nuclei where they have climatic impacts.
Get an IAS/IPS ranker as your 1: 1 personal mentor for UPSC 2024
Air Pollution
International Nitrogen Initiative (INI)
From UPSC perspective, the following things are important :
Prelims level: Nitrogen pollution
Mains level: NA
The United Nations (UN) Sustainable Development Goals (SDGs) are the main focus of the eighth triennial conference of the International Nitrogen Initiative (INI) being held virtually this week.
International Nitrogen Initiative
- INI is an international program, set up in 2003 under the sponsorship of the Scientific Committee on Problems of the Environment (SCOPE) and from the International Geosphere-Biosphere Program (IGBP).
- The key aims of the INI are to:
- optimize nitrogen’s beneficial role in sustainable food production, and
- minimize nitrogen’s negative effects on human health and the environment resulting from food and energy production.
Answer this PYQ in the comment box:
Q.Which of the following adds/add nitrogen to the soil?
- Excretion of Urea by animals
- Burning of coal by man
- Death of vegetation
Select the correct answer using the code given below:
(a) 1 only
(b) 2 and 3 only
(c) 1 and 3 only
(d) 1, 2, and 3
Why nitrogen?
- Reactive nitrogen compounds like NOx, ammonia and the greenhouse gas nitrous oxide impact air, water and soil quality, health, biodiversity and climate change, among others.
- These compounds are lost from fertilizers, manures, and sewage as well as from fuel burning in transport and industry.
- Assessing and managing them sustainably will be crucial to achieving the 17 UN SDGs targeted for 2030.
Also read:
Back2Basics: Nitrogen Pollution
- While nitrogen is the dominant gas in the atmosphere, it is inert and doesn’t react.
- However, when it is released as part of compounds from agriculture, sewage and biological waste, nitrogen is considered reactive.
- It may be polluting and even exert a potent greenhouse gas effect.
- Nitrous oxide (N2O) is 300 times more potent than carbon dioxide but isn’t as prevalent in the atmosphere.
- Other than air pollution, nitrogen is also linked to the loss of biodiversity, the pollution of rivers and seas, ozone depletion, health, economy, and livelihoods.
- Nitrogen pollution is caused, for example, by emissions from chemical fertilizers, livestock manure and burning fossil fuels.
- Gases such as ammonia (NH3) and nitrogen dioxide (NO2) contribute to poor air quality and can aggravate respiratory and heart conditions, leading to millions of premature deaths across the world.
- Nitrate from chemical fertilizers, manure, and industry pollute the rivers and seas, posing a health risk for humans, fish, coral, and plant life.
Get an IAS/IPS ranker as your 1: 1 personal mentor for UPSC 2024
Air Pollution
[pib] Recycling Carbon Technology
From UPSC perspective, the following things are important :
Prelims level: Components of CCUS
Mains level: Carbon sequestration
A Bangalore-based startup has received the National Award 2021 for developing efficient catalysts and methodologies for the conversion of CO2 to methanol and other chemicals.
Carbon Recycling
- It has led to the improvisation of process engineering to enhance the production of chemicals and fuels from anthropogenic CO2.
- It has integrated multiple components involved in the CCUS (Carbon capture, utilization, and sequestration) to develop a complete solution for the environmental issues due to global warming.
- The current capacity of CO2 conversion is 300 kg per day, which can be scaled up to several 100 tons on an industrial scale.
What is CCUS?
- Carbon Capture, Utilization, and Storage (CCUS) encompass methods and technologies to remove CO2 from the flue gas and from the atmosphere.
- CCUS involves multiple aspects that need to be in sync for the successful removal or capture of CO2 from the flue gas or the atmosphere, followed by utilization and storage.
- Carbon capture involves the development of sorbents that can effectively bind to the CO2 present in flue gas or the atmosphere, which is expensive.
- In addition, there has been a considerable debate about the fate of captured and compressed CO2.
Get an IAS/IPS ranker as your 1: 1 personal mentor for UPSC 2024
Air Pollution
Delhi’s air quality deteriorates, again
From UPSC perspective, the following things are important :
Prelims level: AQI
Mains level: Paper 3- Air pollution in Delhi
Air quality to oscillate between poor to very poor
- Delhi’s air quality deteriorated from ‘moderate’ to ‘poor’ and ‘very poor’ on April 29.
- It will be oscillating between ‘poor’ and ‘very poor’ for the next three days, according to the SAFAR-System of Air Quality and Weather Forecasting and Research.
- Delhi’s air typically worsens in October-November and improves by March-April.
What is the cause
- Current weather conditions are not unfavourable, unlike in winter.
- Hence, apart from local emissions, the deterioration in air quality is being attributed to an increase in fire counts, mostly due to burning of wheat crop stubble in northern India.
- Deteriorating air quality is worrying amid an increasing number of novel coronavirus disease (COVID-19) and deaths.
Quality classification
- An AQI between 0-50 is considered ‘good.
- An AQI between 51-100 is considered satisfactory.
- An AQI between 101-200 is considered moderate.
- An AQI between 201-300 is considered poor.
- An AQI between 301-400 is considered very poor.
- An AQI between 401-500 is considered severe.
- Above 500 is the ‘severe-plus’ or ‘emergency’ category.
Get an IAS/IPS ranker as your 1: 1 personal mentor for UPSC 2024
Air Pollution
Limited sops make scrappage policy for vehicles unattractive
From UPSC perspective, the following things are important :
Prelims level: Not much
Mains level: Paper 3- What makes vehicle policy unattractive
Why the Vehicle Scrappage Policy is unattractive
- The policy proposes to de-register vehicles that fail fitness tests or are unable to renew registrations after 15-20 years of use.
- Limited incentives and poor cost economics for trucks in the Vehicle Scrappage Policy, coupled with lack of addressable volumes for other segments is unlikely to drive freight transporters to replace their old vehicles with new ones, said a Crisil report.
- Though the scrappage volume of buses, PVs and two-wheelers is expected to be limited as well, the policy’s impact on new commercial vehicle (CV) sales could be sizeable, based on addressable volume, ratings agency Crisil Research said in its report.
- The potential benefit from scrapping a 15-year-old, entry-level small car will be ₹70,000, whereas its resale value is around ₹95,000. That makes scrapping unattractive, Crisil said in the report.
Get an IAS/IPS ranker as your 1: 1 personal mentor for UPSC 2024
Air Pollution
World Air Quality Report, 2020
From UPSC perspective, the following things are important :
Prelims level: World Air Quality Report
Mains level: Air pollution in Delhi

Delhi remained the most polluted capital city in the world but India, on the whole, had improved its average annual PM 2.5 (particulate matter) levels higher in 2020 than in 2019, according to a report from World Air Quality Report Air.
Try this question from CS Mains 2015:
Q.Mumbai, Delhi and Kolkata are the three megacities of the country but air pollution is a much more serious problem in Delhi as compared to the other two. Why is this so?
World Air Quality Report
- It is released by a Swiss air quality technology company IQAir.
- IQAir is an air quality technology company that since 1963 seeks to empower individuals, organizations and communities to breathe cleaner air through information, collaboration and technology solutions.
- The 2020 Report is based on PM2.5 data from 106 countries that have been measured by ground-based monitoring stations.
Highlights of the report
- Of the 14 most polluted cities, 13 were in India.
- When ranked by cities, Hotan in China was the most polluted, with an average concentration of 110.2 µg/m³, followed by Ghaziabad in Uttar Pradesh at 106.
- Delhi’s concentration level, based primarily on data from the Central Pollution Control Board, was 84.1 µg/m³ in 2020, a 15% improvement from the 98.6 µg/m³ recorded in 2019 — a consequence of the lockdown.
- Bangladesh and Pakistan were the countries in 2020 with worse average PM 2.5 levels than India, says the report.
- China ranked 11th in the latest report, a deterioration from the 14th in the previous edition of the report. In the 2020 report, 106 countries were evaluated.
Get an IAS/IPS ranker as your 1: 1 personal mentor for UPSC 2024
Air Pollution
Curbing Benzene Emission
From UPSC perspective, the following things are important :
Prelims level: Benzene pollution
Mains level: Not Much
A joint committee appointed by the National Green Tribunal (NGT) to study air pollution in Kerala has pointed out that petrol refuelling stations were a major source of benzene emissions and volatile organic compounds (VOCs).
Why such a move?
- Benzene is a major constituent of evaporative emission due to its high volatility.
Try this PYQ:
Q.Consider the following:
- Carbon monoxide
- Methane
- Ozone
- Sulphur dioxide
Which of the above are released into atmosphere due to the burning of crop/biomass residue?
(a) 1 and 2 only
(b) 2, 3 and 4 only
(c) 1 and 4 only
(d) 1, 2, 3 and 4
What is Benzene?
- Benzene is a chemical that is a colourless or light yellow liquid at room temperature. It has a sweet odour and is highly flammable.
- It evaporates into the air very quickly. Its vapour is heavier than air and may sink into low-lying areas.
- It dissolves only slightly in water and will float on top of the water.
Its formation and uses
Benzene is formed from both natural processes and human activities.
- Natural sources of benzene include volcanoes and forest fires. Benzene is also a natural part of crude oil, gasoline, and cigarette smoke.
- Some industries use benzene to make other chemicals that are used to make plastics, resins, and nylon and synthetic fibres.
- It is also used to make some types of lubricants, rubbers, dyes, detergents, drugs, and pesticides.
Benzene emission
- The major sources of benzene exposure are tobacco smoke, automobile service stations, exhaust from motor vehicles, and industrial emissions.
- Benzene is present in both exhaust and evaporative emissions. Motor vehicles account for approximately 85% of the total benzene emissions.
- However, ingestion and dermal absorption of benzene can also occur through contact with contaminated water.
Get an IAS/IPS ranker as your 1: 1 personal mentor for UPSC 2024
Air Pollution
54,000 lives lost in Delhi due to air pollution
From UPSC perspective, the following things are important :
Prelims level: Willingness to pay mechanism
Mains level: Air pollution in Delhi

Air pollution claimed approximately 54,000 lives in Delhi in 2020, according to a Greenpeace Southeast Asia analysis of the cost to the economy due to air pollution.
Try this question from CS Mains 2015:
Q.Mumbai, Delhi and Kolkata are the three megacities of the country but the air pollution is a much more serious problem in Delhi as compared to the other two. Why is this so?
Deaths due to Air Pollution
- Globally, approximately 1,60,000 deaths have been attributed to PM 2.5 air pollution in the five most populous cities — Delhi, Mexico City, Sao Paulo, Shanghai and Tokyo.
- Six Indian cities — Delhi, Mumbai, Bengaluru, Chennai, Hyderabad and Lucknow — feature in the global analysis.
- An estimated 25,000 avoidable deaths in Mumbai in 2020 have been attributed to air pollution.
- Bengaluru, Chennai and Hyderabad estimated an approximate 12,000, 11,000, and 11,000 avoidable deaths respectively due to polluted air.
The ‘Cost Estimator’
- The ‘Cost Estimator’, an online tool that estimates the real-time health impact and economic cost from fine particulate matter (PM 2.5) air pollution in major world cities.
- It was deployed in collaboration between Greenpeace Southeast Asia, IQAir and the Centre for Research on Energy and Clean Air (CREA).
- Using real-time ground-level PM 2.5 measurements collated in IQAir’s database, the algorithm applies scientific risk models in combination with population and public health data.
Computing the “Lost Years”
- To show the impact of air pollution-related deaths on the economy, the approach used by Greenpeace is called ‘willingness-to-pay.
- It refers to a lost life year or a year lived with a disability is converted to money by the amount that people are willing to pay in order to avoid this negative outcome.
- The cost estimator also sustained the estimated air pollution-related economic losses of ₹1,23,65,15,40,000.
Greenpeace recommends-
- Despite a temporary reprieve in air quality owing to the lockdown, the latest figures from the report underscore the need to act immediately.
- The need of the hour is to rapidly scale up renewable energy, bring an end to fossil fuel emissions and boost sustainable and accessible transport systems.
Get an IAS/IPS ranker as your 1: 1 personal mentor for UPSC 2024
Air Pollution
[pib] Scheme for Management of Crop Residues
From UPSC perspective, the following things are important :
Prelims level: Air pollution
Mains level: Alternatives solutions for stubble burning
The Scheme on ‘Promotion of Agricultural Mechanization for In-Situ Management of Crop Residue in the States of Punjab, Haryana, Uttar Pradesh and NCT of Delhi’ has been extended for the year 2021-22.
We can cite the example of this scheme for crop residue management as an effective solution against stubble burning.
Management of Crop Residues
- In pursuance this, a central sector scheme (100% funded by centre) was launched in 2018 Budget to support the efforts of the governments of Haryana, Punjab, Uttar Pradesh and the NCT of Delhi to address air pollution.
- It aimed to subsidize the machinery required for in-situ management of crop residue.
Various objectives of the scheme:
- Protecting the environment from air pollution and preventing loss of nutrients and soil micro-organisms caused by burning of crop residue;
- Promoting in-situ management of crop residue by retention and incorporation into the soil through the use of appropriate mechanization inputs and
- Creating awareness among stakeholders for effective utilization and management of crop residue
Outcomes of the scheme
- The residue burning events in 2020 in Punjab, Haryana and UP together have reduced by -30% as compared to 2016.
- In Punjab the reduction is -22.7%, Haryana – 63.8% and UP – 52.01%.
Get an IAS/IPS ranker as your 1: 1 personal mentor for UPSC 2024
Air Pollution
What is Nitrogen-Use Efficiency (NUE)?
From UPSC perspective, the following things are important :
Prelims level: NUE, Nitrogen's GHG potential
Mains level: Nitrogen pollution

A group of Indian scientists have found a way to improve crops by reducing wastage of nitrogen fertilizers applied to them.
Try this PYQ:
Q.Which of the following adds/add nitrogen to the soil?
- Excretion of Urea by animals
- Burning of coal by man
- Death of vegetation
Select the correct answer using the code given below:
(a) 1 only
(b) 2 and 3 only
(c) 1 and 3 only
(d) 1, 2, and 3
Nitrogen-Use Efficiency
- NUE is calculated as a ratio between nitrogen used and harvest: A higher number denotes low wastage.
- With the efficiency on the decline, farmers use more fertiliser in the hope of raising yield. This in turn worsens NUE.
- Crops generally use up 30 per cent of nitrogen fertilizer applied; the rest seeps into the environment, harming health and adding to climate change.
- Researchers were able to identify phenotypes or visibly identifiable features that determine the efficiency with which cultivated rice varieties (cultivars) use nitrogen.
- This efficiency is known as nitrogen-use efficiency (NUE).
- Cereals consume over 69 per cent of nitrogen fertilizers in India; rice tops the list with 37 per cent, followed by wheat (24 per cent).
Nitrogen Pollution: the reason behind
- Agriculture leads to 70 per cent of nitrous oxide emissions in India.
- Of this, 77 per cent is contributed by fertilizers, mostly urea, according to the Indian Nitrogen Assessment published in 2017.
- This greenhouse gas (GHG) is 300 times more potent than carbon dioxide.
- It has replaced methane as the second-largest component of GHG emissions from Indian agriculture in the past 15 years.
Must read:
Get an IAS/IPS ranker as your 1: 1 personal mentor for UPSC 2024
Air Pollution
Air pollution in India
From UPSC perspective, the following things are important :
Prelims level: Not much
Mains level: Paper 3- Dealing with the air pollution through regulations
Despite efforts from several levels, air pollution is getting worse day by day. The article suggests the strategy to deal with the issue of air pollution.
Solvable problem
- Pollution is very much a solvable problem but it cannot be solved on an emergency basis.
- It has to be dealt with firmly and gradually.
- Why gradually? Because there are many sources of pollution and it would be prohibitively costly to stop them or even significantly reduce them all at once.
Replacing existing technologies with existing technology
- The biggest sources air polltion nationally are cooking fires, coal-fired power plants, various industries, crop residue burning, and construction and road dust. Vehicles are further down on the list.
- Dealing with all these sources will require a gradual replacement of existing technologies with new technologies.
- Cooking fires must be replaced with LPG, induction stoves, and other electric cooking appliances.
- Old coal power plants must be closed and replaced with wind and solar power and batteries while newer plants must install new pollution control equipment.
- No new coal-fired power plants should be built — with renewables being cheaper, coal is obsolete for power generation.
- Other industries that use coal will have to gradually switch over to cleaner fuel sources such as gas or hydrogen while becoming more energy-efficient at the same time.
- Farmers will have to switch crops or adopt alternative methods of residue management.
- Diesel and petrol vehicles must gradually be replaced by electric or hydrogen fuel cell vehicles running on power generated from renewables.
Legal measures and issues
- Governments can make clean investments more profitable and dirty investments less profitable by taxing polluting activities and subsidising clean investments.
- The judiciary is more powerful but has far less scientific and technical competence.
- It tends to act only during crises and focus on past mistakes rather than planning to prevent new ones.
Reforms in regulatory agency
- Our existing laws do not allow the central and state pollution boards to levy pollution fee or cess based on pollution emissions.
- Since closing down an industry is a drastic step, it almost never happens.
- We need a regulatory agency that can levy pollution fee or cess, is that the regulatory decision need not be an all-or-nothing decision.
- Pollution fees can start small, and the EPA can announce that they will rise by a certain percentage every year.
- The regulatory agency should be given some independence,like
- 1) a head appointed for a five-year term removable only by impeachment.
- 2) a guaranteed budget funded by a small percentage tax on all industries.
- 3) autonomy to hire staff and to set pollution fees after justification through scientific studies.
- Three advantages of the regulator with such powers would be-
- 1) Politicians in power can pass on the blame for decisions on pollution fees to the EPA.
- 2) Pollution fees raise revenue for the government.
- 3) If the law establishing an independent EPA is written to require that changes to pollution fees and regulations must be published in advance, and cannot involve abrupt changes, then surprises are avoided.
- Industry opposition will be muted, especially if industry gets a piece of the revenue to invest in new technologies.
Conclusion
Our pollution problem has taken decades to grow into the monster that it is. It can’t be killed in a day. We need the scientific and technical capacity that only a securely funded independent EPA can bring to shrink pollution down to nothing.
Get an IAS/IPS ranker as your 1: 1 personal mentor for UPSC 2024
Air Pollution
State Pollution Control Boards
From UPSC perspective, the following things are important :
Prelims level: Role of CPCB and SPCBs
Mains level: Paper 3- Issues faced by SPCBs
The article deals with the issues faced by the State Pollution Control Boards.
Role of CPCB and State Pollution Control Boards
- The pollution crisis is a highly complex, multi-disciplinary issue with several contributory factors.
- To address this crisis, India has a plethora of rules, laws and specialised agencies which, at least on paper, seem very impressive.
- The footsoldiers of India’s battle against polluters are its officials at the state pollution control boards.
- The Central Pollution Control Board (CPCB) based in Delhi is generally well funded and resourced, unlike the state pollution control boards (SPCBs) that are in charge of implementation of the rules that CPCB writes.
5 issues faced by SPCBs
1) Shortage of Staff
- As an illustration, the Haryana State Pollution Control Board has been operating with a 70 per cent staff shortage.
- What this means practically is that a single officer is tasked to handle the demands of pollution control for an entire district without any subordinate technical staff.
- This comes at the cost of not being able to do inspections and other core pollution control work.
2) Lack of specialisation
- The officers at the SPCBs do not get to develop any specialisation.
- The CPCB has a decent workforce and robust laboratories, where scientists once recruited get to work and excel in a particular area.
- On the other hand, SPCBs don’t have such a stratified system, and the same officer is in charge of all these pollution categories, making it impossible to gain expertise and excel in any one area.
3) Lack of legal skills to take on pollutors
- SPCBs lack the necessary legal skills to take on polluters.
- While a legal cell may exist at the head office of a SPCB, they have few full-time public prosecutors there.
- As a result, engineering graduates in district SPCB offices — have to play the role of lawyers and develop legal paperwork that often falls short of holding polluters to account.
- Clerks and superintendents at courts often refuse to file cases, pointing at flaws that someone not trained in law would naturally make.
4) Lack of funds
- SPCBs are chronically underfunded.
- For instance, the funds of several SPCBs such as Haryana’s largely come from “No Objection Certificates” and “Consent to Operate” that the boards grant to industries and projects, rather than budgetary allocations by the government.
- Owing to this, SPCB officials are unable to spend on critical functions.
5) Additional duties
- SPCB officials are at times given additional responsibilities that are unrelated to pollution control.
- Haryana’s SPCB, for instance, has poultry farms under its ambit.
Consider the question “Dealing with the crisis of air pollution need coordination at various levels and the State Pollution Control Boards play an important role in it. In light of this, examine the challenges and suggest the steps needed to empower them.”
Conclusion
India must empower SPCBs to act by giving them the necessary funds, human resources, tools and technologies.
Get an IAS/IPS ranker as your 1: 1 personal mentor for UPSC 2024
Air Pollution
The cost of cleaning air
From UPSC perspective, the following things are important :
Prelims level: Not much
Mains level: Paper 3- Funds allocated for containing air pollution and issue of its inadequacy
The article deals with the issue of allocation of funds to tackle air pollution and issues with it.
Allocation in the budget
- A ₹4,400 crore package was announced in last budget for 2020-21 to tackle air pollution in 102 of India’s most polluted cities.
- The funds would be used to reduce particulate matter by 20%-30% from 2017 levels by 2024 under the National Clean Air Programme (NCAP).
Issues with estimating the scale of the problem
- It is unclear if this amount is adequate because the scale of the problem is unknown.
- Delhi government spent money on the measurement of pollution for in Delhi that far exceeds s allocations that find mention in the Centre and State government’s budgeting books.
- The funds allocated don’t account for the trained manpower and the support system necessary to effectively maintain the systems and these costs are likely to be significant.
- Historically, cites have used manual machines to measure specified pollutants and their use has been inadequate.
- An analysis by research agencies Carbon Copy and Respirer Living Sciences recently found that only 59 out of 122 cities had PM 2.5 data available.
- Only three States, had all their installed monitors providing readings from 2016 to 2018.
- Prior to 2016, making comparisons of reduction strictly incomparable.
- Now manual machines are being replaced by automatic ones and India is still largely reliant on imported machines.
- In the case of the National Capital Region, at least ₹600 crore was spent by the Ministry of Agriculture over two years to provide subsidised equipment to farmers in Punjab and Haryana and dissuade them from burning paddy straw.
- Yet this year, there have been more farm fires than the previous year and their contribution to Delhi’s winter air woes remain unchanged.
- This indicates that money alone doesn’t work.
Conclusion
A clear day continues to remain largely at the mercy of favourable meteorology. While funds are critical, proper enforcement, adequate staff and stemming the sources of pollution on the ground are vital to the NCAP meeting its target.
Get an IAS/IPS ranker as your 1: 1 personal mentor for UPSC 2024
Air Pollution
Brown Carbon ‘Tarballs’
From UPSC perspective, the following things are important :
Prelims level: brown , black carbon
Mains level: Glacial melting of himalayas

A study has highlighted that brown carbon ‘tarballs’ that fasten the glacial melting has been found in the Himalayan atmosphere.
We are still to find a solution for the ill-fated Delhi air, and here comes another blow from the stubble burnings.
What are Brown Carbon ‘Tarballs’?
- Tarballs are small light-absorbing, carbonaceous particles formed due to burning of biomass or fossil fuels that deposit on snow and ice.
- They are formed from brown carbon, emitted during the burning of fossil fuels.
- The median sizes of externally mixed tarballs and internally mixed tarballs were 213 and 348 nanometre respectively.
- Primary brown carbon (BrC) co-emitted with black carbon (BC) from biomass burning is an important light-absorbing carbonaceous aerosol.
- The black carbon from the Indo-Gangetic Plain can reach the Himalaya region and influence glacial melting and climatic change.
Highlights of the study
- Until now, black carbon was found to be transported long distances by the wind to the Himalayan atmosphere.
- The study revealed that a dense array of active fire spots — corresponding to large-scale wheat-residue burning on the Indo-Gangetic Plain — occurred along the pathways of Himalaya.
- The percentage of the tarballs increased on days of higher levels of pollution and could contribute to the hastening of glacial melt and global warming.
- The researchers concluded that tarballs from long-range transport can be an important factor in the climatic effect and would correspond to a substantial influence on glacial melting in the Himalaya region.
Get an IAS/IPS ranker as your 1: 1 personal mentor for UPSC 2024
Air Pollution
Pusa Bio-Decomposer
From UPSC perspective, the following things are important :
Prelims level: Pusa Biodecomposer
Mains level: Alternatives solutions for stubble burning
Delhi CM has said that the “Pusa bio-decomposer” is a success in Delhi and he will inform the Supreme Court that it is an effective way to prevent stubble burning.
Pusa Bio-decomposer provides a unique alternative against the stubble burning practices.
Pusa Bio-decomposer
- It is a solution developed by the scientists at the Indian Agricultural Research Institute, Pusa, which can turn crop residue into manure in 15 to 20 days and therefore, can prevent stubble burning.
- It involves making a liquid formulation using Pusa decomposer capsules and readily available inputs, fermenting it over 8-10 days, and then spraying the mixture on fields.
- It is a mix of seven fungi that produce enzymes to digest cellulose, lignin and pectin in paddy straw.
- The fungi thrive at 30-32 degree Celsius, which is the temperature prevailing when paddy is harvested and wheat is sown.
Back2Basics: Decomposition
- Decomposition refers to a biological process of breaking down organic material into smaller constituent parts.
- The decomposition of organic substances is ecologically significant. It plays a part in the nutrient cycle. It is an essential process of recycling matter in the biosphere.
- A decomposer is an organism whose ecological function involves the recycling of nutrients by performing the natural process of decomposition as it feeds on decaying organisms.
- Examples of decomposers are fungi and bacteria that obtain their nutrients from a dead plant or animal material.
- They break down cells of dead plants and animals into simpler substances, which become organic nutrients available to the ecosystem.
Get an IAS/IPS ranker as your 1: 1 personal mentor for UPSC 2024
Air Pollution
Private: Stubble Burning
From UPSC perspective, the following things are important :
Prelims level: Pollutants released due to stubble burning
Mains level: Paper 3- Stubble burning issue
The stubble burning issue grabs the headlines every winter. And this year is no different.
Background of stubble burning
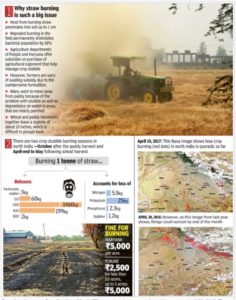
- Stubble burning refers to the practice of farmers setting fire to plant debris that remain in farms after harvest.
- The origin of stubble burning can be traced to the advent of the Green Revolution and mechanised harvesting.
- The Green Revolution increased greatly rice and wheat production, which simultaneously increased stubble post harvest.
- Combined harvesting technique was not efficacious, as machines left behind one-foot-tall stalks.
- This prompted stubble burning as a low-cost and speedy solution.
- Other factor was the limited time period of 20-25 days between harvesting one crop and sowing another.
Environmental Impact:
- Air Pollution: A study estimates that crop residue burning released 149.24 million tonnes of carbon dioxide (CO2), over 9 million tonnes of carbon monoxide (CO), 0.25 million tonnes of oxides of sulphur (SOX), 1.28 million tonnes of particulate matter and 0.07 million tonnes of black carbon.
- Responsible for the haze in Delhi: Crop burning contributed nearly 40% of the near-surface PM 2.5 in Delhi in 2016, which saw one of Delhi’s severest pollution episode
- Soil Fertility: The heat from burning paddy straw penetrates 1 centimetre into the soil, elevating the temperature to 33.8 to 42.2 degree Celsius. This kills the bacterial and fungal populations critical for a fertile soil. The solubility capacity of the upper layers of soil has also been reduced.
- Pests in atmosphere: Burning of crop residue causes damage to other micro-organisms present in the upper layer of the soil as well as its organic quality. Due to the loss of ‘friendly’ pests, the wrath of ‘enemy’ pests has increased and as a result, crops are more prone to disease.
Legislative measures
- In 2013, stubble burning was banned by the Punjab government.
- In 2015, the National Green Tribunal imposed a ban on stubble burning in Rajasthan, Uttar Pradesh, Haryana and Punjab.
- NGT also directed government to assist farmers by obtaining equipment like happy seeders and rotavator.
- Stubble burning is an offence under Section 188 of the Indian Penal Code and the Air (Prevention and Control of Pollution) Act of 1981.
Supreme Court on Stubble Burning
- The Supreme Court, in November 2019, had directed the governments of Punjab, Haryana and Uttar Pradesh to pay farmers a financial incentive to curb the practice
- In 2019, the Punjab government paid Rs 28.51 crore to 31,231 farmers, while Haryana’s paid Rs 1.63 crore to 4,000. This year, the Haryana government expects to pay as much as Rs 301 crore.
- However, Supreme Court appointed Environment Pollution (Prevention and Control) Authority, or EPCA, is right in saying that an incentive of Rs 100 per quintal of grain—paid on top of the MSP during procurement by the Centre—is “not viable”.
Recent measures
- Recently, in Aditya Dubey v. Union of India, the Supreme Court appointed a one-man committee (headed by Justice Madan B. Lokur) to monitor and provide steps to prevent stubble burning activities in Punjab, Haryana and U.P. Haryana.
- The committee submitted that numerous steps are taken to curb stubble burning, including the development of an app to detect and notify authorities about stubble burning committed in a particular field.
- Now the Union government has brought out an ordinance to set up a permanent commission for air quality management, which will replace the Justice Madan B. Lokur Commission.
Way Ahead
- Short term Solution: Giving farmers easy and affordable access to the machines which allow them to do smart straw management is the short term solution to the problem
- Dual Strategy: Both in-situ (in the field) and ex-situ (elsewhere) solutions need to be considered, apart from tackling the fundamental factors prompting the practice.
- Affordability of Government Measures: A key factor will be ensuring affordability of service for those hiring the machines; Haryana has reserved 70% of the machines at panchayat-run CHCs for small and marginal farmers, while Punjab has prioritised service to them.
- Utilizing Crop Stubble: Instead of burning of the stubble, it can be used in different ways like cattle feed, compost manure, roofing in rural areas, biomass energy, mushroom cultivation, packing materials, fuel, paper, bio-ethanol and industrial production, etc.
- The long-term solution has to be crop diversification, away from paddy
- The action plan of Punjab and Haryana focus on setting up Custom Hiring Centres which will facilitate farmers removing stubble by providing them with machinery such as the happy seeder, rotavator, paddy straw chopper, etc. on rent along with the supply of more balers.
- As per a study by the International Maize and Wheat Improvement Centre, the application of happy seeders and super SMS machines can improve agricultural productivity by 10% to 15% while reducing labour costs and allowing the soil to become more fertile.
Conclusion
The practice of stubble burning, is harmful to environment and health of millions. But the solution to the issue must address the concerns of the farmers. So, solutions based on technology and PUSA Decomposer could be the step in the right directions.
Get an IAS/IPS ranker as your 1: 1 personal mentor for UPSC 2024
Air Pollution
Commission for Air Quality Management in NCR
From UPSC perspective, the following things are important :
Prelims level: Mandate of the commission
Mains level: Air pollution in Delhi
The President of India has signed the Commission for Air Quality Management in National Capital Region and Adjoining Areas Ordinance, 2020.
Try this question from CS Mains 2015:
Q.Mumbai, Delhi and Kolkata are the three megacities of the country but the air pollution is a much more serious problem in Delhi as compared to the other two. Why is this so?
About the Ordinance
- The Ordinance seeks to create an overarching body to consolidate all monitoring bodies and to bring them on one platform so air quality management can be carried out in a more comprehensive, efficient, and time-bound manner.
- It came within days of the hearing in ‘Aditya Dubey vs Union of India’ in the court of the CJI, where Solicitor General had indicated the setting up of such a Commission.
Why has the central government set up this Commission?
- The monitoring and management of air quality in the Delhi NCR region have been done piecemeal by multiple bodies including the Central Pollution Control Board (CPCB) and the adjacent state PCBs and state governments.
- They, in turn, are monitored by the Environment Ministry, and the Supreme Court itself, which monitors air pollution as per the judgment in ‘M C Mehta vs Union of India’, 1988.
Consolidating the efforts
- The Centre seeks to relieve the Supreme Court from having to constantly monitor pollution levels through various pollution-related cases.
- The body indicates the central government’s push to bring all stakeholders on one platform.
- This is important because the management of air pollution in Delhi NCR will involve controlling stubble-burning (Agriculture Ministry and state governments), and the control of industrial emissions (Commerce and Industries Ministry), etc.
About the Commission
- The Commission, which will be a permanent body, will have over 20 members and will be chaired by a retired official of the level of Secretary to the GoI or Chief Secretary of a state.
- It will include a representative of the Secretary of the MoEFCC, five Secretary level officers who will be ex officio members and two joint secretary-level officers who will be full-time members.
- The Commission will also have representation from the CPCB, ISRO, air pollution experts, and three representatives of non-government organisations (NGOs).
- As associate members, the Commission will have representatives from various other Ministries including the Ministries of Agriculture, Petroleum, Power, Transport, Housing etc.
Power and functions
- In matters of air pollution and air quality management, the Commission will supersede all existing bodies.
- It will have the powers to issue directions to the states.
- The Commission will also coordinate efforts of state governments to curb air pollution, and will lay down the parameters of air quality for the region.
- It will have powers to restrict the setting up of industries in vulnerable areas and will be able to conduct site inspections of industrial units.
Penal powers
- The Commission will have some penal powers.
- If its directions are contravened, through say, the setting up of an industrial unit in a restricted area, the Commission will have the power to impose a fine of up to Rs 1 crore and imprisonment of up to 5 years.
Wasn’t EPCA effective?
- The one body with powers similar to the new Commission’s was the Environment Pollution (Prevention and Control) Authority (EPCA).
- It was not a statutory body but drew legitimacy from the Supreme Court, which has been looking at cases of air pollution as part of the judgment in M C Mehta vs Union of India (1988).
- The EPCA was not, however, supported by a legal framework in the form of a law. It did have the authority to issue fines or directions and guidelines to the governments in other states.
How is the new commission expected to alter the situation?
- By forming a new commission, the government has taken the issue of air pollution out of the purview of the judiciary.
- As per the Ordinance, only NGT, and not civil courts, is authorised to hear cases where the commission is involved.
- The central government has got itself out of the clutch of Supreme Court and closed down SC-appointed EPCA.
Challenges ahead
- The Commission has a large number of members from the central government, which has not gone down well with the states.
- It is full of officials from the central government. Taking away any say from the state government is not the way to go further.
- Also, political differences will also now play a part in the functioning of the Commission because states are not happy with the overarching powers being vested in it.
Get an IAS/IPS ranker as your 1: 1 personal mentor for UPSC 2024
Air Pollution
What is Yellow Dust?
From UPSC perspective, the following things are important :
Prelims level: Yellow dust
Mains level: Air pollution

North Korean authorities have urged citizens to remain indoors to avoid contact with a mysterious cloud of ‘yellow dust’ blowing in from China, which they have warned could bring Covid-19 with it.
Try this PYQ:
Q.Consider the following
- Birds
- Dustblowing
- Rain
- Windblowing
Which of the above spread plant diseases?
(a) 1 and 3 only
(b) 3 and 4 only
(c) 1, 2 and 4 only
(d) 1, 2, 3 and 4
What is yellow dust?
- Yellow dust is actually sand from deserts in China and Mongolia that high-speed surface winds carry into both North and South Korea during specific periods every year.
- The sand particles tend to mix with other toxic substances such as industrial pollutants, as a result of which the ‘yellow dust’ is known to cause a number of respiratory ailments.
- Usually, when the dust reaches unhealthy levels in the atmosphere, authorities urge people to remain indoors and limit physical activity, particularly heavy exercise and sport.
- Sometimes, when the concentration of yellow dust in the atmosphere crosses around 800 micrograms/cubic meter, schools are shut and outdoor events cancelled in the affected areas.
Get an IAS/IPS ranker as your 1: 1 personal mentor for UPSC 2024
Air Pollution
State of Global Air Report, 2020
From UPSC perspective, the following things are important :
Prelims level: Particulate Matter
Mains level: Pollution induced mortality in India

Air pollution now biggest health risk in India, says the State of Global Air 2020 Report.
State of Global Air Report
- The State of Global Air report brings into one place the latest information on air quality and health for countries around the globe.
- It is produced annually by the Health Effects Institute and the Institute for Health Metrics and Evaluation’s Global Burden of Disease project.
India’s exposure to pollution
- Long-term exposure to outdoor and household air pollution contributed to over 1.67 million annual deaths from stroke, heart attack, diabetes, lung cancer, chronic lung diseases and neonatal diseases in India in 2019.
- Overall, air pollution was now the largest risk factor for death among all health risks, the report noted.
- Outdoor and household particulate matter pollution also contributed to the deaths of more than 1,16,000 Indian infants in their first month of life last year.
- For the youngest infants, most deaths were related to complications from low birth weight and preterm birth.
A comparison with peers
- India faced the highest per capita pollution exposure — or 83.2 μg/cubic metre — in the world.
- It is followed by Nepal at 83.1 μg/cubic metre and Niger at 80.1.
- Countries with the least population exposure are below 8 micrograms (μg) per cubic metre.
Back2Basics: Particulate Matter
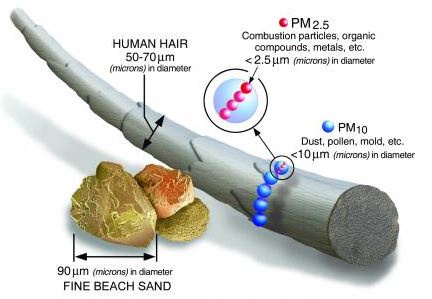
- PM is the term for a mixture of solid particles and liquid droplets found in the air. Some particles, such as dust, dirt, soot, or smoke, are large or dark enough to be seen with the naked eye.
- Others are so small they can only be detected using an electron microscope.
- Particle pollution includes:
- PM10 : inhalable particles, with diameters that are generally 10 micrometres and smaller; and
- PM2.5: fine inhalable particles, with diameters that are generally 2.5 micrometres and smaller.
Sources of PM
- These particles come in many sizes and shapes and can be made up of hundreds of different chemicals.
- Some are emitted directly from a source, such as construction sites, unpaved roads, fields, smokestacks or fires.
- Most particles form in the atmosphere as a result of complex reactions of chemicals such as sulfur dioxide and nitrogen oxides, which are pollutants emitted from power plants, industries and automobiles.
Harmful effects of PM
- Particulate matter contains microscopic solids or liquid droplets that are so small that they can be inhaled and cause serious health problems.
- Some particles less than 10 micrometres in diameter can get deep into your lungs and some may even get into your bloodstream.
- Of these, particles less than 2.5 micrometres in diameter, also known as fine particles or PM2.5, pose the greatest risk to health.
Get an IAS/IPS ranker as your 1: 1 personal mentor for UPSC 2024
Air Pollution
Towards cleaner air in Delhi
From UPSC perspective, the following things are important :
Prelims level: Not much
Mains level: Paper 3- Delhi air-pollution issue
The article suggests the three-pronged strategy to deal with the emission from transportation and highlights the importance of coordination at various level to deal with the issue of pollution.
Anti-pollution campaign in Delhi
- With air pollution returning to pre-COVID levels, the Delhi administration has launched a major anti-pollution campaign this month.
- The campaign is focused on cutting the deadly smoke from thermal plants and brick kilns in the National Capital Region as well as on chemical treatment of stubble burning from nearby States.
Abating emission from transportation
- Delhi’s long-term solution will depend importantly also on abating emissions from transportation.
- Delhi needs a 65% reduction to meet the national standards for PM2.5.
- Vehicles, including trucks and two-wheelers, contribute 20%-40% of the PM2.5 concentrations.
- Tackling vehicle emissions would be one part of the agenda, as in comparable situations in Bangkok, Beijing, and Mexico City.
Three-part action to combat emissions from transportation
- A three-part action comprises emissions standards, public transport, and electric vehicles.
1) Stricter enforcement of emission controls
- Two-wheelers and three-wheelers were as important as cars and lorries in Beijing’s experience.
- Bangkok ramped up inspection and maintenance to cut emissions.
- The first order of business is to implement the national standards.
2) Strengthening public transport
- Bus Rapid Transit (BRT) around the world show how the sizeable investment cost is more than offset by the benefits, and that financing pays off.
- Delhi has lessons from its BRT experience in designating better BRT lanes, improving the ticketing system and synchronising with the Metro.
- The Supreme Court’s ruling to increase Delhi’s bus fleet and align it with the Metro network must be carried out.
- The ‘odd-even’ number plate policy can help, but the system should reduce exemptions, allow a longer implementation period, and complement it with other measures.
3) Adoption of electric vehicle: A long term solution
- Subsidies and investment will be needed to ensure that EVs are used to a meaningful scale.
- The Delhi government’s three-year policy aims to make EVs account for a quarter of the new vehicles registered in the capital by 2024.
- EVs will gain from purchase incentives, scrappage benefits on older vehicles, loans at favourable interest and a waiver of road taxes.
Need for coordination at various level
- Transport solutions need to be one part of pollution abatement that includes industry and agriculture.
- Delhi’s own actions will not work if the pollution from neighbouring States is not addressed head on.
- Technical solutions need to be underpinned by coordination and transparency across Central, State, and local governments.
- Public opinion matters.
- Citizen participation and the media are vital for sharing the message on pollution and health, using data such as those from the Central Pollution Control Board.
Conclusion
- It is a matter of prioritising people’s health and a brighter future. Once the pandemic is over, Delhi must not stumble into yet another public health emergency. The time to act is now.
Get an IAS/IPS ranker as your 1: 1 personal mentor for UPSC 2024
Air Pollution
Global Nitrous Oxide Pollution
From UPSC perspective, the following things are important :
Prelims level: Various GHGs
Mains level: Hazards of N2O pollution
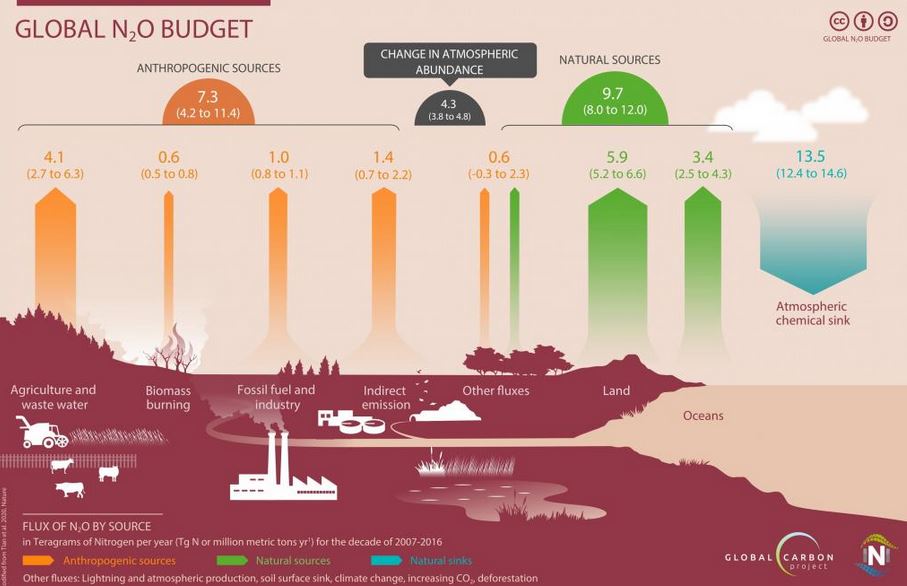
Human emissions of nitrous oxide (N2O) — a greenhouse gas 300 times more potent than carbon dioxide (CO2) — increased by 30 per cent between 1980 and 2016.
Observe the above image carefully and try to find out the major contributor of nitrous oxide emission in the Global N2O Budget.
What is Nitrous oxide?
- Nitrous oxide is a dangerous gas for the sustainable existence of humans on Earth.
- It has the third-highest concentration — after CO2 and methane — in our atmosphere among greenhouse gases responsible for global warming.
- N2O can live in the atmosphere for up to 125 years.
- Most N2O emissions have come from emerging countries like India, China and Brazil.
About the research
- Nitrous oxide global concentration levels have increased from 270 parts per billion (ppb) in 1750 to 331 ppb in 2018 — a jump of 20 per cent.
- The growth has been the quickest in the past five decades because of human emissions.
- The research was conducted through an international collaboration between the International Nitrogen Initiative (INI) and the Global Carbon Project of Future Earth, a partner of the World Climate Research Programme.
Why N2O matters?
- N2O is also the only remaining threat to the ozone layer, for it accumulates in the atmosphere over a long period of time, just like CO2.
- The increase in its emissions means that the climatic burden on the atmosphere is increasing from non-carbon sources as well, while the major focus of global climate change negotiations is currently centred on carbon.
- A major proportion of the N2O emissions in the last four decades came from the agricultural sector, mainly because of the use of nitrogen-based fertilizers.
- The growing demand for food and feed for animals will further increase global nitrous oxide emissions.
Get an IAS/IPS ranker as your 1: 1 personal mentor for UPSC 2024
Air Pollution
What is Graded Response Action Plan (GRAP)?
From UPSC perspective, the following things are important :
Prelims level: GRAP
Mains level: Not Much
The Supreme Court has directed Delhi and neighbouring States to implement air pollution control measures under “very poor” and “severe” category air quality of the Graded Response Action Plan (GRAP).
Note the various measures under the GRAP under various grades of Air Quality.
Graded Response Action Plan (GRAP)
- In 2014, when a study by the WHO found that Delhi was the most polluted city in the world, panic spread in the Centre and the state government.
- Approved by the Supreme Court in 2016, the plan was formulated after several meetings that the Environment Pollution (Prevention and Control) Authority (EPCA) held with state government and experts.
- The result was a plan that institutionalized measures to be taken when air quality deteriorates.
- GRAP works only as an emergency measure.
How does it work?
- As such, the plan does not include action by various state governments to be taken throughout the year to tackle industrial, vehicular and combustion emissions.
- When the air quality shifts from poor to very poor, the measures listed under both sections have to be followed since the plan is incremental in nature.
- If air quality reaches the severe+ stage, GRAP talks about shutting down schools and implementing the odd-even road-space rationing scheme.
Measures taken under GRAP
1)Severe+ or Emergency
(PM 2.5 over 300 µg/cubic metre or PM10 over 500 µg/cu. m. for 48+ hours)
- Stop entry of trucks into Delhi (except essential commodities)
- Stop construction work
- Introduce odd/even scheme for private vehicles and minimise exemptions
- Task Force to decide any additional steps including shutting of schools
2) Severe
(PM 2.5 over 250 µg/cu. m. or PM10 over 430 µg/cu. m.)
- Close brick kilns, hot mix plants, stone crushers
- Maximise power generation from natural gas to reduce generation from coal
- Encourage public transport, with differential rates
- More frequent mechanized cleaning of road and sprinkling of water
3) Very Poor
(PM2.5 121-250 µg/cu. m. or PM10 351-430 µg/cu. m.)
- Stop use of diesel generator sets
- Enhance parking fee by 3-4 times
- Increase bus and Metro services
- Apartment owners to discourage burning fires in winter by providing electric heaters during winter
- Advisories to people with respiratory and cardiac conditions to restrict outdoor movement
4) Moderate to poor
(PM2.5 61-120 µg/cu. m. or PM10 101-350 µg/cu. m.)
- Heavy fines for garbage burning
- Close/enforce pollution control regulations in brick kilns and industries
- Mechanized sweeping on roads with heavy traffic and water sprinkling
- Strictly enforce a ban on firecrackers
Has GRAP helped?
- The biggest success of GRAP has been in fixing accountability and deadlines.
- For each action to be taken under a particular air quality category, executing agencies are clearly marked.
- In a territory like Delhi, where a multiplicity of authorities has been a long-standing impediment to effective governance, this step made a crucial difference.
Get an IAS/IPS ranker as your 1: 1 personal mentor for UPSC 2024
Air Pollution
[pib] Nationally Determined Contributions (NDC) Transport Initiative for Asia (TIA)
From UPSC perspective, the following things are important :
Prelims level: NDC, TIA
Mains level: India's NDC
NITI Aayog will virtually launch the India Component of the Nationally Determined Contributions (NDC)–Transport Initiative for Asia (TIA).
Try this PYQ:
Q.The term Intended Nationally Determined Contribution is sometimes seen in the news in the context of:
(a) Pledge made by the European countries to rehabilitate refuges from the war-affected Middle East.
(b) Plan of nation outlined by the countries of the world to combat climate changes.
(c) Capital contributed by the member countries in the establishment of Asian Infrastructure Investment Bank.
(d) Plain of action outlined by the countries of the regarding SDGs.
What is NDC-TIA?
- It is a joint programme, supported by the International Climate Initiative (IKI) of the German Ministry for the Environment, Nature Conservation and Nuclear Safety (BMU).
- On behalf of the GoI, NITI Aayog will be the implementing partner.
- It aims to promote a comprehensive approach to decarbonize transport in India, Vietnam, and China.
- It is implemented by a consortium of seven other organisations.
Working
- The programme has a duration of 4 years.
- The India Component will focus on establishing a multi-stakeholder dialogue platform for decarbonizing transport in India, strengthening GHG and transport modelling capacities.
- It would help in financing climate actions in transport, offering policy recommendations on electric vehicle (EV) demand and supply policies.
Why need TIA?
- India has a massive and diverse transport sector that caters to the needs of billion people.
- It has the world’s second-largest road network, which contributes to maximum GHG emissions through all means of transportation.
- With increasing urbanisation, the fleet size i.e. the number of sales of vehicles is increasing rapidly.
- It is projected that the total number of vehicles will be doubled by 2030.
Get an IAS/IPS ranker as your 1: 1 personal mentor for UPSC 2024
Air Pollution
[pib] Himalayan Geothermal Springs release huge amount of carbon dioxide in the atmosphere
From UPSC perspective, the following things are important :
Prelims level: Geothermal springs
Mains level: Not Much

The Himalayas, which hosts about 600 geothermal springs needs to be considered while estimating emissions to the carbon cycle and thereby to global warming says, Indian researchers.
Note the following hot springs in India:
1) Panamik in Nubra valley
2) Kheer Ganga in Kullu, Himachal
3) Manikaran Sahib, Himachal
4) Tattapani, Chhattisgarh
5) Gaurikund, Uttarakhand
6) Yumthang, Sikkim
7) Reshi, Sikkim
Geothermal springs

- Geothermal or Hot springs are heated by shallow intrusions of magma (molten rock) in volcanic areas. Some thermal springs, however, are not related to volcanic activity.
- The water is heated by convective circulation: groundwater percolates downward & reaches depths of a kilometre or more where the temperature of rocks is high because of the normal temperature gradient of the Earth’s crust.
Why consider the Himalayas?
- The Himalayan geothermal springs which cover about 10,000 square km in the Garhwal region of Himalaya show a significant discharge of CO2 rich water.
- The estimated carbon dioxide degassing (removal of dissolved gases from liquids, especially water or aqueous solutions) flux is nearly 7.2 ×10⁶ mol/year to the atmosphere.
- Such CO2 degassing should be taken into account to assess global carbon outflux in the earth’s atmosphere.
Where does this CO2 come from?
- Carbon outflux from Earth’s interior to the exosphere through volcanic eruptions, fault zones, and geothermal systems contribute to the global carbon cycle that effects short and long term climate of the Earth.
- The CO2 in the thermal springs are sourced from metamorphic decarbonation of carbonate rocks present deep in the Himalayan core along with magmatism and oxidation of graphite.
- Most of the geothermal water is dominated by evaporation followed by weathering of silicate rocks.
- Isotopic analyses further point towards a meteoric source for geothermal water.
Get an IAS/IPS ranker as your 1: 1 personal mentor for UPSC 2024
Air Pollution
What is a ‘Smog Tower’?
From UPSC perspective, the following things are important :
Prelims level: Smog towers
Mains level: Air pollution in Delhi
In January this year, the Supreme Court has directed that two smog towers should be installed in the capital by April on a pilot project basis considering a proposal by the IIT-Bombay.
Try this question from CS Mains 2015:
Q.Mumbai, Delhi and Kolkata are the three mega cities of the country but the air pollution is much more serious problem in Delhi as compared to the other two. Why is this so?
What is a ‘Smog Tower’?
- A smog tower is a structure designed to work as a large-scale air purifier, fitted with multiple layers of filters which trap fine dust particles suspended in the air as it passes through them.
- Air is drawn through fans installed at the top of the tower, passed through filters, and then released near the ground.
- The large-scale filters expected to be installed in the towers in Delhi would use carbon nanofibres as a major component.
- It would be fitted along the peripheries of the towers and the height would be 20 metres.
How does it work?
- The 20-metre (65 feet) high tower will trap particulate matter of all sizes suspended in the air.
- Large-scale air filters shall draw in the air through fans installed at the top before passing it through the filters and releasing it near the ground.
- The filters installed in the tower will use carbon nanofibres as a major component and will be fitted along its peripheries. The tower will focus on reducing particulate matter load.
Has anyone else experimented with a smog tower?
- Yes, smog towers have been experimented with in recent years in cities in the Netherlands, China, South Korea and Poland.
- The first such tower was erected in 2015, in Rotterdam, Netherlands, created by Dutch artist Daan Roosegaarde.
- The towers to be installed in Delhi are to be the result of a collaboration between the IITs at Mumbai and Delhi, and the University of Minnesota.
Why New Delhi?
- Air pollution in the national capital has been an issue of concern for quite some time as Delhi and its suburbs have ranked among the most polluted cities in the world frequently.
- In 2014, the World Health Organisation (WHO) had declared Delhi the most polluted city in the world.
- Pollution levels in Delhi increase dramatically during winter — on some days to nearly 10 times above the limits prescribed by WHO, posing a serious risk to vulnerable and also healthy populations.
- This is large because sources of emissions — construction work, industrial and vehicular pollution — in and around the city remain more or less consistent.
- The situation is aggravated at the start of winter by smoke from stubble-burning in northwestern states, coupled with unfavourable meteorological conditions, such as calm winds, low temperatures, and fewer sunny days.
How effective are smog towers?
- An estimate on air quality shows that a tower would reduce 50% of the particulate matter load in an area of 1 kilometre in the direction of the wind, as well as 200 metres each along the sides of the tower and against the direction of the wind.
- In an open field in calm weather, it can reduce the particulate matter of 10 micrometres (PM10) up to 45%, and PM2.5 levels up to 25% in an area of 20 metres around the tower, as per details on the ENS Clean Air website.
Get an IAS/IPS ranker as your 1: 1 personal mentor for UPSC 2024
Air Pollution
‘Decarbonizing Transport in India (DTI)’ Project
From UPSC perspective, the following things are important :
Prelims level: ITF, OECD
Mains level: Policy measures for cleaner transportation

NITI Aayog in collaboration with International Transport Forum (ITF) is set to launch the “Decarbonising Transport in India” project with the intention to develop a pathway towards a low-carbon transport system for India.
Note the following things about ‘Decarbonising Transport in India (DTI)’ Project:
-
Associated international institution
-
Whether the institution is a UN body or not
-
If India is a member of that body
The DTI Project
- The India project is carried out in the wider context of the International Transport Forum’s “Decarbonising Transport” initiative.
- It is part of the “Decarbonising Transport in Emerging Economies” (DTEE) family of projects, which supports transport decarbonisation across different world regions.
- India, Argentina, Azerbaijan, and Morocco are current participants.
- The DTEE is a collaboration between the ITF and the Wuppertal Institute, supported by the International Climate Initiative (IKI) of the German Federal Ministry for the Environment.
Objectives of the project
- The project will design a tailor-made transport emissions assessment framework for India.
- It will provide the government with a detailed understanding of current and future transport activity and the related CO2 emissions as a basis for their decision-making.
About International Transport Forum (ITF)
- The ITF is an inter-governmental organisation within the OECD (Organisation for Economic Co-operation and Development) system.
- It is the only global body with a mandate for all modes of transport.
- It acts as a think tank for transport policy issues and organises the annual global summit of transport ministers.
- The ITF’s motto is “Global dialogue for better transport”.
- India has been a member of ITF since 2008.
Back2Basics: OCED
- The OECD is an international, intergovernmental economic organization of 36 countries.
- OECD was founded in the year 1961 to stimulate world trade and economic progress.
- OECD originated in 1948, as the Organisation for European Economic Co-operation (OEEC).
- The Organisation for European Economic Co-operation (OEEC) was founded to govern the predominantly US-funded Marshall Plan for post-war reconstruction on the continent.
- The OEEC was instrumental in helping the European Economic Community (EEC). The EEC has evolved into the European Union (EU) to establish a European Free Trade Area.
- India is NOT a member of OECD.
Get an IAS/IPS ranker as your 1: 1 personal mentor for UPSC 2024
Air Pollution
Aerosols Radiative Effects in the Himalayas
From UPSC perspective, the following things are important :
Prelims level: Aerosols
Mains level: Assessing the potential of aerosols in global warming

Indian researchers have found that the effect of anthropogenic aerosols is much higher over the high altitudes of western trans-Himalayas.
Try this question from CSP 2019:
Q. In the context of which of the following do some scientists suggest the use of cirrus cloud thinning technique and the injection of sulphate aerosol into the stratosphere?
(a) Creating the artificial rains in some regions
(b) Reducing the frequency and intensity of tropical cyclones
(c) Reducing the adverse effects of solar wind on the Earth
(d) Reducing the global warming
What are Aerosols?
- An aerosol is a suspension of fine solid particles or liquid droplets in air or another gas.
- They can be natural or anthropogenic.
- Examples of natural aerosols are fog, mist, dust, forest exudates and geyser steam. Examples of anthropogenic aerosols are particulate air pollutants and smoke.
- The liquid or solid particles have diameters typically less than 1 μm; larger particles with a significant settling speed make the mixture a suspension, but the distinction is not clear-cut.
- Technological applications of aerosols include dispersal of pesticides, medical treatment of respiratory illnesses, and combustion technology.
Heat pump over the Himalayas
- The transport of light-absorbing carbonaceous aerosols and dust from the polluted Indo-Gangetic Plain and desert areas over the Himalayas constitutes a major climatic issue due to severe impacts on atmospheric warming and glacier retreat.
- This heating over the Himalayas facilitates the “elevated-hat pump” that strengthens the temperature gradient between land and ocean and modifies the atmospheric circulation and the monsoon rainfall.
Findings of the research
- The monthly-mean atmospheric radiative forcing of aerosols leads to heating rates of 0.04 to 0.13 C per day.
- Further, the temperature over the Ladakh region is increasing 0.3 to 0.4 degrees Celsius per decades from the last 3 decades.
How are aerosols fuelling the heat?
- The atmospheric aerosols play a key role in the regional/global climate system through scattering and absorption of incoming solar radiation and by modifying the cloud microphysics.
Assessing the Aerosol potential
- Despite the large progress in quantifying the impact of different aerosols on radiative forcing, it still remains one of the major uncertainties in the climate change assessment.
- Precise measurements of aerosol properties are required to reduce the uncertainties, especially over the oceans and high altitude remote location in the Himalayas where they are scarce.
- Researchers have analysed the variability of aerosol optical, physical and radiative properties and the role of fine and coarse particles in aerosol radiative forcing (ARF) assessment.
- ARF is the effect of anthropogenic aerosols on the radiative fluxes at the top of the atmosphere and at the surface and on the absorption of radiation within the atmosphere.
Significance of ARF study
- A scientific study of aerosol generation, transport, and its properties has important implications in our understanding and mitigation of climate change via atmospheric warming.
- Aerosols impact the snow and glacier dynamics over the trans-Himalayan region.
- The results from the study can help better understanding of aerosol effects in view of aerosol-climate implications.
Get an IAS/IPS ranker as your 1: 1 personal mentor for UPSC 2024
Air Pollution
What is Urban Ozone?
From UPSC perspective, the following things are important :
Prelims level: Urban Ozone
Mains level: Good and Bad Ozone

A Manchester (UK) based research has found that the nationwide lockdown may be leading to the generation of a dangerous pollutant, urban ozone.
The Ozone is formed due to different factors in the Troposphere and the Stratosphere (where the ozone acts as a protective layer). Note these differences from prelims perspective.
Urban Ozone
- The photochemical production of ozone may become more important in urban areas during summertime in these low conditions of oxides of nitrogen.
- As nitrogen oxides reduce, photochemical production may become more efficient and can lead to higher ozone concentrations in the summertime.
- The higher summer temperatures increase emissions of biogenic hydrocarbon from natural sources such as trees. These biogenic hydrocarbons significantly affect urban ozone levels.
- While ozone is important for screening harmful solar UV radiation when present higher up in the atmosphere, it can be a danger at the Earth’s surface and can react to destroy or alter many biological molecules.
Back2Basics: Ozone Gas
- It is a gas that occurs both in the Earth’s upper atmosphere and at ground level.
- Ozone occurs in two layers of the atmosphere. The layer closest to the Earth’s surface is the troposphere.
- Here, ground-level or “bad” ozone is an air pollutant that is harmful to breathe and it damages crops, trees and other vegetation. It is the main ingredient of urban smog.
- The stratospheric or “good” ozone protects life on Earth from the sun’s harmful ultraviolet (UV) rays.
Formation of Ozone
- Ozone is produced naturally in the stratosphere when highly energetic solar radiation strikes molecules of oxygen, and cause the two oxygen atoms to split apart in a process called photolysis. If a freed atom collides with another O2, it joins up, forming ozone.
- The majority of tropospheric ozone formation occurs when nitrogen oxides (NOx), carbon monoxide (CO) and volatile organic compounds (VOCs), react in the atmosphere in the presence of sunlight, specifically the UV spectrum.
Get an IAS/IPS ranker as your 1: 1 personal mentor for UPSC 2024
Air Pollution
Environmental regulations: go or no go?
From UPSC perspective, the following things are important :
Prelims level: NDMA, NDMA-2005 and its provisions.
Mains level: Paper 3- Lowering of environment standard is not a good strategy to revive the economy in the wake of corona pandemic.
As the world struggles to restart the economic activities amid the pandemic, various strategies are being advised to salvage the damaged economies. One amongst them is to cut down on the environmental standards to spur the economic activities. This article explains why India should not be short-sighted to lower the environmental standards.
What is this fuss about environment and lockdown?
-
The lockdown exit strategies are focused on saving livelihoods.
-
But the lockdown is causing fiscal pressures on governments which further motivates it to lower the environmental standards, suspend environmental monitoring requirements and reduce environmental enforcement. (Well to save some bucks.)
-
And also in the belief that this is necessary to secure economic growth.
-
But it would be a mistake to assume that there is a trade-off between saving livelihoods and protecting the environment.
-
The crisis of COVID-19 has highlighted that improving the quality of air in our country is not a matter of choice but an emergency.
How countries around the world are reacting?
-
The US announced a significant reduction in fuel efficiency standards for new cars.
-
This move could result in increased gasoline consumption by 80 billion tonnes, pumping increased carbon emissions into the atmosphere.
-
The US Environmental Protection Agency has announced that it will not be enforcing compliance with routine monitoring and reporting obligations of environmental protection, for an indefinite period.
-
13 European ministers have been outspoken about resisting the temptations of short-term solutions in response to the present crisis- need to maintain and strengthen EU’s effective regulatory tools to stick to its 2030 climate goals.
5 Arguments that Indian authorities that look into viz a viz environmental standards
1. Pollution increases risk to COVID-19
-
People living in areas with higher levels of air pollution face increased risk of premature death from COVID-19.
-
New Delhi was the world’s most polluted capital city for the second straight year in 2019.
-
And India was also home to 21 of the world’s 30 most polluted cities, Swiss-based group IQ AirVisual said in a recent study.
-
The State of Global Air 2019 Report finds air pollution responsible for over 1.2 million deaths in China and India each, based on 2017 data.
2. The poor are the most affected by air pollution
-
There is enormous inequality in the impact of the COVID-19 fallout.
-
Those who suffer the most from air pollution are the millions who live and toil in the open, who cannot afford air-purifiers or other mitigating measures, as also the elderly and children.
3. Risk of future pandemics
-
There is good evidence that three-quarters of the emerging infectious diseases migrate from wild or domesticated animals into humans.
-
This includes Ebola, SARS, MERS and now COVID-19.
-
Deforestation, industrial agriculture, illegal wildlife trade, climate change and other types of environmental degradation increase the risk of future pandemics.
4. Public support for environment protection
-
From Delhi to Sao Paulo, Bangkok to Bogota, the dramatic improvement in the quality of air and water in the most polluted cities around the world has been transmitted by social media.
-
This may well result in a groundswell of public support for measures to protect the environment.
5. The environment will get the value it deserves
-
The corona pandemic will jolt the markets into giving a clean, healthy and sustainable environment the economic value it deserves.
-
There’s a possibility that the gulf between what markets value, and what people value, will close.
Environment conservation as a silver lining in this Pandemic
-
We have never treated air pollution as a national emergency, failing to coordinate between the Centre and state governments.
-
The COVID pandemic has been declared a national disaster in India, under the National Disaster Management Act, 2005.
-
This legislation mandates the disaster authorities coordinate among themselves and take measures for the prevention and mitigation of the pandemic.
-
Preventing and mitigating the risks of COVID-19, therefore, means the mandate for the disaster authorities is also to tackle air and other forms of pollution head-on.
Questions based on disasters have been a recurring theme in the UPSC. In 2014, a question was asked with respect to drought, the same could be asked about air pollution. In 2017 again a question based on role of NDMA and tsunami was aksed. In 2018, a question based on Sendai Framework was asked.
Conclusion
The NDMA is a platform which should be used to combat air pollution as an emergency, similar coordination will be required at an international level to continue to work towards reduced emissions under the Paris Agreement. It is a great pity that it takes a pandemic to bring the realisation that economic growth versus clean air is a false dichotomy.
Back2Basics: NDMA
- On 23 December 2005, the Government of India enacted the Disaster Management Act, which envisaged the creation of the National Disaster Management Authority (NDMA).
- It is headed by the Prime Minister, and State Disaster Management Authorities (SDMAs) headed by respective Chief Ministers.
- It aims to spearhead and implement a holistic and integrated approach to Disaster Management in India.
Get an IAS/IPS ranker as your 1: 1 personal mentor for UPSC 2024
Air Pollution
Private: Cleaner air: Can we go back to ‘normal’?
From UPSC perspective, the following things are important :
Prelims level: Not Much
Mains level: Unexpected outcomes of the lockdown due to covid outbreak
Context
As India remains in lockdown to combat the novel coronavirus disease (COVID-19) pandemic, the Central Pollution Control Board (CPCB), has informed of a massive drop in air pollution, showing varied trends across Delhi, the National Capital Region (NCR) and other cities.
Why reduction in Pollution?
- Complete restrictions on non-essential vehicular movement and commercial activities and closure of industry and construction.
- Without traffic, re-suspension of road dust is also under control.
How much is the reduction?
- There has been an overall drop of 35-40 per cent in particulate matter (PM) 10 and PM2.5 levels in Delhi;
- NOx levels have halved; industrial areas like Mundka and Narela and traffic areas of Dwarka and Pusa are substantially cleaner.
- Air quality improvement in NCR towns, however, is comparatively less pronounced.
- But Gurugram, Faridabad, Ghaziabad and Noida have recorded ‘Good’ Air Quality Index (AQI) levels around March 26-29, 2020.
- The weather has also favoured partially.
- The Indo-Gangetic plain is significantly cleaner.
- Seventeen cities have moved to the ‘Satisfactory’ AQI category and seven cities to the ‘Good’ category. Change is not that dramatic in coastal cities.
- Chennai even experienced a slight increase in local reasons.
Ecological insights from this lockdown
This ‘aberrant’ situation that the CPCB analysis has captured, has helped to understand several critical dimensions
i. Local trends affected by local pollution:
- The CPCB has stated that the regional influence on air quality is minimal at this moment.
- Local trends are more affected by the local pollution situation. Though background pollution remains a complex issue, cities can assess persistent local problems better to refine action plans.
ii. Relative contribution of different sources:
- This time, it has also been possible to scientifically estimate the relative contribution of different sources to the overall decline in pollution concentration.
- Based on the 2018 source apportionment study of The Energy and Resources Institute and Automotive Research Association of India, CPCB has estimated this change for Delhi.
- Given the fact that in summers, dust and construction activities cause about 35 per cent of PM2.5 concentration, and transport and industry sectors 20 per cent each, their proportionate role is evident.
- Industry’s contribution to the overall drop is about 10 per cent; transport’s share is about 15 per cent, and the dust contribution is about 10-15 per cent.
- Lower refuse burning, minimum activities in airports, etc have also contributed.
- This science can be strengthened further to inform action.
Challenges in achieving a similar outcome in future
- Forced shutdown: This reduction has been possible because of the forced shutdown and this is not expected to last.
- Political will: Will this translate into strong public and political support for hard and inconvenient solutions?
- We have seen how the perception of immediate health risks has led to massive lifestyle adjustment and the virtual workplace has reduced travel. How is deep restructuring possible for effective emissions reduction and near-zero-emissions strategies without sliding back?
- Economy vs Environment debate: This will not be easy given our unique vulnerability — livelihood distress in our informal economy, with the weakest environmental safeguards.
- This sector will need state support for technology and clean fuel transition while delivering on welfare objectives.
- The poor face a double burden — livelihood insecurity because of air pollution control and increased health burden due to toxic exposure. How will distributive welfare and justice be delivered?
Conclusion
- Yet, valuable lessons from these extraordinary times are with us;
- when the ongoing national clean air programme has entered the phase of implementation, quarterly tracking of progress in city action plans has started, committed funding for air pollution control to the urban local bodies in cities with million population by the Finance Commission has come through, air pollution and health science is getting stronger, and courts are asking for accountability and fixing responsibility.
- India cannot continue to face extended health emergencies with even weaker lungs. The blue skies today are ephemeral and transient. But we cannot also return to what we know as normal and regular.
Get an IAS/IPS ranker as your 1: 1 personal mentor for UPSC 2024
Air Pollution
[pib] Methanotrophs: the methane-oxidizing bacteria
From UPSC perspective, the following things are important :
Prelims level: Methanotrophs
Mains level: Methane emission

Scientists at Agharkar Research Institute (ARI), Pune have isolated 45 different strains of methanotrophic bacteria which have been found to be capable of reducing methane emissions from rice plants.
What are Methanotrophs?
- They are bacteria that metabolize and convert methane into carbon-di-oxide.
- They can effectively reduce the emission of methane, which is the second most important greenhouse gas (GHG) and 26 times more potent as compared to carbon-di-oxide.
- In rice fields, Methanotrophs are active near the roots or soil-water interfaces.
- Besides methane mitigation studies, Methanotrophs can also be used in methane value addition (valorization) studies.
- Bio-methane generated from waste can be used by the Methanotrophs and can be converted to value-added products such as single-cell proteins, carotenoids, biodiesel, and so on.
Why rice fields?
- Rice fields are human-made wetlands and are waterlogged for a considerable period. Anaerobic degradation of organic matter results in the generation of methane.
- Rice fields contribute to nearly 10% of global methane emissions.
- Very few studies in the world have focused on Methanotrophs from tropical wetlands or tropical rice fields.
- Practically no cultures of indigenously isolated Methanotrophs from India were available.
- Native and relevant Methanotrophs isolated from rice fields can be excellent models to understand the effect of various factors on methane mitigation.
Must read:
https://www.civilsdaily.com/news/greenhouse-gas-emissions-from-indian-paddy-fields-very-high-ny-based-study/
Get an IAS/IPS ranker as your 1: 1 personal mentor for UPSC 2024
Air Pollution
[pib] Biomethanation Process
From UPSC perspective, the following things are important :
Prelims level: Biomethanation Process
Mains level: Biomethanation as an alternative for stubble burning

In an all India coordinated project, efforts are on to produce bio-gas for kitchen use and quality manure for fields using bio-methanation of rice straw by anaerobic digestion method. Six domestic level paddy straw-based bio-gas plants have been installed in Punjab for field trials and further study is in progress.
What is Biomethanation?
- It is a process by which organic material is microbiologically converted under anaerobic conditions to biogas.
- Three main physiological groups of microorganisms are involved: fermenting bacteria, organic acid oxidizing bacteria, and methanogenic archaea.
- Biomethanation has strong potential for the production of energy from organic residues and wastes. It will help to reduce the use of fossil fuels and thus reduce CO(2) emission.
How it works?
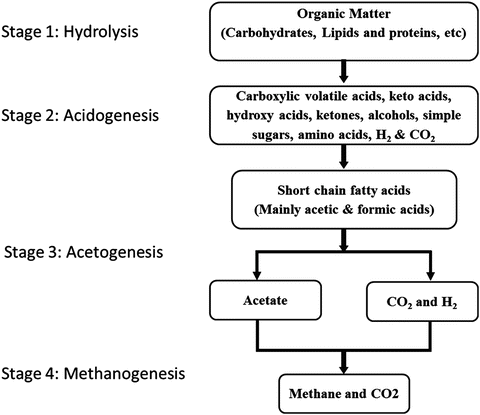
- Microorganisms degrade organic matter via cascades of biochemical conversions to methane and carbon dioxide.
- Syntrophic relationships between hydrogen producers (acetogens) and hydrogen scavengers (homoacetogens, hydrogenotrophic methanogens, etc.) are critical to the process.
- A wide variety of process applications for biomethanation of wastewaters, slurries, and solid waste have been developed.
- They utilize different reactor types and process conditions (retention times, loading rates, temperatures, etc.) in order to maximize the energy output from the waste and also to decrease retention time and enhance process stability.
Get an IAS/IPS ranker as your 1: 1 personal mentor for UPSC 2024
Air Pollution
World Air Quality Report, 2019
From UPSC perspective, the following things are important :
Prelims level: PM 2.5
Mains level: World Air Quality Report, 2019
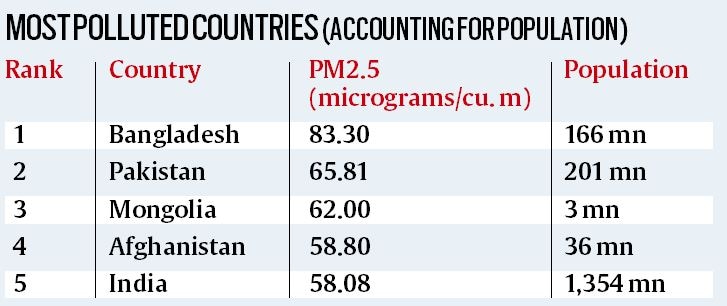
The 2019 World Air Quality Report was recently released
World Air Quality Report
- The World Air Quality Report is released by the pollution tracker IQAir and Greenpeace.
- The report focuses on PM2.5 as a representative measure of air pollution.
Highlights of the report
- India accounts for two-thirds of the world’s most polluted cities — 21 of the most polluted 30 cities; 14 of the highest 20; and 6 of the highest 10 — in the report.
- Among countries, when population is taken into account, average PM2.5 pollution is highest in Bangladesh, followed by Pakistan, while India is at number 5.
- China is at number 11 in the list of countries affected by population, with population factored in. Chinese cities achieved a 9% average decrease in PM2.5 levels in 2019.
- While cities in India, on average, exceed the WHO target for annual PM2.5 exposure by 500%, national air pollution decreased by 20% from 2018 to 2019, with 98% of cities experiencing improvements.
- It said 90% of the global population breathing unsafe air.
Top polluted Indian Cities
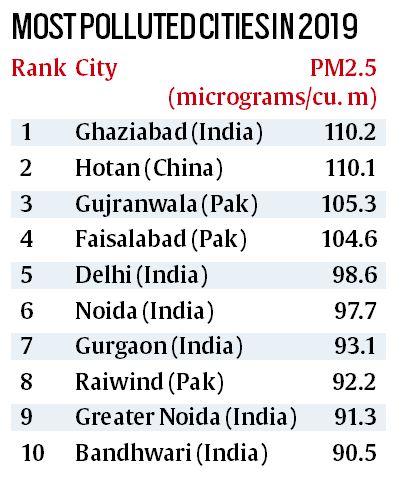
Back2Basics
PM 2.5

- PM 2.5 refers to particulate matter (ambient airborne particles) which measure up to 2.5 microns in size and has a range of chemical makeups and sources.
- It is widely regarded as the pollutant with the most health impact of all commonly measured air pollutants.
- Due to its small size PM2.5 is able to penetrate deep into the human respiratory system and from there to the entire body, causing a wide range of short- and long-term health effects.
- Particulate matter is also the pollutant group which affects the most people globally. It can come from a range of natural as well as man-made sources.
- Common sources of PM include combustion (from vehicle engines, industry, wood and coal burning), as well as through other pollutants reacting in the atmosphere.
Get an IAS/IPS ranker as your 1: 1 personal mentor for UPSC 2024
Air Pollution
Global cost of air pollution from fossil fuels
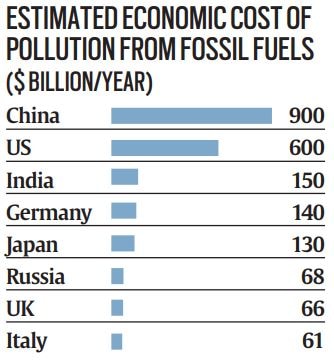
A new Greenpeace report has estimated the global cost of air pollution from fossil fuels at around $2.9 trillion per year, or $8 billion per day — 3.3% of the world’s GDP.
Cost of air pollution
India is estimated to bear a cost of $150 billion, or 5.4% of the country’s GDP, which is the third-highest absolute cost from fossil fuel air pollution worldwide.
China and the US are estimated to bear the highest absolute costs from fossil fuel air pollution, respectively at $900 billion and $600 billion.
Loss of lives
- Globally, air pollution is estimated to cause 4.5 million premature deaths each year.
- This includes 3 million deaths attributable globally to PM2.5, which is one of the principal pollutants in northern Indian cities including Delhi.
- Globally, PM2.5 is also estimated to cause the loss of 62.7 million years of life, 2.7 million emergency room visits due to asthma, 2 million preterm births and 1.75 billion work absences.
- The 2 million preterm births include 981,000 in India and over 350,000 in China.
Economic cost
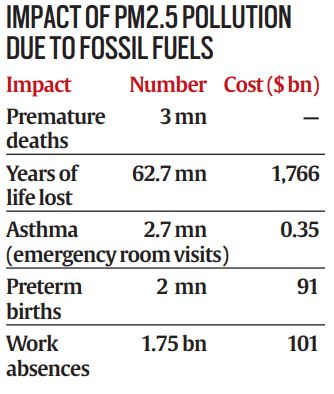
In India, exposure to fossil fuels also leads to a loss of around 490 million workdays, the report said.
Get an IAS/IPS ranker as your 1: 1 personal mentor for UPSC 2024
Air Pollution
IMO Sulphur regulations for Shipping
From UPSC perspective, the following things are important :
Prelims level: IMO, VLSFO
Mains level: SOx pollution control measures
The International Maritime Organization (IMO), the shipping agency of the United Nations issued new rules aiming to reduce sulphur emissions, due to which ships are opting for newer blends of fuels.
What do the new IMO rules say?
- The IMO has banned ships from using fuels with sulphur content above 0.5 per cent, compared with 3.5 per cent previously.
- Sulphur oxides (SOx), which are formed after combustion in engines, are known to cause respiratory symptoms and lung disease, while also leading to acid rain.
- The new regulations, called IMO 2020, have been regarded as the biggest shake up for the oil and shipping industries in decades. It affects more than 50,000 merchant ships worldwide.
- The new limits are monitored and enforced by national authorities of countries that are members of the International Convention for the Prevention of Pollution from Ships (MARPOL) Annex VI.
Cleaner options
- Under the new policy, only ships fitted with sulphur-cleaning devices, known as scrubbers, are allowed to continue burning high-sulphur fuel.
- Alternatively, Ships can opt for cleaner fuels, such as marine gasoil (MGO) and very low-sulfur fuel oil (VLSFO).
- Of the two cleaner fuels, ship-owners were expected to opt for MGO, which is made exclusively from distillates, and has low sulphur content.
- However, many are reportedly choosing VLSFO, which has better calorific properties and other technical advantages.
Issues with the rule
- There are complaints against VLSFO as well, as testing companies have claimed that high sediment formation due to the fuel’s use could damage vessel engines.
- VLSFO, with 0.5 per cent sulphur content, can contain a large percentage of aromatic compounds, thus having a direct impact on black carbon emissions.
- Black carbon, which is produced due to the incomplete combustion of carbon-based fuels, contributes to climate change.
Get an IAS/IPS ranker as your 1: 1 personal mentor for UPSC 2024
Air Pollution
Carbon Disclosure Project Report 2019
From UPSC perspective, the following things are important :
Prelims level: Carbon Disclosure Project
Mains level: India's various moves for curbing carbon emissions
The Carbon Disclosure Project (CDP) 2019 report was recently published.
Carbon Disclosure Project
- CDP is published by the Global Reporting Initiative.
- It is aimed at measuring the carbon reduction activities undertaken by different companies and firms operating in various countries across the globe.
- The report surveys corporate commitments to science-based targets (SBT) and evaluates the climate change risk that they are exposed to.
India’s performance
- India secured the 5th spot on the project report.
- The CDP Report 2019 said that a total of 58 companies shared details about the environment-related activities undertaken by them in this year.
- The report also claims that over 98 percent of top Indian companies have formed some type or committee or group within its organization to drive and address climate-related issues.
- The report also showcased the changing mind-set of India Inc with nearly all major companies setting up some form of oversight to evaluate climate risk.
Global scenario
- The US topped the annual CDP report with 135 companies disclosing their climate-related activities, followed by Japan in the second position with 83 companies and the UK in the third position with 78 countries.
- While France was placed fourth with 51 companies disclosing their details, India was placed fifth with 38 companies committing to the science-based targets.
- In 2018, India had only 25 companies committing to the SBTs.
- India is followed by Germany and Sweden with 30 and 27 companies respectively, while Switzerland and Spain had 23 and 22 companies respectively.
- Netherlands was listed 10th on the list with 18 companies committing to SBT initiatives.
Importance
- India was ranked 5th, ahead of Germany and Sweden.
- India is the first developing economy with a maximum number of companies committing to the science-based targets.
Get an IAS/IPS ranker as your 1: 1 personal mentor for UPSC 2024
Air Pollution
Smog Tower
From UPSC perspective, the following things are important :
Prelims level: Smog Tower, PM 2.5
Mains level: Curbing air pollution in Delhi

Recently New Delhi got its first smog tower (a prototype air purifier). In November, the Supreme Court had directed the Centre and the Delhi government to prepare a plan to install ‘smog towers’ across the capital to deal with air pollution.
What is a ‘Smog Tower’?
- Smog towers are structures designed to work as large-scale air purifiers.
- They are usually fitted with multiple layers of air filters, which clean the air of pollutants as it passes through them.
- The smog tower installed at Lajpat Nagar is capable of treating 6,00,000 cubic metres of air per day and can collect more than 75 per cent of particulate matters (PM) 2.5 and 10.
- After the cleaning, the tower releases clean air.
- The project is collaboration between the IIT Bombay, IIT-Delhi and the University of Minnesota, the latter having helped design a similar tower of over 100 metres in China’s Xi’an city.
- The Central Pollution Control Board (CPCB) will also be involved with the project.
How it works?
- The 20-metre (65 feet) high tower will trap particulate matter of all sizes suspended in the air.
- Large-scale air filters shall draw in the air through fans installed at the top before passing it through the filters and releasing it near the ground.
- The filters installed in the tower will use carbon nanofibres as a major component and will be fitted along its peripheries. The tower will focus on reducing particulate matter load.
Other examples in the world
- China, which has been battling air pollution for years, has two smog towers — in its capital Beijing and in the northern city of Xi’an.
- The Xi’an tower is dubbed the world’s largest, and has reportedly brought down PM 2.5 by 19% in an area of around 6 sq km in its vicinity.
- The 100-metre (328 feet) high tower has produced 10 million cubic metres of clean air every day since its launch.
- On severely polluted days the tower is able to bring down smog close to moderate levels.
Get an IAS/IPS ranker as your 1: 1 personal mentor for UPSC 2024
What PM2.5 Pollution Really Means and How Can Delhi Cope Up With This?
On the morning of 29 November, Beijing woke up to air pollution levels not seen in over a year. The city’s government immediately issued an alert and ordered factories to stop or reduce production.

The same morning, Delhi woke up to pollution levels much higher than Beijing’s.
And it hosted the Delhi half marathon.
In the name of health awareness, the runners breathed air laced with pollutants exponentially beyond safe levels. And they inhaled 10-20 times as much air as a sedentary person does.
In sharp contrast, the embassies of Norway and the United States have taken urgent steps to safeguard their personnel. While Norwegian officials are set to get “hardship pay” for working in New Delhi, the US embassy’s school has cancelled outdoor activities for its students.
The stark difference in attitudes, perhaps, is because most Delhiites know little about how exactly the city’s air is killing them. Slowly. Daily.
The government has largely failed to make people aware of how the pollution affects them, what the main pollutants are, what precautions they should take, the types of masks they should wear, and suchlike.
It only dumps air pollution data on a rather glib website, on a page full of numbers and technical terms befitting a chemistry textbook.
There is no air warning system in Delhi that could alert citizens, shut down schools and prohibit outdoor activity when pollution reaches hazardous levels.
Most of all, though, the residents should know what exactly makes Delhi’s air so toxic. Even if you know what it is – the toxin is called PM 2.5 – there is no easy way to know how harmful it is.
So, here’s a primer.
Why are we talking about PM2.5?
Delhi’s air is not polluted as much with poisonous gases as it’s with really tiny particles known as PM2.5. And its levels are consistently 16-20 times higher than the prescribed standard. At the time of the half marathon, it was 48 times the limit.
Greenpeace recently found that even inside Delhi’s classrooms, PM2.5 levels were 11 times the limit.
What is PM2.5?
PM stands for particulate matter, while the number refers to the size of the particles. So, PM2.5 is like extremely fine dust whose particles are just 2.5 microns wide — that’s thirty times smaller than the width of a human hair.
The tiny size makes it harder to prevent PM2.5 from getting into the body, making it deadlier.
What exactly is PM2.5 made up of?
There is no easy answer to this since the toxin is identified more by its size than what it contains. It could be a variety of solid or liquid chemicals.
According to the United States’ Environment Protection Agency, a PM2.5 particle, depending on where it’s emitted from, could contain compounds of any of these four materials:
Carbon – from cars, trucks, waste burning
Nitrate – from cars, trucks, thermal power generation
Sulphate – from thermal power generation
Crustal – suspended soil and metals
While individual particles obviously can’t be seen without special equipment, large amounts are visible as haze or smog.
Why is PM2.5 bad?
- Being tiny, these particles easily reach the lungs. From there, they can travel through the bloodstream and reach the heart.
- Long exposure to PM2.5 can worsen asthma and heart conditions. They also cause runny nose, sneezing and coughing.
- 5 coming from diesel vehicles contains carbon and is a carcinogenic.
- It can also cause other heart and lung diseases, or make them worse.
- It slow down development of lungs in children and can leave them with reduced lung function for the rest of their lives, according to the WHO.
- Illnesses caused by PM2.5 kill at least 3.1 million people a year across the world.
- The WHO estimates that exposure to PM2.5 reduces a person’s life expectancy by an average of 8.6 months.
How much of PM2.5 is safe?
The WHO says there is no safe level, PM2.5 is harmful in any amount. Still, there are standards on how much PM2.5 is too much.
As per the WHO’s own standards, the average PM2.5 levels should not exceed 10 mg per cubic metre in one year.
In one day, it should be under 25. Indian safety limits, however, are more relaxed – at 60.
WHO says PM2.5 level mustn’t exceed 25 mg/cubic metre. Yet, India has relaxed the limit to 60
What’s the best protection from PM2.5?
- Protecting yourself from PM2.5 doesn’t require gas masks, but cotton masks that can block very fine particles.
- It is recommended to use an N-95 mask, the same one used to protect against the H1N1 virus.
- Unfortunately, planting more trees does nothing to solve the problem.
- Since PM2.5 are particles and not gases, they can’t be processed by the leaves.
- In fact, a high tree density can make the exposure worse because the extra moisture in the air would trap the particles instead of letting them fly away with the wind.
- The only way to cut down PM2.5 levels is to stop it at the source – cars, factories, waste burning, thermal power plants. Until then, strap on the N-95s.
Only way to reduce PM2.5 is to stop it at source – cars, factories, waste burning, thermal plants
Source - CatchNews | Pic - Vox-cdn
Everything that you want to know on Delhi’s Odd-Even Policy
Delhi Government releases blueprint for Odd-Even formula December 25, 2015. In an attempt to curb alarming levels of pollution in the Indian capital, Delhi, authorities have announced that private cars with even and odd number plates will be allowed only on alternate days. Let’s see it in brief!

How will odd-even policy work out?
- The Odd-Even formula plan seeks to curb the number of vehicles plying in the national capital by limiting 4-wheelers on alternate days.
- Under it cars with licence plates ending in an odd number will ply on odd dates and those ending with an even number can run on even dates.
- This will be on a trial basis from 1 to 15 January, 2015.
- During this implementation, public transport including buses and the Metro will be run at high frequency.
- The government plans to run 6,000 more buses to accommodate those who can’t drive their cars.
Then, Who is exempted?
- The list of 20-plus exemptions from the restrictions include emergency vehicles, fire engines, ambulances, hospitals, hearses, prisons, VIPs, enforcement vehicles and defence ministry vehicles.
- Among VIPs, leaders of the opposition in the Lok Sabha and Rajya Sabha, Chief Ministers of states, Judges of the Supreme Court and high court and Lokayukta are exempt. <CM of Delhi is not exempted>
- CNG and electric vehicles are also exempt.
- Two-wheelers and vehicles driven by or occupied by handicapped persons and female drivers are also exempt.
So, Will it really help clean the Delhi air?
- The Centre for Science and Environment (CSE), has welcomed the “emergency action to reduce vehicle numbers on the road” but questioned the absurdity of exempting 2-wheelers, which account for more than 30% of air pollutants generated by the transport sector in Delhi, and women drivers.
- According to the scientists of the Delhi Pollution Control Committee (DPCC), 80 per cent of PM 2.5 air pollution is caused by vehicular traffic and reduction in its levels, even in outer areas of Delhi shows that reduction of four wheeled vehicles on roads.
- The latest set of ambient air data collected at 18 locations across Delhi through mobile dust samplers shows a consistent trend of declining levels of PM 2.5 air pollution levels.
- If we take 250-300 as an average, then there is a drop of 100 points in PM 2.5 levels. This means there is a drop in pollution by about 25 percent. [ Isn’t it great! ]

But, Where did the odd-even idea come from?
Car rationing has been tried in many countries around the world.
- Rationalisation of the movement of private vehicles has been adopted in many countries, starting with Sweden (Stockholm) and extending to other European countries.
- China (Beijing), Mexico and Colombia (Bogota) have also implemented such measures.
Let’s glance over some international experiments?
Beijing
- The city initiated the alternate day car driving restrictions just ahead of the 2008 Olympic Games and saw pollution levels drop by almost 20%.
- Currently, Beijing imposes this rule periodically, on days with high air pollution.
- The city has also restricted its car sales since 2011 to 20,000 car plates every month.
- However, they have made tremendous efforts to increase public transport such as bus connectivity and metro services. [ Lesson for Delhi ]
Paris, France
- The city has been imposing the odd-even number plate rule during periods of high air pollution. On such days, public transport is free.
- The rule was last implemented in March 2015 when a smog alert was issued.
Mexico
- The “Hoy No Circula” was introduced in Mexico around 1989 to combat air pollution.
- It called for citywide bans, one day per week, based on last digit of the number plates.
- For example, plates ending in 5 and 6 were not allowed to drive on Mondays while 7 and 8 were not allowed to drive on Tuesdays and so on.
- This measure was highly successful in bringing carbon monoxide (CO) levels down by almost 11%.
- However, in the long run, people eventually started buying more cars, rendering the ban inefficient. Therefore, it actually ended in a rise in CO levels in the long run by almost 13%.
Oh! Are these measures short-term?
- Yes, these examples show that the system has better potential as a short-term measure.
- It show that temporary restrictions on vehicles may not reduce air pollution in the long term.
- Drivers inevitably buy more cheap and inefficient cars with different number plates to get around the rules.
- Hence, such an initiative must be complemented by other measures to ensure that we have a stable system in the long run.
So, Are there any long-term measures available?
Centre for Science and Environment (CSE) has suggested some long-term measures –
- There is a need to impose restrictions on diesel vehicles to promote electric and alternative fuel vehicles.
- The electric vehicles should be exempted from any such alternate number plate restriction.
- The number plate measure needs to be combined with high parking charges and intensified public transport strategy. <This should be the strategy for the entire period of poor air quality as well as a long-term measure>
International Example
- Paris has set an example by deciding to phase out diesel cars completely by 2020.
- London is also planning to ban diesel cars despite having a fuel quality as high as Euro 6.
- China has already banned diesel cars on roads.India, on the other hand, is still juggling between BS-III and BS-IV norms. <With accepted ground reality, we can not directly implement BS-V/BS-VI in one go>
What Delhi can do more?
Immediately link and scale up metro, bus, autos, taxis-walk and cycle –
- This is needed immediately to connect doorsteps of people with their destinations for effortless movement without the car.
- Connect each and every neighbourhood with efficient and reliable public transport service.
Provide safe and barrier free walking and cycling infrastructure –
- Redesign roads and road network to give safe and priority infrastructure to walkers, cyclists and public transport users.
Adopt parking policy and taxation measures to restrain car usage –
- Currently, parking charges in Delhi are one of the lowest in the world.
- Limit legal parking areas across the city and demarcate them on the ground. Impose high penalty for illegal parking on public space.
- Impose higher taxes on cars for their congestion and pollution impacts. Use the revenue to build public transport.<Congestion tax can be a good case in this regard>
How will it affect automobile industry sector?
- Delhi’s odd-even decision will upset powerful automobile lobbies.
- The stakes for the car industry are too high in the capital, which is India’s biggest car market.
- The city has the largest population of registered motorised vehicles in the country, about 89 lakh as on March 31, 2015.
- Of them, 26 lakh are cars, 28 lakh motorcycles and 27 lakh scooters.
- In comparison, the number of commercial vehicles like taxis, buses and three-wheelers is about 3.5 lakh.
- The national capital region (NCR) accounts for 12% of car sales in India and is the biggest car market in the country.
- The temporary ban, according to reported estimates, will prevent 12,000 new diesel cars from coming on the Delhi roads.
So, the Odd-Even vehicle formula restriction is a good initiative, it is only a start. To control congestion, reduce pollution and improve liveability, there must be a comprehensive strategy in Delhi.
At national level, how odd-even policy will affect Make in India programme? Critically analyse.