💥UPSC 2026, 2027, 2028 UAP Mentorship (March Batch) + Access XFactor Notes & Microthemes PDF

Type: DOMR

  • Disasters and Disaster Management – Sendai Framework, Floods, Cyclones, etc.

    Extreme weather events in India

    Note4Students

    From UPSC perspective, the following things are important:

    Prelims level: NA

    Mains level: Extreme weather events in India and their mitigation

    Nineteen extreme weather events in 2019 claimed 1,357 lives, with heavy rain and flood accounting for 63 per cent of these deaths, revealed Down To Earth’s State of India’s Environment 2020 report.

    Extreme weather events:

    • Extreme weather events are out of the ordinary, unexpected, unusual climatic events which wreak havoc and disrupt everyday life.
    • Over the years, the frequency of extreme weather events has increased due to global warming and climate change.
    • Extreme weather events include hailstorm, heatwaves, dust storm, cloud bursts etc.

    Try this question:

    Q. Extreme weather events have been the biggest catastrophe in India this year. Discuss.

    Data from this newscard can be used to substantiate your mains answer with relevant data.

    Loss of lives

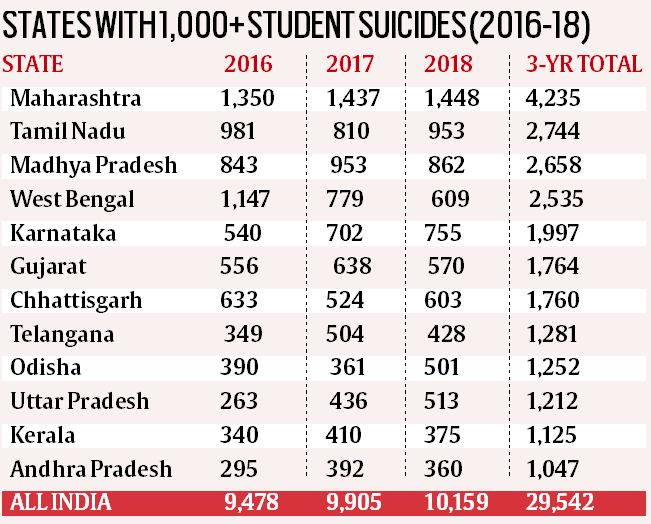
    • The most lives were lost in Bihar, with people dying from floods and heavy rain (306), thunderstorms (71) and heatwave (292) between May and October.
    • In Maharashtra, 136 people died from floods and heavy rain, 51 died from lightning and 44 died from the heatwave between June and September.
    • There was a 69 per cent increase in the number of heatwave days between 2013 and 2019 as well, the report said.
    • Over 5,300 people died from heatwaves in the past seven years.
    • Cold waves increased by 69 per cent within a year, between 2017 and 2018, with the latter year reported having an extremely cold winter, with the most casualties (279) in the past seven years.

    Risks of Extreme weather events in India

    • Climate change related risks will increasingly affect the Indian subcontinent, including via sea level rise, cyclonic activity and changes in temperature and precipitation patterns.
    • Rising sea levels would submerge low-lying islands and coastal lands and contaminate coastal freshwater reserves.Climate change will increase the risks of death, injury and ill-health and disrupt livelihoods in low-lying coastal zones due to cyclones and coastal and inland flooding, storm surges and sea-level rise.
    • Melting Himalayan glaciers would reduce downstream water supply in many of India’s important rivers in the dry season, impacting millions
    • A warmer atmosphere will spread tropical diseases and pests to new areas.
    • Increased river, coastal and urban floods could cause considerable loss of life and widespread damage to property, infrastructure and settlements.
    • Erratic rainfall in parts of India could lower rice yields and lead to higher food prices and living costs, while increased drought related water and food shortages linked to rising and extreme temperatures may increase malnutrition and worsen rural poverty. Over 55% of Indian rural households depend on agriculture for a living and, with fisheries and forestry,

    Systems in place to tackle extreme weather events are as follows:

    1.Meteorological predictions

    2.Contingency fund

    3.Early warning to citizens

    4.NDMA has issued an action plan for Prevention and Management of Heat Waves.

    5.Remote sensing satellites.

    Problems with accurate meteorological predictions are as follows:

    1.Meteorological predictions are considered for broad geographical areas and timeframes. It is not yet possible to predict a thunderstorm or lightning at a village or a part of a city.

    2.The exact times these events will hit, too, cannot be predicted.

    3.Alerts and warnings are in the nature of a general advisory, telling the people to expect these events, and to take precautions

    Steps taken by the State government are as follows:

    1.Rajasthan:

    • storm has been included in the category of natural disasters for the first time in the State and funds to the tune of ₹2.55 crore have been sanctioned to the affected districts.
    • The next of kin of each deceased in Rajasthan will get financial assistance of ₹4 lakh from the Chief Minister’s Relief Fund.
    • Power discoms have launched action on a war-footing to restore electricity supply in the affected areas, while the administration has ordered a survey of damaged properties.
    • In Dholpur district, relief camps have been opened for the villagers whose houses were destroyed.

    2.Uttar Pradesh:

    • The Uttar Pradesh Chief Minister has announced a compensation of up to Rs 400,000 to the families of the deceased and Rs 50,000 for each of the injured in the heavy rainfall and storm across the state.
    • contingency funds have been released to the respective district administration.
  • FDI in Indian economy

    Foreign direct investment (FDI) in India

    Note4Students

    From UPSC perspective, the following things are important:

    Prelims level: FDI

    Mains level: Features of India's FDI Policy

    The FDI in India grew by 13% to a record of $49.97 billion in the 2019-20 financial years, according to official data.

    Get aware with the recently updated FDI norms. Key facts mentioned in this newscard can make a direct statement based MCQ in the prelims.

    Ex. FDI source in decreasing order: Singapore – Mauritius – Netherland – Ceyman Islands – Japan – France

    Data on FDI

    • The country had received an FDI of $44.36 billion during April-March 2018-19.
    • The sectors which attracted maximum foreign inflows during 2019-20 include services ($7.85 billion), computer software and hardware ($7.67 billion), telecommunications ($4.44 billion), trading ($4.57 billion), automobile ($2.82 billion), construction ($2 billion), and chemicals ($1 billion).
    • Singapore emerged as the largest source of FDI in India during the last fiscal with $14.67 billion investments.
    • It was followed by Mauritius ($8.24 billion), the Netherlands ($6.5 billion), the U.S. ($4.22 billion), Caymen Islands ($3.7 billion), Japan ($3.22 billion), and France ($1.89 billion).

    What is FDI?

    • An FDI is an investment in the form of a controlling ownership in a business in one country by an entity based in another country.
    • It is thus distinguished from a foreign portfolio investment by a notion of direct control.
    • FDI may be made either “inorganically” by buying a company in the target country or “organically” by expanding the operations of an existing business in that country.
    • Broadly, FDI includes “mergers and acquisitions, building new facilities, reinvesting profits earned from overseas operations, and intra company loans”.
    • In a narrow sense, it refers just to building a new facility, and lasting management interest.

    FDI in India

    • Foreign investment was introduced in 1991 under Foreign Exchange Management Act (FEMA), driven by then FM Manmohan Singh.
    • There are two routes by which India gets FDI.

    1) Automatic route: By this route, FDI is allowed without prior approval by Government or RBI.

    2) Government route: Prior approval by the government is needed via this route. The application needs to be made through Foreign Investment Facilitation Portal, which will facilitate the single-window clearance of FDI application under Approval Route.

    • India imposes a cap on equity holding by foreign investors in various sectors, current FDI in aviation and insurance sectors is limited to a maximum of 49%.
    • In 2015 India overtook China and the US as the top destination for the Foreign Direct Investment.

    Back2Basics

    Amendment in the FDI Policy for curbing opportunistic takeovers/acquisitions of Indian companies

  • Swachh Bharat Mission

    [pib] Star Ratings of Garbage Free Cities

    Note4Students

    From UPSC perspective, the following things are important:

    Prelims level: Star Ratings of Garbage Free Cities

    Mains level: Success of SBM

    The Ministry of Housing and Urban Affairs (MoHUA) has released the Star rating of garbage-free cities for the assessment year 2019-2020.

    Practice question for mains:

    Q. Discuss how the Swachh Bharat Mission has become a people’s movement in India. Also, discuss how it has managed to instill a behavioural change amongst the citizens.

    About Star Rating Protocol

    • The Star Rating Protocol was launched by the MoHUA in January 2018 to institutionalize a mechanism for cities to achieve Garbage Free status and to motivate cities to achieve higher degrees of cleanliness.
    • The protocol has been devised in a holistic manner including components such as the cleanliness of drains & water bodies, plastic waste management, managing construction & demolition waste, etc.
    • While the key thrust of this protocol is on Solid waste management(SWM), it also takes care of ensuring certain minimum standards of sanitation through a set of prerequisites defined in the framework.
    • The new protocol considers ward-wise geo-mapping, monitoring of SWM value chain through ICT interventions like Swachh Nagar App and zone-wise rating in cities with a population above 50 lakh.

    Performance of cities

    • Accordingly, as per the 2020 survey, 6 cities have been graded 5 stars, 65 Cities rated 3 Star and 70 Cities rated 1 Star.

    5 Star Cities

    ULB Name State Final Rating
    Ambikapur Chhattisgarh 5 Star
    Rajkot Gujarat 5 Star
    Surat Gujarat 5 Star
    Mysore Karnataka 5 Star
    Indore Madhya Pradesh 5 Star
    Navi Mumbai Maharashtra 5 Star

    Assessment under the protocol

    • To ensure that the Protocol has a SMART framework, the MoHUA has developed a three-stage assessment process.
    • In the first stage, ULBs populate their progress data on the portal along with supporting documents within a particular timeframe.
    • The second stage involves a desktop assessment by a third-party agency selected and appointed by MoHUA.
    • Claims of cities that clear the desktop assessment are then verified through independent field-level observations in the third stage.

    Significance

    • This certification is an acknowledgement of the clean status of Urban Local Bodies and strengthened SWM systems as well as a mark of trust and reliability akin to universally known standards.

    Back2Basics: Swachh Bharat Mission (SBM)

    • SBM is a nation-wide campaign in India for the period 2014 to 2019 that aims to clean up the streets, roads and infrastructure of India’s cities, towns, urban and rural areas.
    • The objectives of Swachh Bharat include eliminating open defecation through the construction of household-owned and community-owned toilets and establishing an accountable mechanism of monitoring toilet use.
    • Run by the GoI, the mission aims to achieve an “open-defecation free” (ODF) India by 2 October 2019, the 150th anniversary of the birth of Mahatma Gandhi by constructing 90 million toilets in rural India.
    • The mission will also contribute to India reaching Sustainable Development Goal 6 (SDG 6), established by the UN in 2015.
    • It is India’s largest cleanliness drive to date with three million government employees and students from all parts of India participating in 4,043 cities, towns, and rural areas.
    • The mission has two thrusts: Swachh Bharat Abhiyan (“gramin” or ‘rural’), which operates under the Ministry of Drinking Water and Sanitation; and Swachh Bharat Abhiyan (‘urban’), which operates under the Ministry of Housing and Urban Affairs.
  • What is the Sample Registration System (SRS)?

    Note4Students

    From UPSC perspective, the following things are important:

    Prelims level: SRS, IMR

    Mains level: Not Much

    The Registrar General of India released its Sample Registration System (SRS) bulletin based on data collected for 2018.

    Since we are talking about birth rates and death rates, how about revising Demographic Transition Model. Can you recall 4 distinctive stages of Indian Demographic history?

    Sample Registration System (SRS)

    • The SRS is a demographic survey for providing reliable annual estimates of infant mortality rate, birth rate, death rate and other fertility and mortality indicators at the national and sub-national levels.
    • Initiated on a pilot basis by the Registrar General of India in a few states in 1964-65, it became fully operational during 1969-70.
    • The field investigation consists of a continuous enumeration of births and deaths in selected sample units by resident part-time enumerators, generally Anganwadi workers and teachers; and an independent retrospective survey every six months by SRS supervisors.
    • The data obtained by these two independent functionaries are matched.

    Highlights of the data

    Birth and death rates

    • According to the data released the national birth rate in 2018 stood at 20, and death and infant mortality rates stood at 6.2 and 32, respectively.
    • The rates are calculated per one thousand of the population.
    • Madhya Pradesh has the worst infant mortality rate in the country while Nagaland has the best.
    • Chhattisgarh has the highest death rate, while Delhi has the lowest.
    • Bihar continues to remain at the top of the list in the birth rate while Andaman and Nicobar are at the bottom.

    Infant mortality

    • The data shows that against the national infant mortality rate (IMR) of 32, Madhya Pradesh has an IMR of 48 and Nagaland 4.
    • Bihar has the highest birth rate at 26.2 and Andaman and Nicobar Islands has a birth rate of 11.2.
    • Chhattisgarh has the highest death rate at 8 and Delhi, an almost entirely urban state, has a rate of 3.3, indicating better healthcare facilities.
    • As far as IMR is concerned, the present figure of 32 is about one-fourth as compared to 1971 (129).
    • In the last 10 years, IMR has witnessed a decline of about 35 per cent in rural areas and about 32 per cent in urban areas. T

    Birth rate

    • The birth rate is a crude measure of fertility of a population and a crucial determinant of population growth.
    • India’s birth rate has declined drastically over the last four decades from 36.9 in 1971 to 20.0 in 2018.
    • The rural-urban differential has also narrowed. However, the birth rate has continued to be higher in rural areas compared to urban areas in the last four decades.
    • There has been about an 11 per cent decline in the birth rate in the last decade, from 22.5 in 2009 to 20.0 in 2018. The corresponding decline in rural areas is 24.1 to 21.6, and in urban areas, it is 18.3 to 16.7.
  • Electoral Reforms In India

    Donation to Political Parties from unknown sources

    Note4Students

    From UPSC perspective, the following things are important:

    Prelims level: Not Much

    Mains level: Political funding in India


    As much as 67% of donations to national parties in 2018-19 came from “unknown sources,” an increase from 53% in the previous financial year, said a report released by the Association for Democratic Reforms.

    About ADR

    • The Association for Democratic Reforms (ADR) is an Indian non-partisan, non-governmental organization which works in the area of electoral and political reforms.
    • Along with National Election Watch (NEW), ADR is striving to bring transparency and accountability in Indian politics and reducing the influence of money and muscle power in elections.
    • The ambit and scope of work in this field are enormous, hence, ADR has chosen to concentrate its efforts in the following areas pertaining to the political system of the country:
    1. Corruption and Criminalization in the Political Process
    2. Empowerment of the electorate through greater dissemination of information relating to the candidates and the parties, for a better and informed choice
    3. Need for greater accountability of Indian Political Parties
    4. Need for inner-party democracy and transparency in party-functioning

    income sources of Political Parties

    • The total income of the parties was ₹3,749.37 crore, of which ₹951.66 crore was from known donors.
    • Electoral bonds accounted for 78% of the ₹2,512.98 crore, or 67%, income from unknown sources.
    • While parties are required to give details of all donations above ₹20,000, donations under ₹20,000 and those via electoral bonds remain anonymous.
    • Out of the total income from unknown sources, 64% went to the BJP and 29% to Congress.
  • Students Suicides in India

    Note4Students

    From UPSC perspective, the following things are important:

    Prelims level: Not Much

    Mains level: Suicides in India


    Between 2016 and 2018, nearly 10,000 students committed suicide every year in India, data tabled by the Human Resource Development Ministry in Parliament show.

    About the Report

    • HRD Ministry sourced its data from ‘Accidental Deaths and Suicides in India’.
    • The report is based on data provided by the states and UTs.

    Highlights of the Report

    • Maharashtra accounted for 1 in every 7 student suicides in the country — 4,235 out of 29,542 in the three years combined, or about 1,400 a year.
    • Maharashtra had over 1,300 student suicides in each of the three years, while West Bengal was the only other state with over 1,000 in any single year — 1,147 in 2016.
    • In the overall three-year totals, Maharashtra was followed by Tamil Nadu (2,744), Madhya Pradesh (2,658) and West Bengal (2,535).
    • Eight more states totalled over 1,000 student suicides in the three years, with Karnataka the highest among these at almost 2,000.
    • Among the Union Territories, Delhi had 626 student suicides — 211, 212 and 203 in the three successive years.
  • Wildlife Conservation Efforts

    State of India’s Birds 2020 (SoIB) Assessment

    Note4Students

    From UPSC perspective, the following things are important:

    Prelims level: Various species mentioned

    Mains level: Highlights of the report


    State of India’s Birds 2020 (SoIB) assessment was recently released.

    Highlights of the report


    • The SoIB was produced using a base of 867 species (among 1,333 birds ever recorded in India), and analysed with the help of data uploaded by birdwatchers to the online platform, eBird.
    • Adequate data on how birds fared over a period of over 25 years (long-term trend) are available only for 261 species.
    • Current annual trends are calculated over a five-year period.

    Alarming declines

    • The SoIB assessment raises the alarm that several spectacular birds, many of them endemic to the sub-continent, face a growing threat from loss of habitat due to human activity, widespread presence of toxins including pesticides, hunting and trapping for the pet trade.
    • Diminishing population sizes of many birds because of one factor brings them closer to extinction because of the accelerated effects of others, the report warned.
    • Over a fifth of India’s bird diversity, ranging from the Short-toed Snake Eagle to the Sirkeer Malkoha, has suffered strong long-term declines over a 25-year period.
    • More recent annual trends point to a drastic 80% loss among several common birds.

    Various species mentioned

    • Of 101 species categorised as being of High Conservation Concern — 59 based on range and abundance and the rest included from high-risk birds on the IUCN Red List.
    • Endemics such as the Rufous-fronted Prinia, Nilgiri Thrush, Nilgiri Pipit and Indian vulture were confirmed as suffering current decline.
    • And all except 13 had a restricted or highly restricted range, indicating greater vulnerability to man-made threats.
    • Peafowl, on the other hand, are rising in numbers, expanding their range into places such as Kerala, which is drying overall, and areas in the Thar desert where canals and irrigation have been introduced. Stricter protection for peacocks under law also could be at work.
  • Climate Change Impact on India and World – International Reports, Key Observations, etc.

    ‘Future of Earth, 2020’ Report

    Note4Students

    From UPSC perspective, the following things are important:

    Prelims level: Highlights of the report

    Mains level: Various global threats and their mitigation


    The “The Future of Earth, 2020” Report was recently released.

    About the report

    • The report is released by the South Asia Future Earth Regional Office, Divecha Centre for Climate Change, Indian Institute of Science.
    • The report was prepared with the aim of reducing carbon footprint and halting global warming below 2 degree Celsius by 2050.

    Highlights of the report

    • Five global risks that have the potential to impact and amplify one another in ways that may cascade to create global systemic crisis have been listed by report.
    • It listed the following as five global risks:
    1. failure of climate change mitigation and adaptation
    2. extreme weather events
    3. major biodiversity loss and ecosystem collapse
    4. food crises; and
    5. water crises
    • Offering examples of how the interrelation of risk factors play a role, scientists say extreme heatwaves can accelerate global warming by releasing large amounts of stored carbon from affected ecosystems, and at the same time intensify water crises and/ or food scarcity.
    • The loss of biodiversity also weakens the capacity of natural and agricultural systems to cope with climate extremes, increasing our vulnerability to food crises, they point out.
  • Water Management – Institutional Reforms, Conservation Efforts, etc.

    Arsenic Contamination

    Note4Students

    From UPSC perspective, the following things are important:

    Prelims level: Arsenic poisoning and its effects on food chain

    Mains level: Groundwater contamination

    As the geography of arsenic contamination spreads, there is an urgent need for governments to reorient mitigation measures. That’s because the focus till now has only been on drinking water, but new research says arsenic has contaminated our food chain.

    Arsenic contamination of water

    • Arsenic contamination in groundwater is one of the most crippling issues in the drinking water scenario of India.
    • According to the latest report of the Central Ground Water Board (CGWB), 21 states across the country have pockets with arsenic levels higher than the BIS stipulated permissible limit of 0.01 milligram per litre (mg/l).
    • The states along the Ganga-Brahmaputra-Meghna (GBM) river basin — Uttar Pradesh, Bihar, Jharkhand, West Bengal and Assam — are the worst affected by this human-amplified geogenic occurrence.
    • In India, arsenic contamination was first officially confirmed in West Bengal in 1983.
    • Close to four decades after its detection, the scenario has worsened.
    • About 9.6 million people in West Bengal, 1.6 million in Assam, 1.2 million in Bihar, 0.5 million in Uttar Pradesh and 0.013 million in Jharkhand are at immediate risk from arsenic contamination in groundwater.

    Effects of arsenic poisoning

    • Long-term exposure to arsenic in drinking water can cause cancer in the skin, lungs, bladder and kidney. It can also cause other skin changes such as thickening and pigmentation.
    • The likelihood of effects is related to the level of exposure to arsenic and in areas where drinking water is heavily contaminated, these effects can be seen in many individuals in the population.
    • Increased risks of lung and bladder cancer and skin changes have been reported in people ingesting arsenic in drinking water at concentrations of 50 µg/litre, or even lower.

    Affecting food

    • Recent research says arsenic contamination in groundwater has penetrated the food chain.
    • It eventually causes photo-accumulation of arsenic in the food crops, especially in the leaves, can emanate from contaminated water sprayed on them.
    • Yet the focus remained on drinking water, and the affected regions became the primary stake-holder in the mitigation approach.

    Way forward

    • Mitigation measures — that are currently focused on drinking water — must have a more comprehensive approach to ensure arsenic-free water for drinking and agricultural products.
    • That means that the government must check for arsenic in water used for agricultural produce.
    • Both the Union and state governments must work toward facilitating research that can investigate the accumulation of arsenic in crops and addressing the agricultural concerns of the affected regions.
    • They must watch out for arsenic percolation in the food chain and the possibilities of biomagnification.
    • The government needs to also conduct a larger study on the arsenic contamination of our food chain and its health impacts to understand its spatial spread through the agricultural supply chain.
  • Urban Transformation – Smart Cities, AMRUT, etc.

    [pib] Ease of Living Index and Municipal Performance Index 2019

    Note4Students

    From UPSC perspective, the following things are important:

    Prelims level: Ease of Living Index and Municipal Performance Index

    Mains level: Urban development

    The surveys to determine the Ease of Living Index (EoLI) and Municipal Performance Index (MPI) 2019 has been initiated by the Ministry of Housing & Urban Affairs. Both these indices are designed to assess the quality of life of citizens in 100 Smart Cities and 14 other Million Plus Cities.

    Municipal Performance Index

    • With the MPI 2019, the Ministry has sought to assess the performance of municipalities based on five enablers namely Service, Finance, Planning, Technology and Governance.
    • These have been further divided into 20 sectors which will be evaluated across 100 indicators.
    • This will help Municipalities in better planning and management, filling the gaps in city administration, and improving the liveability of cities for its citizens.

    Ease of Living Index

    • EOLI is aimed at providing a holistic view of Indian cities – beginning from the services provided by local bodies, the effectiveness of the administration, the outcomes generated through these services in terms of the liveability within cities and, finally, the citizen perception of these outcomes.
    • The key objectives of the EOL Index are four-folds, viz.
    1. Generate information to guide evidence-based policy making;
    2. Catalyse action to achieve broader developmental outcomes including the SDG;
    3. Assess and compare the outcomes achieved from various urban policies and schemes; and
    4. Obtain the perception of citizens about their view of the services provided by the city administration.
    • For the first time, as part of the EOLI Assessment, a Citizen Perception Survey is being conducted on behalf of the Ministry (which carries 30% of the marks of the Ease of Living Index).
    • This is a very important component of the assessment exercise as it will help in directly capturing perception of citizens with respect to quality of life in their cities.
    • This survey, which is being administered both online and offline, has commenced from 1st February 2020 and will continue till 29th February 2020.
    • The offline version involving face-to-face interviews will commence on the 1st of February and will run parallel to the on-line versions.