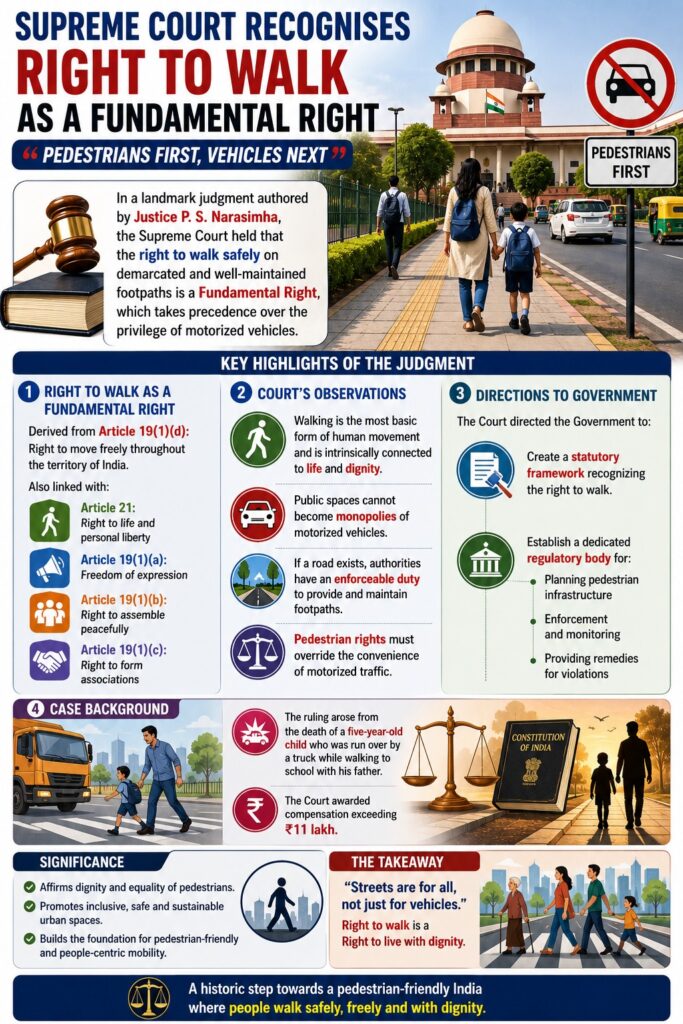
💥UPSC 2027,2028 Mentorship (May Batch) + Access XFactor Notes & Microthemes PDF

Archives: News

  • Human Rights Issues

    Disabled-Friendly Prisons — Supreme Court Directions (2026) 

    Why in the News?

    • The Supreme Court of India directed a high-powered committee to prepare a comprehensive plan for disabled-friendly prisons across India.
    • Issue highlighted: Inhumane conditions faced by disabled prisoners

    Key Supreme Court Observations

    • Rights of disabled prisoners must be protected under:
      • Article 14 → Equality before law
      • Article 21 → Right to life and dignity
    • Incarceration should not dilute fundamental rights

    Key Directions of the Court

    1. Comprehensive Action Plan

    • Create uniform standards across India

    2. Accessibility Measures

    • Provide:
      • Assistive devices
      • Mobility aids
      • Special infrastructure

    3. Medical & Social Support

    • Ensure:
      • Specialized medical care
      • Enhanced visitation rights

    4. Procurement & Maintenance

    • Define:
      • Procurement mechanisms
      • Maintenance protocols
      • Security safeguards

    5. Monitoring

    • Committee to submit report in: 4 months
    [2023] Q. Consider the following statements: 
    Statement-1: In India, prisons are managed State Governments with their own rules and regulations for the day-to-day administration of prisons. 
    Statement-II: In India, prisons are governed by the Prisons Act, 1894 which expressly kept the subject of prisons in the control of Provincial Governments. 
    Which one of the following is correct in respect of the above statements? 
    [A] Both Statement-I and Statement-II are correct and Statement-II is the correct explanation for Statement-1 
    [B] Both Statement-1 and Statement-II are correct and Statement-II is not the correct explanation for Statement-1 
    [C] Statement-1 1s correct but Statement-11 is incorrect 
    [D] Statement-1 Is incorrect but Statement-II is correct
  • Primary and Secondary Education – RTE, Education Policy, SEQI, RMSA, Committee Reports, etc.

    [21st April 2026] The Hindu OpED: The puzzle of missing urgency around learning

    PYQ Relevance[UPSC 2023] The crucial aspect of the development process has been the inadequate attention paid to Human Resource Development in India. Suggest measures that can address this adequacy.
    Linkage: The PYQ directly links to the learning crisis and poor foundational literacy (FLN) as core human resource deficits affecting productivity. It highlights policy-outcome gaps and weak learning outcomes, aligning with issues of accountability, governance, and quality of education discussed in the article.

    Why in the News?

    Recent ASER findings continue to show that a significant proportion of Grade 5 students cannot read Grade 2 texts, despite flagship initiatives like NEP 2020 and NIPUN Bharat. This highlights a persistent learning crisis with low urgency and weak outcomes, even after increased policy focus and funding, making it a critical governance concern.

    What does the Annual Status of Education Report (ASER) data reveal?

    The Annual Status of Education Report (ASER) 2024 confirms your observation, showing that 51.2% of Grade 5 students still cannot read a basic Grade 2 level text, meaning only 48.8% possess this foundational skill. While this represents a modest recovery from 42.8% in 2022, it remains below the 50.5% recorded in 2018, highlighting a “learning crisis” that persists despite the NIPUN Bharat Mission and NEP 2020.

    Key Learning Deficits (ASER 2024)

    1. Reading Gaps: 76.6% of Grade 3 students cannot read Grade 2 text, indicating that many children fall behind early and never catch up.
    2. Arithmetic Stagnation: Only 30.7% of Grade 5 students can perform basic division, a skill typically expected by Grade 3 or 4.
    3. Long-term Deficits: Even by Grade 8, approximately 32.5% of students still struggle to read Grade 2 level texts.

    Why does a severe learning crisis fail to generate urgency?

    1. Salience Deficit (Low Visibility): Unlike building toilets or classrooms, learning deficits are invisible and intangible, making it easier for administrators to overlook them.
    2. Policy-Implementation Gap: NEP 2020 and NIPUN Bharat emphasize Foundational Literacy and Numeracy (FLN) but fail to translate into field-level urgency.
    3. Outcome Invisibility: Learning deficits remain intangible compared to visible infrastructure gaps like buildings or toilets.

    How does international experience highlight the importance of salience?

    1. Vietnam Model: Achieves high learning outcomes despite limited resources.
    2. RISE Programme Findings: Demonstrates that intent (“wanting to improve learning”) drives outcomes more than funding.
      1. Research on Improving Systems of Education (RISE): This is a large-scale, multi-country research programme aimed at understanding how education systems in developing countries can overcome the “learning crisis.”
    3. Comparative Insight: India’s weak field-level salience contrasts with Vietnam’s strong societal focus on learning.

    What structural factors weaken accountability in learning outcomes?

    1. Power Asymmetry: Teachers and administrators dominate decision-making; children and parents lack voice.
      1. Dominance of Professionals: Teachers and administrators frequently use their “professional status” as a barrier against parental feedback or perceived interference.
      2. Disenfranchisement of Vulnerable Groups: Parents from low socioeconomic backgrounds or with low educational attainment may feel they lack the language or skills to challenge school personnel.
      3. Lack of Downward Accountability: When power is concentrated at the top, the system excels at financial reporting (upward accountability) but often ignores the interests and needs of students.
    2. Centralization: Limited role of local institutions reduces bottom-up accountability.
      1. Limited Local Role: Local institutions often have little authority to adapt curriculum or management to fit specific student needs.
      2. Slow Responsiveness: Decisions made by distant central authorities can be slow to reach the ground level, especially in emergencies or urgent local situations.
      3. Reduced Bottom-Up Pressure: Without effective decentralization, there is less incentive for local stakeholders to demand better outcomes, as they lack the power to implement changes.
    3. Middle-Class Exit: For a “self-serving middle class” that has secured its own children’s education in private institutions, the quality of government schools often becomes a low-priority, non-marketable issue.
    4. Institutional Weakness: Local governance bodies, such as School Management Committees (SMCs), are often designed to oversee schools but face significant operational hurdles.
      1. Lack of Awareness and Training: Members often lack the necessary training or awareness of their roles and powers to effectively hold school administrations accountable.

    Why is the scale of the crisis under-recognized?

    The scale of the learning crisis often remains hidden because it is a “silent” emergency. Unlike a crumbling bridge or a food shortage, a child sitting in a classroom who cannot read is not immediately visible to the naked eye.

    1. Perception Gap: Even officials underestimate the extent of poor learning.
    2. ASER Data: Shows significant proportion of children lacking basic reading ability.
    3. The “Illusion of Improvement“: Statistical gains can mask the remaining deficit. For example, if reading levels improve from 20% to 65%, the focus is usually on the 45% gain. However, this hides the alarming reality that 35% of children, more than one in three, are still being left behind with no basic literacy.
    4. Cognitive Bias: Learning deficits appear exaggerated due to lack of direct visibility.

    How do systemic and sociocultural factors distort responsibility for learning?

    1. State as a Provider of “Schooling“: Governments often view their responsibility as fulfilled once inputs, such as buildings, teachers, and textbooks, are provided.
    2. Learning as a “Child Property”: When students fail to learn, it is often framed as a deficit within the child (e.g., lack of “natural ability” or “weak students”) or their background, rather than a failure of the teaching process.
    3. Neglect of Systemic Factors: Pedagogy, curriculum design, teacher support overlooked.
      1. Pedagogical and Curricular Mismatch: Many systems utilize a “one-size-fits-all” curriculum that is too fast-paced for the average student, yet responsibility for this “over-ambitious” design is rarely addressed.
    4. Political Economy Constraints: Acknowledging crisis carries political risk.
      1. Resource Misallocation: Predatory elites may use education systems for patronage (e.g., job distribution) rather than for improving learning outcomes, as maintaining the status quo is often safer than disruptive reform. 
    5. Professional Resistance: Educators reluctant to accept systemic failure.
      1. “Survival Mode”: Teachers burdened by high pupil-teacher ratios or excessive administrative tasks often prioritize basic compliance over the complex, discretionary work required to improve actual learning.

    What role does visibility and measurement play in improving learning outcomes?

    1. Assessment Systems: Large-scale assessments bring learning outcomes into policy discourse.
    2. Local Evaluations: Village-level assessments make learning deficits visible.
    3. Behavioral Impact: Direct observation creates urgency among parents and officials.
    4. Evidence-Based Reform: Data-driven approaches strengthen accountability.

    What strategies can build salience and improve foundational learning?

    1. Teaching at the Right Level (TaRL): Aligns teaching with student ability.
    2. Structured Pedagogy: Standardizes teaching methods for measurable outcomes.
    3. Outcome Communication: Public dissemination of learning data.
    4. Administrative Incentives: Links performance to learning outcomes.
    5. Decentralization: Empowers local governance for accountability.

    Conclusion

    India’s learning crisis is not due to lack of policy or funding but due to lack of urgency and accountability. Making learning visible, measurable, and socially prioritized is essential for systemic reform.

  • The Crisis In The Middle East

    The strategic vulnerability in India’s LPG supply model

    Why in the News?

    India’s LPG vulnerability has come into focus due to heightened geopolitical risks in the Strait of Hormuz, a corridor handling ~90% of India’s LPG imports. Unlike earlier assumptions of stable supply, the crisis highlights a shift from routine dependence to strategic vulnerability. The issue is significant because LPG is not an industrial input but a household necessity, meaning disruptions directly affect millions of kitchens.

    Why does India’s LPG demand structure increase vulnerability?

    While India has achieved high, clean-cooking access, this success has created a “just-in-time” supply model that is fragile during global disruptions.

    1. Household Dependence: LPG is primarily used for cooking; commercial use <10%, leaving limited flexibility to reduce demand during crisis.
    2. Rigid Consumption Pattern: Household kitchens cannot switch fuels easily, ensuring inelastic demand.
    3. Mismatch in Production vs Consumption: LPG demand at 250% of domestic production, indicating structural dependence.

    How does import concentration amplify supply risk?

    1. Import Dependence: Approximately 60% LPG is imported, reflecting high external reliance.
    2. Geographical Concentration: Around 90% imports pass through the Strait of Hormuz, creating a single choke-point risk.
    3. Global Market Constraint: Exportable LPG pool is limited and pre-committed, reducing diversion flexibility.

    Why is India’s LPG storage capacity inadequate?

    1. Low Strategic Reserves: While India is the world’s second-largest LPG consumer, its strategic underground storage is limited to roughly 140,000 tonnes (60 TMT at Vizag and 80 TMT at Mangalore), covering only about 1.5 to 2 days of national consumption
    2. Insufficient Buffer Target: Proposed 2-3 weeks buffer of about 1.3-1.9 MMT, far above current capacity.
    3. Operational Fragility: Limited reserves reduce crisis response capability and increase exposure to supply shocks.

    How does India compare with other major LPG consumers?

    1. Japan’s Model(High Resilience):
      1. 108.3 days storage, ensuring strong resilience
      2. LPG covers only about 40% households, lowering dependency
    2. China’s Model(Flexible Demand): China is the world’s largest consumer, but its demand is driven heavily by the petrochemical sector, not solely residential cooking.
    3. South Korea’s Model(Diversified Portfolio): South Korea utilizes a robust mix of city gas and electricity, reducing its reliance on LPG for residential heating and cooking. It also maintains substantial storage capacity (50-60 days)
    4. India’s Position(Maximum Vulnerability): High household dependence combined with low storage, resulting in maximum vulnerability

    Why is treating LPG as a unified pool problematic?

    Treating LPG as a unified pool means managing the entire supply of Liquid Petroleum Gas, whether domestically produced or imported, as a single, undifferentiated resource that simultaneously feeds household cooking, commercial establishments (hotels, restaurants), and industrial users (petrochemical plants). 

    1. Demand-Supply Mismatch: A single LPG pool serves households, petrochemicals, and industry simultaneously.
    2. Asymmetric Demand: While demand for household cooking is inflexible (people cannot stop cooking), demand from industrial sectors is often flexible (plants can slow down or switch fuel).
    3. The Pool Dilemma: When the “single pool” faces shortages, the supply chain cannot easily differentiate between a family needing gas to cook and a factory needing it for production. This causes widespread supply anxiety and long waiting periods
    4. Shortage Management: During recent supply shortages, the government was forced to ration supplies to commercial and industrial users, causing a 48% drop in supply to those sectors to keep household supplies running. 
    5. Critical Sector Exposure: Household demand competes with industrial demand, increasing supply risk.
    6. Policy Gap: Lack of prioritization mechanisms weakens energy security planning.

    What structural reforms are required to reduce vulnerability?

    Structural reforms to reduce vulnerability in the liquefied petroleum gas (LPG) sector require a strategic shift from relying on a single, imported fuel to building a resilient, diversified energy ecosystem. Based on current policy discussions and supply chain issues, key structural reforms include: 

    1. Demand Segmentation: Separates household LPG from industrial consumption, ensuring protected supply.
    2. Targeted Subsidies: Reforming the subsidy structure to use Direct Benefit Transfer (DBT) specifically for vulnerable households, while allowing commercial prices to reflect market realities to prevent diversion. 
    3. Underground Caverns: Investing in deep underground rock cavern storage, like those in Visakhapatnam and Mangalore, to provide safe, high-volume, long-term strategic reserves.
    4. Fuel diversification
      1. Promoting Alternatives: Actively promoting electric cooking (induction stoves) and Piped Natural Gas (PNG) to reduce structural dependence on LPG cylinders.
      2. Biogas Integration: Developing community-level, family-scale biogas plants, utilizing organic waste to provide an alternative, local clean fuel source. 
    5. Import Diversification:
      1. Reducing Gulf Dependence: Actively expanding LPG sourcing beyond the Persian Gulf to reduce risks associated with geopolitical chokepoints like the Strait of Hormuz.
      2. Long-Term Contracts: Securing long-term contracts from alternative suppliers (e.g., US-sourced LPG), with a target to bring down Middle East import concentration below 70%.

    Conclusion

    India’s LPG vulnerability is structural, driven by high household dependence, concentrated imports, and weak storage capacity. Strengthening resilience requires segmented demand management, diversified supply sources, expanded storage infrastructure, and gradual transition to alternative cooking fuels.

    PYQ Relevance

    [UPSC 2022] Do you think India will meet 50 percent of its energy needs from renewable energy by 2030? Justify your answer. How will the shift of subsidies from fossil fuels to renewables help achieve the above objectives? Explain.

    Linkage: The PYQ highlights the need for reducing fossil fuel dependence like LPG, addressing import vulnerability and energy insecurity. It supports transition towards renewables and subsidy shift, aligning with long-term structural solutions to India’s LPG supply risks.

  • Climate Change Impact on India and World – International Reports, Key Observations, etc.

    Marine Spatial Plan: Odisha’s bid to strengthen climate resilience

    Why in the News?

    Odisha has signed an MoU with the National Centre for Coastal Research (NCCR) to implement a Marine Spatial Plan (MSP), making it one of the first Indian states to operationalize integrated ocean planning at a state scale. This is significant as coastal management in India has traditionally been sectoral (fisheries, ports, tourism) and reactive.

    What is Marine Spatial Planning (MSP) and why is it relevant?

    1. According to UNESCO, Marine Spatial Planning (MSP) is a public process of analyzing and allocating the spatial and temporal distribution of human activities in marine areas to achieve ecological, economic and social objectives that have been specified through a political process.
    2. It is a tool for sustainable and integrated ocean management aimed at boosting the blue economy and strengthening climate resilience. 
    3. It helps for sustainable utilisation of marine resources in energy, economic activities like developing ports, harbours, setting up industries, environment, fisheries, aquaculture and tourism and to formulate policies accordingly.
    4. It aligns with UNESCO-IOC guidelines for sustainable ocean management.
    5. Intergovernmental Oceanographic Commission
    6. Indian Context: Extends India-Norway collaboration on ocean management initiated in 2019.

    Why does Odisha require MSP at this stage?

    Odisha requires Marine Spatial Planning (MSP) at this stage, launched in April 2026 as the first state in India to enter the second phase of the India-Norway Sustainable Ocean Planning initiative. It was launched to balance intense developmental pressures with environmental conservation along its 574-km coastline. The planning is essential to resolve conflicts between economic activities (ports, tourism, fisheries) and the protection of ecologically sensitive habitats.

    1. Extensive Coastline: Covers 550+ km, including ecologically sensitive zones like lagoons and mangroves.
    2. Development Pressures: Increasing industrial, tourism, and port activities create resource conflicts.
    3. Biodiversity Significance: Coastal ecosystems support livelihoods and ecological balance.
    4. Climate Vulnerability: Frequent cyclones and rising sea levels necessitate adaptive planning.
    5. Data Gaps: Requires scientific mapping of salinity, temperature, and ecosystem components.

    How does MSP function as a governance mechanism?

    Marine Spatial Planning (MSP) functions as a governance mechanism by providing a public, data-driven process that integrates multiple maritime sectors (e.g., energy, fishing, shipping) to map, allocate, and manage ocean space sustainably. It reduces conflicts, creates efficiencies, protects ecosystems, and enables collaborative decision-making across jurisdictions

    1. Spatial Allocation: Identifies zones for fishing, tourism, conservation, and infrastructure.
    2. Scientific Mapping: Studies water parameters (salinity, temperature) to guide activity suitability.
    3. Conflict Resolution: Reduces sectoral conflicts through predefined spatial use.
    4. Policy Integration: Links economic policies with environmental safeguards.
    5. Stakeholder Coordination: Engages multiple sectors and coastal communities.

    What are the expected economic and ecological outcomes?

    1. Blue Economy Expansion: Enhances fisheries, tourism, and ocean energy sectors.
    2. Ecosystem Protection: Preserves mangroves, seagrasses, and marine biodiversity.
    3. Livelihood Security: Supports coastal populations dependent on marine resources.
    4. Efficient Resource Use: Ensures optimal allocation without ecological degradation.
    5. Long-term Sustainability: Maintains ecosystem health alongside economic growth.

    What complementary initiatives strengthen MSP in Odisha?

    1. OMBRIC Initiative: The Odisha Marine Biotechnology Research and Innovation Corridor (OMBRIC) supports marine biotechnology for environmental protection and economic use.
    2. Biotechnology Integration: OMBRIC involves seven leading research institutions, including IIT Bhubaneswar, NIT Rourkela, and ILS Bhubaneswar.  These focus on mapping marine bioresources, cultivating unculturable microorganisms for industrial enzymes, and breeding Indian horseshoe crabs.
    3. Tourism and Livelihood Linkages: Develops eco-tourism and scientific tourism models.
      1. It includes the development of an oceanarium and water sports along the Puri-Konark marine drive. 
      2. It also includes a “Million Mangroves by 2030” initiative to empower local fisherfolk and women-led groups through nature-based solutions.
    4. Policy Ecosystem: The initiative aligns with India’s Vision 2047, focusing on technology-driven resource management for climate-resilient growth. Key partnerships include the National Institute of Ocean Technology (NIOT) and the Odisha Marine Bio Resource Atlas project to publish data on marine life.

    Conclusion

    Odisha’s MSP represents a transition toward integrated, science-driven marine governance. It enhances climate resilience while supporting economic activities. Its success can provide a model for other coastal states in India.

    PYQ Relevance

    [UPSC 2023] Explain the causes and effects of coastal erosion in India. What are the available coastal management techniques for combating the hazard?

    Linkage: Marine Spatial Planning (MSP) acts as a preventive mitigation tool by regulating coastal activities and reducing erosion, habitat loss, and ecosystem degradation. It complements coastal management techniques through scientific zoning and ecosystem-based adaptation, strengthening long-term climate mitigation and resilience.

  • The Crisis In The Middle East

    Strait of Hormuz Crisis & Gulf Pipeline Strategy 

    Why in the News?

    • The ongoing West Asia conflict has exposed the vulnerability of the Strait of Hormuz, prompting Gulf countries to build alternative energy routes.

    Strait of Hormuz  

    • Located between: Iran and Oman
    • Connects: Persian Gulf to Arabian Sea
    • Handles: About 20% of global oil and LNG trade

    What Happened

    • Conflict led to: Severe disruption of shipping
    • Demonstrated: Iran’s ability to block the chokepoint
    • Triggered: Global energy concerns

    Why It Matters

    1. Global Energy Security

    • Disruption affects: Oil supply and LNG supply
    • Leads to: Price spikes

    2. Strategic Vulnerability

    • Overdependence on a single chokepoint
    • Risk to global supply chains

    Gulf Countries’ Response

    1. Pipeline Expansion

    • Aim: Bypass Hormuz
    • Reduce maritime dependence

    2. Port Diversification

    • Increase exports via the Red Sea, Gulf of Oman, and Mediterranean routes

    3. Regional Cooperation

    • Even rival countries: Collaborating for energy security

    Key Pipelines (Important)

    Operational

    • Saudi East–West Pipeline: From Persian Gulf to Red Sea (Yanbu)
    • Abu Dhabi Crude Oil Pipeline (ADCOP): From Habshan to Fujairah (bypasses Hormuz)

    Potential / Revival Projects

    • Iraq–Turkey Pipeline (Kirkuk–Ceyhan)
    • Basra–Aqaba Pipeline (Iraq–Jordan)
    • Iraqi Pipeline through Saudi Arabia (IPSA)
    • Trans-Arabian Pipeline
    [2024] Consider the following statements: 
    Statement-I Sumed pipeline is a strategic route for Persian Gulf oil and Natural gas shipments to Europe. 
    Statement-II: Sumed pipeline connects the Red Sea with the Mediterranean Sea. 
    Which one of the following is correct in respect of the above statements? 
    [A] Both Statement-I and Statement-II are correct and Statement-II explains Statement-I [B] Both Statement-I and Statement-II are correct, but Statement-II does not explain Statement-I [C] Statement-I is correct, but Statement-II is incorrect [D] Statement-I is incorrect, but Statement-II is correct
    [2018] Consider the following pairs : Towns sometimes mentioned in news Country 
    1. Aleppo: Syria 
    2. Kirkuk: Yemen 
    3. Mosul: Palestine 
    4. Mazar-i-sharif: Afghanistan 
    Which of the pairs given above are correctly matched? 
    [A] 1 and 2 [B] 1 and 4 [C] 2 and3 [D] 3 and 4
  • Banking Sector Reforms

    SBI Targets 25% of India’s GDP Balance Sheet

    Why in the News?

    • State Bank of India (SBI) aims to expand its balance sheet to 25% of India’s GDP by 2030 (from ~20% currently).

    What is a Bank’s Balance Sheet

    • A balance sheet shows: Liabilities + Capital = Assets

    Components

    1. Liabilities

    • Deposits
    • Borrowings
    • Other obligations

    2. Capital

    • Tier I capital
    • Tier II capital
    • Reserves

    3. Assets

    • Loans and advances
    • Investments
    • Cash balances (including with Reserve Bank of India)
    [2018] With reference to the governance of public sector banking in India, consider the following statements:
    1. Capital infusion into public sector banks by the Government of India has steadily increased in the last decade.
    2. To put the public sector banks in order, the merger of associate banks with the parent State Bank of India has been affected. 
    Which of the statements given above is/are correct?
    (a) 1 only(b) 2 only(c) Both 1 and 2(d) Neither 1 nor 2
    [2015] With reference to ‘Basel III Accord’, sometimes seen in the news, which of the following statements is/are correct?
    1. It strives to improve the banking sector’s ability to deal with financial and economic stress and improve risk management.
    2. It aims at making the banks more capital-intensive. 
    Select the correct answer:
    (a) 1 only(b) 2 only(c) Both 1 and 2(d) Neither 1 nor 2

  • Biofuel Policy

    Ethanol 85 (E85) Fuel

    Why in the News?

    • Government likely to notify draft rules for E85 fuel rollout as part of alternative fuel strategy and energy security push.

    What is E85 Fuel

    • Fuel blend containing:
      • Up to 85% ethanol
      • About 15% petrol

    Current Context

    • India already implemented: E20 fuel (20% ethanol blending) nationwide (April 2026)
    • E85 will be: A separate fuel category

    Key Features of E85

    • High ethanol concentration
    • Requires:
      • Special engines (flex-fuel vehicles)
      • Dedicated fuel infrastructure

    Raw Materials for Ethanol

    • Produced from: Sugarcane, Maize, and Other grains
    • Renewable and domestically available

    Benefits of E85

    • Energy Security: Reduces dependence on crude oil imports
    • Environmental Benefits: Cleaner burning than petrol and Reduces vehicular emissions
    • Economic Benefits: Supports: Farmers and Biofuel industry

    Back2Basics

    GenerationSource MaterialContext for India
    1st Gen (1G)Edible crops (Sugarcane, Maize, Rice).Currently used for E20; raises “Food Security” concerns.
    2nd Gen (2G)Non-edible waste (Rice straw, Corn cobs, Wood chips).Promoted under PM JI-VAN Yojana to stop stubble burning.
    3rd Gen (3G)Micro-organisms like Algae.High yield, doesn’t require agricultural land.
    4th Gen (4G)Genetically modified (GM) crops.Focuses on Carbon Capture and Storage (CCS) while growing.
    [2020] According to India’s National Policy on Biofuels, which of the following can be used as raw materials for the production of biofuels?  
    1. Cassava
    2. Damaged wheat
    3. grains
    4. Groundnut seeds
    5. Horse gram
    6. Rotten potatoes
    7. Sugar beet 
    Select the correct answer using the code given below:
    (a) 1, 2, 5 and 6 only(b) 1, 3, 4 and 6 only(c) 2, 3, 4 and 5 only(d) 1, 2, 3, 4, 5 and 6
  • Forest Conservation Efforts – NFP, Western Ghats, etc.

    India’s Forest Carbon Storage Could Double

    Why in the News

    • A study published in Environmental Research: Climate suggests that India’s forests could nearly double carbon storage by 2100 under current emission trends.

    Key Findings

    • Vegetation carbon increase:
      • 35 percent under low emissions
      • 62 percent under medium emissions
      • 97 percent under high emissions
    • Growth pattern:
      • Similar till about 2030
      • Rapid increase after 2050

    Key Drivers

    1. Increased Rainfall

    • More moisture availability
    • Enhances vegetation growth

    2. Higher Atmospheric CO2

    • Improves photosynthesis
    • Increases water-use efficiency

    3. Time Lag Effect

    • Forest response is delayed:
      • About 2 years (low and medium emissions)
      • About 4 years (high emissions)

    Regional Trends

    Highest Increase

    • Desert and semi-arid regions: Rajasthan, Gujarat, and Western Madhya Pradesh

    Moderate Increase

    • Trans-Himalayas
    • Gangetic plains
    • Deccan Plateau

    Lower Increase

    • Western Ghats
    • Himalayas

    Reason:

    • Ecological saturation
    • Climatic limitations

    Important Institution

    • Forest Survey of India: Official body for forest and tree cover data. 
    Consider the following statements: (2019)
    1. As per the Law, the Compensatory Afforestation Fund Management and Planning Authority (CAMPA) exists at both National and State levels.
    2. People’s participation is mandatory in the compensatory afforestation programmes carried out under the Compensatory Afforestation Fund Act, 2016. 
    Which of the statements given above is/are correct?
    (a) 1 only(b) 2 only(c) Both 1 and 2(d) Neither 1 nor 2
    In the context of mitigating the impending global warming due to anthropogenic emissions of carbon dioxide, which of the following can be potential sites for carbon sequestration? (2017)
    1. Abandoned and uneconomic coal seams.
    2. Depleted oil and gas reservoirs.Subterranean deep saline formations. 
    Select the correct answer using the code given below:
    (a) 1 and 2 only(b) 3 only(c) 1 and 3 only(d) 1, 2 and 3
  • The Crisis In The Middle East

    “Yellow Line” Strategy (Israel)  

    Why in the News?

    • Israel has extended its “Yellow Line” buffer zone strategy from the Gaza Strip to southern Lebanon during ongoing conflict dynamics.

    What is the “Yellow Line”

    • A military demarcation and deployment boundary
    • Divides territory into:
      • Israeli-controlled zone
      • Local (Palestinian/Lebanese) areas
    • Marked physically by:
      • Concrete bollards
      • Tall poles at regular intervals

    Origin

    • First introduced in: October 2025 (Gaza conflict)
    • Later extended to: Southern Lebanon
    [2018] The term “two-state solution” is sometimes mentioned in the news in the context of the affairs of: 
    (a) China 
    (b) Israel 
    (c) Iraq 
    (d) Yemen
  • Poverty Eradication – Definition, Debates, etc.

    [20th April 2026] The Hindu OpED: Differentiating welfare and development

    PYQ Relevance[UPSC 2023] “Development and welfare schemes for the vulnerable, by its nature, are discriminatory in approach.” Do you agree? Give reasons for your answer.
    Linkage: The PYQ targets GS-2 (Social Justice) and tests understanding of welfare vs development, equity vs equality, and policy design for vulnerable groups. It links directly to Capability Approach, justifies “discrimination” as equity-driven targeting to expand real freedoms and reduce capability deprivation.

    Mentor’s Comment

    There is rising competitive populism across Indian states, where free electricity, loan waivers, and cash transfers are increasingly shaping electoral outcomes. This marks a sharp shift from earlier development-led narratives focused on infrastructure and growth. The concern is significant because such policies risk straining public finances while failing to build long-term economic capacity. The debate is critical as India aims for sustained high growth while managing inequality and welfare demands.

    What is Welfare and Development with respect to political landscape in India?

    Welfare in the Political Landscape: Welfare involves state intervention to ensure the economic and social well-being of citizens, particularly the vulnerable. It is about redistribution and social security. 

    1. Scholarly Definition: A welfare state is a government that takes “key role in the protection and promotion of economic and social well-being of its citizens,” based on “equality of opportunity” and “equitable distribution of wealth“. According to T.H. Marshall (1950), it is a synthesis of democracy, welfare, and capitalism.

    Indian Context & Examples:

    1. Food Security: The Targeted Public Distribution System (TPDS) and the National Food Security Act, 2013, supply subsidized food grains to low-income families.
    2. Employment Guarantee: The MGNREGA provides a legal right to 100 days of wage employment in rural areas.
    3. Health Security: Free or subsidized health insurance programs (like the Ayushman Bharat scheme).
    4. Social Safety Net: Old age pensions and subsidies for cooking fuel (Ujjwala Yojana). 

    Development in the Political Landscape

    Development denotes a broader, long-term process of structural transformation involving sustained economic growth, improved productivity, and expanded human capabilities. 

    1. Scholarly Definition: Development is “the process of growth, or changing from one condition to another,” which aims to “improve the quality of life” through infrastructure, education, and modern technologies. It is a process that “expands human capabilities and freedoms,” shifting the focus from just GDP growth to human-centric improvements.

    Indian Context & Examples:

    1. Infrastructure: The construction of national highways, metro rail networks in cities, and rural road connectivity.
    2. Financial Inclusion & Technology: The implementation of Aadhaar and the JAN-DHAN accounts to facilitate direct benefit transfers.
    3. Digital Transformation: Schemes promoting internet connectivity in villages and digitalization of government services.
    4. Education: The National Education Policy (NEP) 2020 aiming for universal access and improved learning outcomes. 

    Why is there a conceptual confusion between welfare and development?

    Conceptual confusion between welfare and development persists because, while they differ fundamentally in purpose and time horizon, they are often conflated in political, academic, and practical settings, especially in democratic contexts. 

    1. Political Conflation (Populism vs. Growth): Political actors often blur the distinction to achieve immediate electoral gains.
      1. Narrative Shift: “Development” is frequently used as a slogan to signal structural growth, but it is often replaced in practice by welfare schemes that offer immediate, tangible benefits to voters.
      2. Patron-Client Politics: Welfare schemes (e.g., cash transfers, subsidies) are often designed as “freebies” that create a patron-client relationship, where voters view the government as a benefactor rather than an agent of structural transformation.
      3. Thin Line Between Freebies and Growth: Political campaigns, particularly in India (e.g., in Andhra Pradesh or West Bengal), often promise high-end infrastructure (development) alongside extensive subsidies (welfare), treating them as the same goal
    2. Overlap in Practice: In policy implementation, the boundaries between the two are frequently blurred.
      1. Simultaneous Implementation: Governments often run large-scale social protection programs alongside aggressive infrastructure development, making them difficult for the public to differentiate.
      2. Developmental Welfare: Certain welfare schemes can serve a development purpose. For instance, nutrition support (welfare) or job guarantees (MGNREGA) can build human capital or community assets (development), making it hard to classify them strictly as one or the other.
      3. The “Dependent” Trap: When welfare focuses purely on consumption (handouts) rather than capacity building, it can lead to “dependency,” where beneficiaries lack the motivation or skills to become independent, thus hindering long-term development. 
    3. Time Horizon Difference: Welfare operates in short-term consumption space, while development unfolds over decades through structural change.
      1. Short-Term vs. Long-Term: Welfare operates in the immediate consumption space (e.g., food security, basic income), aiming to alleviate immediate poverty. Development unfolds over decades through structural change, increased productivity, and enhanced human capabilities.
      2. Consumption vs. Production: Welfare is often about distributing existing resources (redistribution), while development focuses on expanding the total “economic pie” through investment and infrastructure. 

    In summary, the confusion arises when populist, short-term welfare promises are packaged and marketed as long-term development strategies. This creates a scenario where immediate social protection is mistaken for structural economic transformation.

    How do welfare and development differ in objectives and outcomes?

    1. Welfare Orientation: Ensures immediate relief through redistribution; includes food security, income support, and access to basic services.
    2. Development Orientation: Ensures sustained economic growth, productivity, and institutional strengthening over time.
    3. Outcome Nature: Welfare produces short-term consumption gains; development generates durable capacity expansion.
    4. Capability Enhancement: Welfare reduces vulnerability; development expands human capabilities (education, health, skills).

    Why can excessive welfare distort development outcomes?

    1. Fiscal Constraints: Expands subsidy burden, limiting capital expenditure on infrastructure and public goods.
      1. In India, several states have seen their fiscal space shrink, with committed expenditures (salaries, pensions, interest, and subsidies) consuming over 80% of revenue receipts, leaving very little for developmental capital spending. In 2021-22, Punjab spent over 25% of its revenue expenditure on explicit subsidies
    2. Crowding Out Effect: Reduces investment in productive sectors due to excessive redistribution.
      1. Example: If the government heavily funds food or energy subsidies (e.g., agricultural electricity subsidies), it crowds out private investment in more efficient, technology-driven sectors. 
    3. Incentive Distortion: Weakens work incentives and productivity if poorly designed.
      1. Example: The PM-Kisan scheme in India costs over ₹63,500 crore annually. Critics argue it acts as a “sop” that keeps people in low-productivity subsistence farming rather than encouraging the structural transformation of labor towards higher-productivity urban sectors
    4. Leakages and Exclusion: Poor targeting leads to inefficiencies and reduced impact.
      1. Example: Studies on Public Distribution Systems (PDS) in India have historically shown significant leakages (sometimes up to 30% or more), where subsidized grains intended for the poor are diverted to the open market. Similarly, free electricity often disproportionately benefits wealthier farmers who have land and pump sets, rather than landless laborers. 

    Why is development inherently a long-term structural process?

    1. Incremental Transformation: Involves gradual changes in economic structures, governance, and institutions.
    2. Institutional Capacity: Strengthens rules, norms, and administrative systems over time.
    3. Human Capital Formation: Requires sustained investments in education, health, and technology adoption.
    4. Capability Approach: Expands freedoms and opportunities, as emphasized in development theory.
    Capability ApproachDefinition: Defines development as expansion of human freedoms and choices, not just income growth.Focus: Prioritises capabilities (real opportunities) over mere resources.Key Concepts:Capabilities vs Functionings:Capabilities: Potential opportunities (e.g., ability to be educated)Functionings: Achieved outcomes (e.g., being educated)Beyond GDP: Measures development through quality of life and choices, not just economic output.Conversion Factors: Recognises variation in how individuals convert resources into outcomes due to social, personal, environmental factorsCore Pillars:Human Agency: Individuals as active agents, not passive beneficiariesEquity: Equal access to opportunitiesFreedom Expansion: Removal of constraints (poverty, ill-health, exclusion)

    What are the dangers of welfare populism?

    1. Short-Termism: Prioritises electoral gains over economic capacity building.
    2. Fiscal Stress: Leads to unsustainable public debt and deficits.
    3. Consumption Bias: Encourages immediate consumption instead of productive investment.
    4. Substitution Effect: Replaces development policies with populist transfers rather than complementing them.

    Can welfare and development be complementary?

    1. Well-Designed Welfare: Enhances human capital; e.g., nutrition, employment guarantees.
    2. Capability Enhancement: Supports productivity by reducing vulnerability.
    3. Inclusive Growth: Ensures that growth benefits are widely shared.
    4. Policy Integration: Aligns welfare schemes with long-term development goals.

    Conclusion

    The policy challenge lies not in choosing between welfare and development but in designing a coherent framework where welfare complements structural transformation. Sustainable development requires balancing immediate relief with long-term capacity creation.

Join the Community

Join us across Social Media platforms.