💥Join UPSC 2027,2028 Mentorship (August Batch) + XFactor Notes & Microthemes PDF

Type: Explained

These Newscards correspond to the explained section of various newspapers. They become immensely important for both prelims and mains and special attention needs to be paid to them

  • Sanae Takaichi’s visit: What India and Japan can do to boost their business ties 

    Why in the News?

    Japanese Prime Minister Sanae Takaichi’s visit has renewed attention on India-Japan business ties. The visit exposes a gap between the two countries’ strong strategic partnership and a narrow, underperforming business relationship. Only 1,500 Japanese companies operate in India against 6,000 in Thailand; 1% of them generate over half the business.

    Why does India-Japan’s business relationship underperform despite a flourishing strategic partnership?

    1. Company presence gap: India hosts about 1,500 Japanese companies. Thailand hosts 6,000.
    2. Business concentration: Just 1% of Japan’s firms in India generate over half of all India-Japan business.
    3. Sectoral narrowness: Most of this business comes from one sector, automobiles. Suzuki Motor Corporation’s early entry in the 1980s built this base.
    4. Partnership-business mismatch: The bilateral strategic partnership is strong. The business relationship remains narrow and concentrated.

    What does the contrast between Japanese and Western MNC practices in India reveal about the real barrier to attracting Indian talent?

    1. Leadership exclusion: Indians almost never head the India operations of Japanese multinationals. Global leadership roles remain closed to them.
    2. Western contrast: Western multinationals have recruited top Indian talent for decades. They offer the same career opportunities as any other employee.
    3. Merit-based promotion: Western firms promote Indian staff using globally-benchmarked merit. They deploy this talent worldwide.
    4. Compliance over capability: Japanese firms base local hiring decisions on a compliant attitude. They prioritise this over the capability needed to win in a competitive market.
    5. Talent attraction failure: This practice causes Japanese companies to rarely attract quality Indian talent. Reform within Japanese corporations is the stated solution.

    Why is Japanese corporate engagement with India changing now?

    1. Rising commitment volume: More Japanese companies than ever are now working to do business in India.
    2. Stability driver: Indian economic growth remains steady amid global challenges. India offers relative stability in an uncertain world.
    3. Staff quality shift: A small number of top Japanese corporations now send their most capable staff to explore Indian opportunities. This marks a shift from earlier practice.
    4. Sectoral diversification: New investment has moved into real estate, technology startups and steelmaking, beyond the traditional automobile base.
    5. Political momentum: Prime Minister Sanae Takaichi has brought support to Indo-Japanese clean energy partnerships. Results from these efforts will show in the coming years.

    What must Japanese firms do differently to succeed in India?

    1. Localise offerings: Success in India requires products and services suited to Indian conditions, priced competitively and produced at scale. Maruti Suzuki and Reliance’s Jio telecom service illustrate this approach.
    2. Avoid rigid transplantation: Firms that insist on traditional Japanese methods for product design or customer response speed lose out to more nimble competitors, including Indian ones.
    3. Build Indo-Japanese teams: Perseverance and resilience remain necessary but insufficient. Firms need adaptability and strong joint Indo-Japanese teams.
    4. Move beyond the China playbook: Many Japanese corporations expect India to ‘package’ inputs the way China does, ready industrial plots, contractors, trained workers, vendor bases and seamless logistics. India does not yet offer this readiness.
    5. Reform local hiring: Local hiring decisions should target the capability needed to win in a competitive market, not a compliant attitude.
    6. Empower local management: Success requires challenging entrenched cost structures, fixing inefficient business processes, and pushing Tokyo-based mid-level managers outside their comfort zone.

    What must Indian companies and institutions do to deepen ties with Japan?

    1. Deepen investor support: Governments and industry bodies already market India to Japan. Deeper, more active support for first-time Japanese investors in select sectors is needed.
    2. Build support structures: Partnerships using all available capabilities, not government agencies alone, should create structures that deliver results on the ground.
    3. Establish Japan presence: Corporate India rarely maintains an office or even a part-time local advisor in Tokyo, even among its biggest firms.
    4. Close the understanding gap: This absence creates a lack of understanding of the Japanese mindset and of how business can be developed in Japan.
    5. Move beyond old models: Indian companies still seek old-fashioned collaborations or technology transfers in exchange for market access through bureaucratic navigation.
    6. Reframe India’s value: This transactional approach undersells India’s image, achievements and potential.

    What ultimately earns Japanese trust and investment beyond profit calculations?

    1. Behaviour over profit: Japanese firms weigh the people they will work with more heavily than the prospect of high profit or growth.
    2. Trust markers: Listening, developing shared understanding, honouring commitments, and letting achievements speak are the behaviours Japanese firms respect.
    3. Reciprocal opportunity: Indian corporations can bring their products and services to Japan, or jointly to third countries.
    4. R&D partnership potential: Partnerships with Japanese firms can strengthen Indian firms’ research and development and other capabilities.
    5. R&D spend gap: Japanese firms spend over 4% of revenue on research and development on average. Indian firms spend under 1%.
    6. Structural implication: This gap explains why Japan remains a top global economy despite a smaller population and fewer natural resources than India.

    Conclusion

    India-Japan business ties remain shallow relative to a strong strategic partnership. Japanese corporations rarely give Indian staff global leadership roles. Indian firms still seek market access through old-style technology transfers rather than sustained engagement. Closing this gap needs talent reform inside Japanese corporations and trust-based strategic engagement from Indian firms in Japan.

    PYQ Relevance

    [UPSC 2019] The time has come for India and Japan to build a strong contemporary relationship, one involving global and strategic partnership that will have a great significance for Asia and the world as a whole.’ Comment.

    Linkage: The PYQ tests India’s bilateral relations with Japan, focusing on the strategic, economic and Indo-Pacific dimensions of the partnership. The article argues that the next phase of the India-Japan partnership should be driven by stronger business, investment, technology and private-sector collaboration, complementing the existing strategic relationship.

  • How temples deal with donations

    Why in the News?

    Allegations of embezzlement of offerings and donations at the Ram Janmabhoomi Temple in Ayodhya have brought temple donation-handling systems under scrutiny. The episode has revealed that the Ram Temple trust operates without the statutory audit and oversight structures that govern India’s other major temples. The Ram Temple Construction Committee has sought a professional CEO while the Vishwa Hindu Parishad has demanded that temples across India be freed from government control.

    Why has the Ram Temple donations controversy exposed a broader gap in temple financial oversight?

    1. Trigger: Allegations of embezzlement of offerings and donations surfaced at the Ram Janmabhoomi Temple in Ayodhya. The allegations brought the temple’s donation-handling process into public scrutiny.
    2. Scale of the sector: India has no official count of Hindu temples. Estimates put the number at around 10 lakh.
    3. Common donation chain: Most major temples follow a similar process. Offerings are removed from donation boxes. They are then moved to counting centres for segregation, counting, and recording. Verified collections are deposited into designated bank accounts under CCTV surveillance.
    4. Unaccounted donations: Most temples are small shrines maintained by local communities or hereditary priests. A large share of cash and in-kind donations at these temples remains unaccounted for.
    5. Scale of major temple donations: Tirupati received ₹1,880 crore in annual donations, followed by Vaishno Devi at ₹230 crore, the Ram Temple at ₹150 crore, Siddhivinayak at ₹100 crore, Kashi Vishwanath at ₹80 crore, and Puri Jagannath at ₹18 crore.

    How does the Ram Temple’s donation-handling and governance framework differ institutionally from India’s other major temples?

    1. Ram Temple: The Shri Ram Janmabhoomi Teerth Kshetra Trust manages donations through a trust deed, a private legal instrument creating and governing a trust, without dedicated statutory backing. No dedicated state statute governs the temple’s administration.
    2. Tirupati: The Tirumala Tirupati Devasthanams operates under the Andhra Pradesh Charitable and Hindu Religious Institutions and Endowments Act. Its ‘Parakamani‘ system segregates finance, vigilance, and banking functions among separate personnel groups.
    3. Puri Jagannath: The Shri Jagannath Temple Act governs the temple. Hundis are sealed before and after opening, and entries are recorded in statutory forms.
    4. Vaishno Devi: The Jammu and Kashmir Shri Mata Vaishno Devi Shrine Act governs the shrine. A Shrine Board, not individual trustees, opens donation boxes through dedicated finance and security departments.
    5. Siddhivinayak: A Maharashtra law governs the temple’s trust. The main hundi is opened weekly in the presence of an executive officer, a trustee, a bank representative, and an auditor.
    6. Kashi Vishwanath: The Uttar Pradesh Shri Kashi Vishwanath Temple Act governs the temple. A Sub-Divisional Magistrate supervises the opening of its 56 donation boxes.
    7. Key distinction: Unlike these temples, the Ram Temple trust is not subject to mandatory financial audit by the state or central government. Several of its key office-bearers have long-standing associations with the RSS or its affiliates.

    Does statutory governance guarantee that temple donations remain free of controversy?

    1. Tirupati: The temple has tightened access controls, vigilance, and surveillance over the years after instances of theft involving employees and volunteers.
    2. Puri Jagannath: The Ratna Bhandar dispute centred on the custody and inventory of temple valuables. It led to court-directed scrutiny and fresh inventories.
    3. Kashi Vishwanath: Efforts have increasingly focused on routing donations through official channels. This shifts donations away from direct offerings to priests.
    4. Siddhivinayak: The temple has periodically faced scrutiny over governance and financial management.
    5. Implication: Institutional safeguards at older temples were built over time, not overnight. The Ram Temple’s current gap reflects its early stage of institutional development, not a unique failure.

    What traditions of temple management operate independent of statutory government frameworks?

    1. Family management: Temples are often managed by hereditary priest lineages known as pandas or pujaris. Offerings, donations, and ritual responsibilities traditionally belong to these families. Control rotates when multiple families are involved.
    2. Family management example: The Udupi Sri Krishna Mutt in Karnataka is administered by eight monasteries called the Ashta Mathas, founded by the 13th-century saint Madhvacharya. Each matha manages the mutt for two years. The next cycle for a matha comes only after 16 years.
    3. Mahant system: A single spiritual head, called a mahant, a spiritual head holding administrative and successor-nominating authority over a math, holds prime authority over temple assets, offerings, and administration. He typically appoints or nominates his successor.
    4. Mahant system example: The Gorakhnath Math in Gorakhpur is headed by Chief Minister Yogi Adityanath. He was appointed by the late Mahant Avaidyanath. Similar successor-based systems operate in the Shankaracharya mathas.
    5. Akhada system: Akhadas are autonomous organisations of sadhus that function as collective bodies with elected or consensus-based heads. They are also called Panchayati Akhadas, self-governing collectives of sadhus functioning through elected or consensus-based heads.
    6. Akhada system role: Akhadas appoint priests, oversee rituals, and control donations. They are prioritised for the holy dip at the Mahakumbh according to their relative status.

    Why has the Ram Temple donations controversy revived the debate over the extent of state control over religious institutions?

    1. Colonial origin of state control: The British introduced the Religious Endowments Act in 1863. It handed control of temples to committees set up under the Act, but the government retained influence through other legal provisions.
    2. Statutory blueprint: The Madras Hindu Religious Endowments Act, 1925 empowered provincial governments to legislate on endowments. Its powers expanded over time to include oversight and takeover of temple management. It became the blueprint for later state laws after Independence.
    3. Constitutional basis: Article 25(2) (The constitutional provision allowing the state to regulate secular activities linked to religious practice) empowers the state to regulate or restrict any economic, financial, political, or other secular activity associated with religious practice. This provision is the basis for state legislation governing temple endowments.
    4. Asymmetry across religions: Muslim and Christian institutions are managed through community-run boards or trusts. Statutory government-linked frameworks of the kind that govern major Hindu temples do not apply to them in the same way.
    5. Rival demands: The Ram Temple Construction Committee has proposed appointing a CEO to manage trust affairs. The Vishwa Hindu Parishad has instead called for temples across the country to be freed from government control.

    Conclusion

    The Ram Temple donations controversy stems from a specific institutional gap. The temple is governed by a trust deed, not a dedicated statute, and is not subject to mandatory financial audit. Bringing it under a statutory or audit framework similar to other major temples would close this specific gap. It would not by itself guarantee immunity from future controversy, since statutorily governed temples such as Tirupati, Puri, Kashi Vishwanath, and Siddhivinayak have all faced their own governance disputes. The unresolved question is political: whether India moves toward greater statutory oversight of temples or toward the Vishwa Hindu Parishad’s demand to free them from government control altogether.

    PYQ Relevance

    [UPSC 2024] Public charitable trusts have the potential to make India’s development more inclusive as they relate to certain vital public issues. Comment.

    Relevance: The PYQ tests the role of religious and charitable trusts in governance, public welfare, accountability, and inclusive development. The article examines how major temple trusts manage donations, institutional governance, transparency mechanisms, and the extent of state regulation, making it a direct case study of public charitable trusts in India.

  • What are India’s problems with most credit rating agencies

    Why in the News?

    Union Minister of Commerce, at a London business conference, accused global sovereign credit rating agencies of being “unfair to India” while praising India-headquartered CareEdge Ratings as “objective.” The remark reopens a standing government charge that international agencies keep India’s rating just above junk grade by over-weighting subjective, opinion-based judgments of “willingness to repay” over India’s stronger, verifiable “ability to repay” data.

    What are sovereign credit ratings?

    1. A sovereign credit rating is an independent evaluation of a country’s creditworthiness. 
    2. It measures a government’s ability and willingness to repay its debt obligations, helping global investors assess the risk of investing in that nation’s bonds or lending it money.
    3. Working: Ratings are assigned by independent credit rating agencies, most notably Standard & Poor’s (S&P), Moody’s, and Fitch Ratings.
      1. High Ratings (e.g., AAA, Aaa): Signal strong economic stability, low risk of default, and allow the government to borrow money at lower interest rates.
      2. Low Ratings (e.g., BB+, Ba1): Indicate higher credit risk and are typically labeled as “speculative” or “junk” grade, forcing the country to pay higher interest to compensate investors for the increased risk.

    How do rating agencies define and measure sovereign creditworthiness?

    1. Rating universe: India is rated by seven international sovereign credit rating agencies, S&P, Moody’s, Morningstar DBRS, Fitch, Japanese Credit Rating Agency (JCRA), Rating and Investment Information (R&I), and CareEdge Ratings. The three most widely accepted globally are S&P, Fitch, and Moody’s.
    2. Rated entities: The same alphabet-scale logic applies not only to sovereigns but to companies, municipal corporations, and state governments.
    3. Scale mechanics: Fitch and S&P run from AAA downward through AA+, AA, AA-, A+, A, A- into the B-grade band, ending at D for default. Moody’s follows an identical structure using different letters, starting at Aaa.
    4. Price-of-risk function: The rating fixes the interest rate at which an entity can borrow. AAA signals zero default risk and the lowest borrowing cost; each downward notch raises the rate to compensate lenders for higher perceived risk.
    5. The dual metric: Ability to repay is quantitative, drawn from hard, verifiable macroeconomic data. Willingness to repay is qualitative, resting on an agency’s opinion of intent rather than capacity. This distinction structures India’s later grievance against the agencies.

    What has India’s rating trajectory looked like?

    1. Persistent floor: Across most agencies, India has stayed at the lowest rung of investment grade, a grade or two above junk status, the threshold at which institutions stop lending for fear of default.
    2. Long stagnation: Until recently, this rating stayed unchanged for more than a decade, and in some cases for nearly two decades.
    3. S&P upgrade: S&P raised India’s long-term sovereign rating to BBB from BBB- in August 2025, its first upgrade of India in 18 years.
    4. Moody’s upgrade: Moody’s raised India to Baa2 (equivalent to BBB) from Baa3 in 2017, its first upgrade of India in 13 years.
    5. Other 2025 movements: R&I upgraded India to BBB+ from BBB in September 2025; Morningstar DBRS upgraded India to BBB in May 2025.

    Why does the government call the ratings agencies’ methodology unfair to India? 

    1. Persisting grievance despite upgrades: Even after the 2025 upgrades, India’s rating remains just above junk grade. India argues that agencies have not credited India’s growth story, its fundamentals, or its sovereign capabilities as a rating agency should.
    2. Official continuity: The Finance Minister of India has separately called for reform of the agencies’ methodologies, establishing this as a standing government position rather than a one-off remark.
    3. Economic Survey precedent: The 2020-21 Economic Survey devoted a full chapter to the issue. It noted this was the first time the world’s fifth-largest economy had been assigned such a low rating.
      1. Ability case made: The Survey argued India’s macroeconomic fundamentals were strong enough to demonstrate ability to repay debt.
      2. Willingness case made: It also argued India’s record of never defaulting on sovereign debt despite multiple crises should establish willingness to repay.
    4. Core allegation: The central charge is that agencies weigh the qualitative willingness metric (grounded in the opinions of a small group of experts and prone to subjectivity) more heavily than the quantitative ability metric, on which India performs comparatively well but which carries lower weightage.

    Why is CareEdge Ratings being held up as the corrective model?

    1. Origin and perception: CareEdge is the first sovereign ratings agency headquartered in India, feeding the perception that it can better capture the ground realities of the Indian economy.
    2. Methodological difference: CareEdge’s own methodology note assigns primary importance to quantitative factors, directly inverting the qualitative-heavy approach India accuses the major agencies of using.
    3. Political endorsement: Goyal singling out CareEdge as “objective” aligns with the government’s broader argument that a quantitative-first method would rate India more favourably.

    Conclusion

    India’s persistently sub-BBB sovereign rating, despite improving fundamentals, stems from ratings agencies’ structural preference for qualitative, opinion-driven assessments of willingness to repay over quantitative measures of ability to repay. This is a metric on which India performs well. The government’s promotion of CareEdge Ratings, a domestic agency that weights quantitative factors more heavily, functions less as a technical fix than as an assertion that India deserves to be rated on its own terms. This does not resolve who sets the criteria for creditworthiness: India’s grievance can only be addressed if the major agencies alter their own weighting, a decision outside New Delhi’s control. Until then, India’s rating will likely continue to lag its economic weight.

    PYQ Relevance

    [UPSC 2017] Among several factors for India’s potential growth, the savings rate is the most effective one. Do you agree? What are the other factors available for growth potential?

    Linkage: Sovereign credit ratings directly influence investment flows and borrowing costs, which affect capital formation and India’s long-term growth potential. The article argues that global rating agencies undervalue India’s macroeconomic strengths and growth prospects, thereby increasing borrowing costs despite strong economic fundamentals.

  • The case for building India’s coal chemistry capability

    Why in the News?

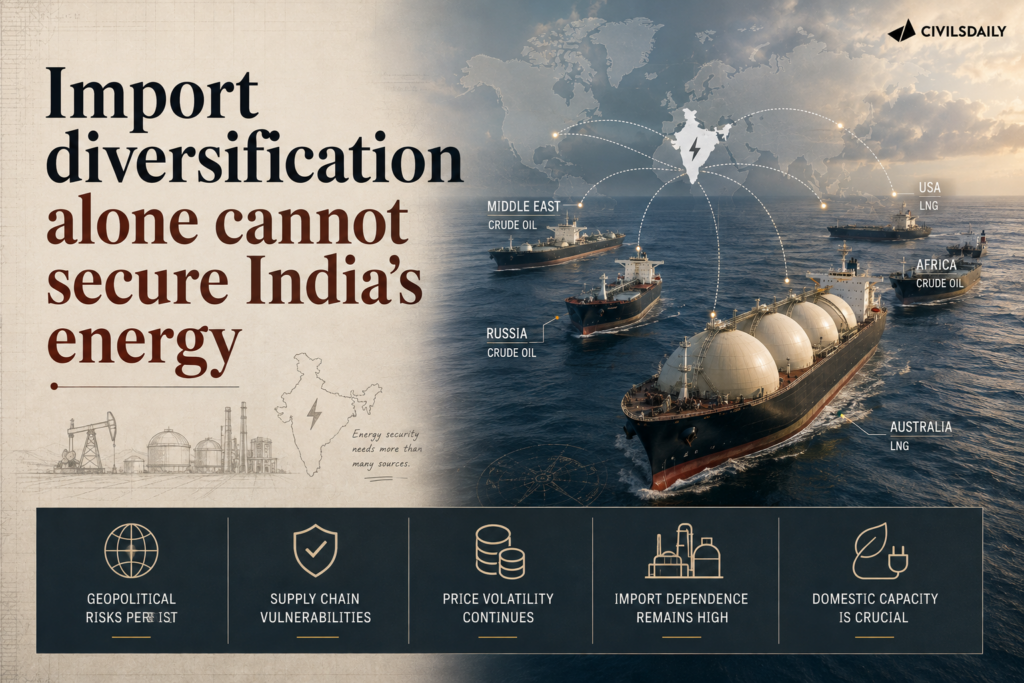
    The closure of the Strait of Hormuz in 2026 disrupted India’s crude oil and LPG supply chains, testing the country’s energy security architecture in real time. India’s refineries absorbed the crude shock through rapid sourcing diversification, but the same crisis exposed that LPG dependence is structurally different and cannot be diversified the same way, pushing coal based DME production onto the national agenda.

    How did India’s refining sector convert two decades of indigenous investment into crisis resilience during the 2026 Hormuz disruption?

    1. Diversified supplier base: India’s crude supplier base nearly tripled over two decades, forcing refineries to build capability to process multiple crude specifications rather than a single feedstock.
    2. Indigenous technical capability: Investments in indigenous research, metallurgy, process innovation, and workforce training gave refineries the ability to process feedstock across a broad range of specifications.
    3. Speed of the pivot: Within weeks of the Hormuz closure, non-Hormuz sourcing rose from 55% to 70% of India’s crude intake.
    4. LPG production surge: Under the LPG control order, domestic LPG production rose from 35 Thousand Metric Tonnes (TMT) per day to 54 TMT per day within five days. Engineers achieved this by adjusting fractionation and cracking units in real time.
    5. Engineering, not accounting: The production increase was an outcome of technical capability, not a redirection of existing supply.

    Did refinery flexibility solve India’s LPG vulnerability, or did it only manage the immediate crisis?

    1. Different nature of the two problems: Refinery flexibility solved the problem of keeping crude flowing through a fixed set of plants. It did not solve the deeper problem of LPG import concentration.
    2. Crude diversification is engineerable: A refinery can be engineered to process crude from 40 different countries.
    3. LPG diversification is not engineerable: LPG cannot be sourced from 40 different geographies. The molecule is drawn overwhelmingly from a handful of Gulf and Atlantic Basin producers.
    4. Refining efficiency is not the solution: Processing the same imported molecule more efficiently does not reduce the underlying dependence.
    5. The real solution is substitution: The long-term fix requires producing a domestic molecule that serves the same function as LPG.

    What is Dimethyl Ether (DME), and how does India propose to substitute a domestic molecule for imported LPG?

    1. Definition: DME is a clean-burning gas chemically similar to LPG. It blends directly into existing cylinders and pipelines, so it requires no new distribution infrastructure.
    2. Production route: DME is produced through coal gasification. Coal gasification converts coal into syngas, and syngas is then converted into DME.
    3. Resource base: India possesses some of the world’s largest coal reserves, giving it abundant raw material for DME production.
    4. Regulatory approval: The Bureau of Indian Standards has approved blending up to 20% DME with LPG.
    5. Quantified impact: A 20% blend sourced from coal gasification could displace roughly 6.3 million tonnes of LPG imports annually, saving nearly ₹34,000 crore in foreign exchange each year.
    6. Origin of the technology: Scientists at CSIR’s National Chemical Laboratory developed the indigenous technology for converting methanol into DME years before the crisis.

    Is India’s coal gasification ambition backed by matching execution capacity?

    1. Policy commitment: The Union Cabinet approved a ₹37,500 crore scheme to promote surface coal and lignite gasification, citing the West Asia crisis as part of its rationale.
    2. Scale of ambition: The scheme targets 100 million tonnes of coal gasification annually by 2030.
    3. Investment incentive: The scheme provides an incentive of up to 20% of plant and machinery costs.
    4. Tenure certainty: The scheme extends coal linkage tenure to 30 years. Capital-intensive projects need this horizon before committing investment.
    5. Fast-tracked approval: The Centre for High Technology under the Ministry of Petroleum and Natural Gas approved scaling up the indigenous DME pilot technology within the crisis window, without the delay typical of technology-to-deployment transitions.
    6. Feedstock gap: India’s coal has a higher ash content than the cleaner coal that underpinned China’s coal-to-chemicals industry.
    7. Capacity gap: Domestic gasification capacity remains far below the scheme’s stated ambition.
    8. Nature of the remaining challenge: Closing this gap is a question of industrial discipline and investment. Policy intent has already been settled.

    Conclusion

    India’s refinery flexibility during the Hormuz crisis proved that indigenous technical capability, once built, can absorb supply shocks. This capability did not solve India’s LPG dependence. LPG is sourced from a handful of Gulf and Atlantic Basin producers and cannot be diversified the way crude oil can. Coal-based DME production is the domestic substitute for the imported molecule. Policy commitment for it is now in place through the coal gasification scheme. What remains is execution: closing the ash-content gap and scaling gasification capacity to the technical depth China has spent two decades building.

    Value Addition

    What is Coal Chemistry? 

    1. Coal chemistry refers to the conversion of coal into high-value chemicals, fuels and industrial feedstocks through physical and chemical processes instead of burning it directly for power generation.
    2. It enables coal to produce cleaner fuels, fertilizers, petrochemicals and specialty chemicals, thereby improving the economic value of domestic coal resources.

    Major Products of Coal Chemistry

    ProcessOutput
    Coal GasificationSyngas (CO + H₂)
    Syngas ConversionMethanol
    Methanol ConversionDimethyl Ether (DME)
    Fischer-Tropsch ProcessSynthetic Diesel
    Coal-to-ChemicalsAmmonia, Urea, Olefins, Hydrogen

    What is Coal Gasification?

    1. Coal gasification is the process of converting coal into synthesis gas (syngas) by reacting coal with oxygen, steam and controlled heat under high pressure.
    2. Instead of burning coal directly, it transforms coal into a cleaner intermediate fuel that can be further processed into Hydrogen, Methanol, Dimethyl Ether (DME), Synthetic Natural Gas (SNG), Fertilisers, and Petrochemicals

    What is Dimethyl Ether (DME)?

    1. Dimethyl Ether (DME) is a clean-burning gaseous fuel produced from methanol derived through coal gasification.
    2. Key Features
      1. Chemically similar to LPG
      2. Can be blended with LPG
      3. Compatible with existing LPG cylinders and pipelines
      4. Produces lower particulate emissions
      5. Reduces dependence on imported LPG
      6. Can also serve as a clean industrial and transport fuel

    PYQ Relevance

    [UPSC 2017] Access to affordable, reliable, sustainable and modern energy is the sine qua non to achieve Sustainable Development Goals (SDGs). Comment on the progress made in India in this regard

    Linkage: The PYQ tests India’s strategy to achieve energy security through indigenous energy resources, cleaner technologies, and sustainable industrial development. The article highlights coal gasification and coal chemistry as indigenous clean-coal technologies that can reduce LPG imports, strengthen energy security, and support India’s transition towards reliable and sustainable energy systems.

  • The fiscal tightrope for State Governments

    Why in the News?

    Kerala and Tamil Nadu recently released White Papers describing their outstanding government debt as alarming. This has revived the debate on whether State debt reflects fiscal mismanagement or a structural mismatch between States’ welfare responsibilities and their limited fiscal capacity.

    Why do State governments face a persistent fiscal squeeze despite bearing the bulk of welfare spending?

    1. Vertical fiscal imbalance: The Union government holds the larger share of taxation powers. State governments bear a larger share of overall government spending. Vertical fiscal imbalance: mismatch between a government tier’s revenue powers and its expenditure responsibilities.
    2. Welfare-heavy State budgets: State spending is concentrated in health, education, agriculture, and irrigation. These sectors directly affect livelihoods.
    3. Kerala and Tamil Nadu’s social spending record: Per capita State social expenditure was 30% higher in Kerala and 20% higher in Tamil Nadu than the all-India average (2020-23). It was 35% lower in Bihar and 40% lower in Uttar Pradesh.
    4. Kerala’s own tax effort: Kerala’s per capita own-tax revenue was 1.5 times the national average, driven mainly by SGST and sales tax.
    5. Skewed devolution: Kerala received 1.92% of Union tax devolution in 2023-24. Its population share was 2.6%.
    6. Composition of Kerala’s expenditure: Salaries took up about a fifth of the budget, pensions 15.3%, and interest payments 16.5%. Only 10% of expenditure went to capital expenditure. Capital expenditure: spending that creates productive assets, as against revenue expenditure on salaries, pensions and subsidies.

    Does Kerala’s fiscal stress reflect mismanagement, or an unresolved conflict between protecting welfare gains and financing future growth?

    1. The retrenchment trap: Cutting pensions or retrenching employees would create fiscal space. It would also erode Kerala’s social sector strengths.
    2. The investment deficit: Kerala needs large-scale, State-directed investment in infrastructure, higher education, research, and public transport. This investment is necessary to compete in knowledge-intensive sectors.
    3. Outmigration of talent: Educated youth are leaving Kerala in large numbers. The State cannot create matching educational and employment opportunities.
    4. The affluence paradox: Kerala’s weak public fiscal capacity coexists with visible private affluence, large houses, expensive cars, and a high density of gold shops. This gap threatens to widen inequality.

    Is Kerala’s fiscal constraint a resource problem or an allocation problem?

    1. Low credit-deposit ratio: Kerala’s credit-deposit ratio was around 66% in 2023. The national average was 76%, and Maharashtra and Tamil Nadu exceeded 100%. Credit-deposit ratio: share of a bank’s deposits that it lends out as credit in the same region.
    2. Unutilised savings: Deposits in excess of credit disbursed in Kerala rose from ₹1,388 billion in 2016 to ₹1,906 billion in 2020 and ₹2,792 billion in 2026.
    3. Foregone investment: Kerala’s actual public investment stood at ₹1,134 billion. Potential additional investment financeable from this surplus stood at ₹1,404 billion.
    4. Doubling potential: Kerala’s capital expenditure could have at least doubled between 2016 and 2026 had surplus savings been channelled into investment.

    What does China’s local government financing model reveal about the limits of India’s system?

    1. China-local government bonds (LGBs): Chinese provinces and lower-level governments finance the bulk of investment-led growth through local government bonds. These draw on large domestic bank savings.
    2. China-local government financing vehicles (LGFVs): Off-budget borrowing through LGFVs supplements fiscal transfers. LGFV: an entity set up by a local government to raise off-budget debt for infrastructure projects.
    3. China-centrally coordinated planning: Local borrowing and investment are coordinated through central government planning, keeping decentralised borrowing aligned with national goals.
    4. China-low cost of local borrowing: Chinese local governments borrow from their banking system at around 2%.
    5. India-costlier State Development Loans (SDLs): Indian States pay 6.5% to 7.5% interest on SDLs. SDL: a market security issued by State governments to raise loans. This rate is 0.25 to 0.75 percentage points higher than the Union government’s borrowing rate.

    Should State debt be treated as a liability or as an investment in citizens?

    1. Domestic ownership of debt: State and Union bonds are largely held by domestic commercial banks and insurance companies.
    2. Debt as debt to own people: These institutions channel citizens’ savings into government bonds. The government’s debt is effectively owed to its own people, not external creditors.
    3. Welfare-expanding borrowing: A government that borrows to expand welfare and opportunity serves a larger public purpose than a tight-fisted government.
    4. The reform gap: No fiscal structure currently allows State governments to access domestic savings easily and cheaply for planned development projects.

    Conclusion

    State government debt is not primarily a symptom of profligacy. It reflects a structural mismatch between the Union’s concentration of taxation powers and States’ disproportionate share of welfare and development spending. India worsens this mismatch, unlike China, by failing to channel abundant domestic savings into cheaper, State-directed investment. Fiscal reform must lower the cost and ease the terms of State borrowing, not merely discipline State expenditure.

    PYQ Relevance

    [UPSC 2015] Though the federal principle is dominant in our Constitution and that principle is one of its basic features, it is equally true that federalism under the Indian Constitution leans in favour of a strong Centre. Discuss.

    Linkage: It examines the constitutional design of Indian federalism, including financial powers and Centre-State fiscal relations. The article argues that States bear major expenditure responsibilities but have limited revenue and borrowing autonomy, highlighting the fiscal imbalance within India’s federal structure.

  • India seeks clarity as ‘tipping points’ rock Bonn climate talks

    Why in the News?

    At the Bonn climate talks held in Germany from June 8-18, India urged caution and clarity in defining and using the term “tipping points.” The European Union termed this call “coordinated misinformation” and “obstruction,” exposing a clash between scientific caution and political urgency in climate negotiations. This dispute surfaced unresolved definitional uncertainty at the core of a term now central to global climate diplomacy.

    Why is it difficult to define and project climate tipping points despite their significance?

    1. Threshold definition: A tipping point is a threshold beyond which part of the earth’s climate system shifts into a new state.
    2. Self-reinforcing feedback: Crossed thresholds trigger changes that resist reversal on human timescales even after the original cause is removed. Arctic sea ice melt exposes dark ocean that absorbs more heat, driving further melting.
    3. Non-linear behaviour: Tipping points do not track the pace of greenhouse gas accumulation. Small temperature increases can trigger large, self-amplifying feedback loops.
    4. Range of known thresholds: Identified tipping points include Amazon rainforest dieback into savannah, Atlantic Meridional Overturning Circulation (AMOC: ocean current system redistributing heat between the Atlantic’s north and south) collapse, coral reef mass-bleaching, monsoon shifts over India and West Africa, and Greenland ice sheet disintegration.
    5. Projection constraint: Reliable projection is limited by both the complexity of the climate system and uncertainty in input data.
    6. Retrospective identification: Tipping points can be confirmed with confidence mainly through post-facto historical analysis, not predicted reliably in advance.

    Does the tipping points framework help or hinder climate policymaking?

    1. Communicator divide: Climate communicators disagree on the framework’s value. Some treat tipping points as a catalyst for urgent action. Others argue their inherent uncertainty undermines their use in policymaking.
    2. Lived disasters are more persuasive: Directly experienced disasters, such as extreme rainfall or heatwaves, are often more effective than tipping points at raising public awareness and driving climate action.
    3. Disproportionate risk: The risks tipping points carry exceed those of routine climate disasters. This raises unresolved questions about how societies adapt once a threshold is breached.
    4. Positive tipping points exist: Social tipping points can also work in favour of climate goals. Renewable energy adoption is expected to become self-sustaining once it crosses a critical adoption level.

    Why do scientists struggle to project when specific tipping points, such as Atlantic Meridional Overturning Circulation (AMOC) collapse or Amazon dieback, will occur?

    1. AMOC uncertainty: Scientists cannot reliably project when the AMOC will collapse. A Science Advances study found it could slow by 51% rather than collapse outright by 2100 under a medium-emissions scenario.
    2. Model-dependent findings: This projection ranks the credibility of competing model outputs rather than forecasting a single outcome. Uncertainty is embedded in the underlying data and cannot be removed by collecting more data.
    3. Amazon complexity understated: Projections of Amazon dieback based on climate data alone miss the effects of cattle-ranching and deforestation, understating the risk of a shift to savannah.
    4. Human stakes ignored: The Amazon rainforest’s fate is tied to millions of tribal and urban residents and numerous artisanal enterprises, making projection errors socially consequential.
    5. Abruptness contested: Some scientists dispute that tipping points are abrupt. Ice sheets can deplete over thousands of years, a timescale far from abrupt for human observers.

    Why is the popular belief that 1.5°C marks a tipping point scientifically incorrect, and why does this matter for climate negotiations?

    1. Popular misconception: A common but incorrect belief holds that 1.5°C of surface warming is itself a tipping point. Research published in 2019 found this confusion persists even among climate negotiators.
    2. Political origin of the number: Negotiators adopted 1.5°C and 2°C as political targets at the 2015 COP21 talks, based on evidence that warming beyond these levels increasingly disrupts the climate.
    3. Targets are not thresholds: These temperature goals are political targets, not tipping points in themselves.
    4. Stakes of the confusion: Conflating a political target with a scientific threshold weakens the precision needed to communicate real tipping point risks during negotiations.

    Why did India’s call for definitional caution at the Bonn talks get labelled misinformation by the European Union?

    1. India’s position: India argued at Bonn that the term “tipping point” carries “definitional challenges” and urged care in its use.
    2. EU’s response: The European Union characterised this caution as “coordinated misinformation” and “obstruction.”
    3. Independent scientific validation: India’s position mirrors concerns already acknowledged in independent research and state-led efforts, including a U.K. Meteorological Office project on building consensus on tipping point terminology.
    4. Documented barrier: A project document from this effort states that unclear and inconsistent terminology for concepts such as tipping points, irreversibility, collapse, and shutdown presents a substantial barrier to understanding earth system risks.

    What are the risks of miscommunicating tipping points, and what should climate discourse guard against?

    1. Trust through honesty: Scientists and communicators broadly agree that clearly communicating scientific uncertainty builds trust rather than eroding it.
    2. Symmetrical credibility risk: Both false alarm and false hope damage credibility when a projection or forecast fails to materialise.
    3. Risk over certainty: The risk implicit in tipping points, rather than certainty about their timing, is significant enough to warrant action.
    4. Framework criticised: A 2025 Nature Climate Change article by researchers from Canada, the U.K., and the U.S. criticised the tipping points framework for oversimplifying complex natural and human system dynamics and for conveying urgency without a meaningful basis for climate action.
    5. No threshold for doomism: The same researchers noted climate change is already causing demonstrable harm, and that no specific temperature increment marks a boundary between the current dangerous climate and a future catastrophic one, leaving no justification for either doomism or paralysis.

    Conclusion

    Definitional ambiguity around “tipping points” is a genuine and internationally acknowledged scientific challenge, not evidence of misinformation. The greater risk lies not in questioning terminology but in conflating scientific uncertainty with either false alarm or paralysis. Climate negotiations need clearer, consensus-based terminology to preserve scientific credibility without diluting the urgency of climate action.

    PYQ Relevance

    [UPSC 2021] Describe the major outcomes of the 26th session of the Conference of the Parties (COP) to the United Nations Framework Convention on Climate Change (UNFCCC). What are the commitments made by India in this conference?

    Linkage: The question examines the functioning of the UNFCCC climate negotiation process and India’s negotiating position in global climate governance. The article discusses India’s intervention at the Bonn Climate Conference under the UNFCCC, where it sought greater clarity on the scientific and policy use of “climate tipping points”.

  • What India’s 12 ‘operationally deployed’ nuclear warheads mean

    Why in the News?

    SIPRI’s 2026 Yearbook classified 12 of India’s 190 nuclear warheads as operationally deployed for the first time. These are positioned with active military forces mated with delivery systems and ready for use.The classification has triggered concern over a possible shift in India’s No First Use (NFU) doctrine.

    Why does SIPRI’s “deployment” classification not indicate a shift in India’s nuclear doctrine?

    1. No change in launch policy: NFU commits India to not launching a pre-emptive strike; SIPRI’s report records no revision of this commitment.
    2. No threshold lowering: The report does not indicate any lowering of the threshold for nuclear employment.
    3. No change in political control: Civilian and political oversight mechanisms governing nuclear release remain unaltered.
    4. Expert confirmation: Warheads mated with delivery platforms make assured retaliation more credible, not less restrained.
    5. Reaffirmed commitment: India’s representatives reaffirmed NFU and non-use against non-nuclear-weapon states at the UN High-Level Meeting in September 2025.
    6. Internal calls for first-use rejected: Periodic domestic proposals for a conditional or hybrid first-use posture have not prevailed.

    Why does the stockpile-deployment distinction matter for assessing India’s posture?

    Possessing a warhead and deploying it as part of an operational deterrent are not the same condition. The distinction determines whether a count of warheads signals readiness or merely holdings.

    1. De-mated baseline: For most of its nuclear history, India stored warheads separately from delivery vehicles at a central site under strict oversight.
    2. Purpose of de-mating: This was meant to maximise safety, reduce accidental-use risk, and signal restraint internationally.
    3. Definition of deployment: Deployment pairs a warhead with a delivery system and positions it with operational forces in readiness.
    4. Readiness, not intent: A deployed weapon is configured for use if authorised; it is not a signal of imminent use.
    5. Speed differential: A de-mated weapon needs time to prepare and deploy; a mated weapon can be launched faster.
    6. Scale of the shift: SIPRI’s count reflects a small but significant fraction of India’s arsenal now held in operational readiness, not a wholesale change in posture.

    How does the sea-based deterrent resolve the central vulnerability in India’s NFU doctrine?

    NFU is a retaliation-only doctrine, so it stands or falls on whether the force can survive a first strike. Sea-basing closes the specific gap that land-based deployment cannot.

    1. Survivability requirement: NFU depends on enough of the arsenal surviving a first strike to deliver a retaliatory blow; without this, NFU becomes a liability rather than a doctrine.
    2. Land-based vulnerability: Land-based missiles sit at known, mappable locations and can be targeted in a disarming first strike.
    3. Sea-based advantage: A submerged submarine cannot be found, tracked, or destroyed in time, removing this vulnerability.
    4. Arihant-class platform: India’s Arihant-class submarines have steadily strengthened second-strike survivability, with additional platforms expected to further consolidate this leg of the triad.
    5. Operational milestone: Three operational SSBNs allow India to keep at least one submarine submerged and on patrol at all times.
    6. Supporting readiness measure: Increasing reliance on canisterised Agni-series missiles, which carry fuel sealed and ready, raises operational readiness without requiring further preparation before launch.

    What broader trend does India’s deployment milestone sit within, and why does it matter?

    1. Global reversal: SIPRI’s 2026 Yearbook records states increasingly relying on nuclear weapons as instruments of national power, reversing decades of gradual disarmament progress.
    2. Scale of global arsenals: Nine nuclear-armed states held an estimated 12,187 warheads as of January 2026.
    3. China’s pace: China’s arsenal has grown to approximately 620 warheads, expanding faster than any other nuclear power and now over three times Pakistan’s estimated stockpile.
    4. Dual-direction posture: India’s modernisation is increasingly focused on long-range systems capable of reaching China, while continuing to account for Pakistan.
    5. Weakening arms control: Arms-control agreements have weakened or collapsed even as competition intensifies in hypersonic delivery, AI-enabled decision support, missile defence, and anti-submarine warfare.
    6. Unresolved risk: The maturation of India’s second-strike capability strengthens deterrence bilaterally, but does nothing to address the rising risk of miscalculation across a destabilising global order.

    Conclusion

    SIPRI’s classification of 12 Indian warheads as operationally deployed documents the maturing of India’s sea-based second-strike capability, not a retreat from No First Use. This development, however, sits inside a global environment where arms-control frameworks are weakening and major powers are re-arming. The institutions designed to manage nuclear risk must adapt to this faster-fielding environment, or the credibility gained through India’s improved deterrent will be offset by a rising structural risk of miscalculation.

    PYQ Relevance

    [UPSC 2017] Give an account of the growth and development of nuclear science and technology in India. What is the advantage of fast breeder reactor programme in India?

    Linkage: Tests India’s strategic nuclear capabilities, indigenous nuclear development and the evolution of its deterrence architecture.The article explains how India’s maturing nuclear triad and operational deployment strengthen its credible minimum deterrence and second-strike capability without altering its No First Use doctrine.

  • Behind Europe’s heatwave, cliamte change the culprit

    Why in the News?

    A World Weather Attribution (WWA) study has confirmed climate change as the unequivocal cause of the ongoing European heatwave, which has broken or is forecast to break historic heat-stress records in 45% of 854 cities analysed. The finding sharpens a wider gap between the certainty climate science now offers and the declining political priority accorded to climate action.

    What does the WWA study establish about the causal role of climate change in the current heatwave?

    1. Unequivocal attribution: WWA found climate change, not the El Niño phenomenon or any other factor, responsible for the European heatwave.
    2. Recurrence pattern: This is the third severe heatwave to grip Europe in five years, after 2022 and 2023.
    3. Mortality scale: More than 1,300 excess deaths have been recorded since 21 June; over 1,00,000 people are estimated to have died from extreme heat across 2022 and 2023.
    4. Probability shift: Record-breaking night-time highs are nearly 100 times more likely now than in 2003; daytime peak temperatures are nearly 10 times more likely.
    5. Historical baseline broken: Temperature records being broken were set in 1976; the current daytime and overnight highs would have been virtually impossible to occur as recently as 1976.
    6. ENSO ruled out: The El Niño Southern Oscillation phase played no role in driving the heat during this spell.

    Why has climate attribution science become central to fixing responsibility for extreme weather events?

    1. Definition: Climate attribution is the scientific discipline that determines how much human-caused global warming influences the probability and intensity of specific extreme weather events. It quantifies how much worse or more likely a particular flood, heatwave, or drought has become compared to a hypothetical world without human-driven emissions
    2. Function: Attribution science tests the likelihood of a specific extreme weather event occurring if climate change were not taking place.
    3. Recency: The discipline has developed only over the last two decades.
    4. Speed gain: Assessments earlier took months or years; WWA’s methods now produce findings within days, even while an event is still ongoing.
    5. Purpose: The science removes ambiguity and fixes the exact extent of climate change’s responsibility for an event.
    6. Scientific caution without it: Scientists are otherwise wary of linking any individual extreme weather event to climate change without a dedicated attribution study.
    7. Policy intent: Beyond generating evidence, attribution studies are designed to force policymakers to act faster on climate change.

    Does scientific certainty on climate attribution translate into proportionate political action?

    1. Evidence-action gap: Scientific evidence on climate change is already voluminous and compelling, yet climate change has dropped down the list of global priorities.
    2. Political trigger: The decline has sharpened particularly after Donald Trump took office as US President.
    3. Forum evidence: Recent G7 meetings have carried little or no climate-related agenda or outcomes.
    4. Reversal of salience: Climate change was earlier among the most prominent items at international meetings involving influential leaders; this prominence has receded.
    5. Target abandonment: Scientists maintain the Paris Agreement targets of containing global temperature rise within 1.5°C to 2°C remain achievable, but governments treat them as effectively out of reach.
    6. Reframing of feasibility: Governments are treating the required resource mobilisation as politically impractical rather than scientifically unattainable.

    What risk does the global shift from mitigation to adaptation pose?

    1. Strategic shift: Countries are increasingly choosing to let climate change play out and to adapt to its impacts rather than prevent it.
    2. Scientific objection: Scientists routinely warn against adaptation as a substitute for mitigation.
    3. Inherent limits: Adaptation has limits beyond which impacts cannot be absorbed.
    4. Trend trajectory: Events such as the European heatwave are projected to increase in both frequency and intensity over coming years.
    5. Displacement, not resolution: The shift to adaptation transfers the climate risk from prevention to adaptation capacity rather than resolving it.

    Conclusion

    Climate attribution science has removed the scientific ambiguity once used to avoid linking individual extreme weather events to climate change. The European heatwave attribution exposes a widening gap between scientific certainty and political will, as global climate governance deprioritises mitigation. Countries are substituting adaptation for prevention despite scientists’ warnings that adaptation carries inherent limits. Closing this evidence-action gap is now central to achieving the Paris Agreement targets.

    PYQ Relevance

    [UPSC 2017] ‘Climate Change’ is a global problem. How India will be affected by climate change? How Himalayan and coastal states of India will be affected by climate change?

    Linkage: The PYQ xamines the impacts of climate change and the need for mitigation and adaptation strategies. The article uses the European heatwave as scientific evidence that climate change is intensifying extreme weather events and highlights the growing gap between climate science and political action.

  • MSMEs and Viksit Bharat 2047: formalisation, credit access, and the inclusion gap

    Why in the news

    The Ministry of MSME released its 2025–26 sector review highlighting landmark milestones: 8.7 crore Udyam registrations, CGTMSE completing 25 years, and MSME contributions reaching 31.1% of GDP and 48.58% of exports. The review exposes the central challenge — formalisation and credit access have expanded rapidly, but equity capital, market linkages, and structural inclusion for marginalised entrepreneurs remain uneven.

    What is the scale and economic significance of India’s MSME sector, and what structural gaps persist despite aggregate growth?

    • Economic footprint (January 2026 data): MSMEs contribute 31.1% of GDP, 35.4% of manufacturing output, and 48.58% of exports. With 38.9 crore employed, the sector is the second-largest employment source after agriculture.
    • Definition revision (April 2025): The government revised MSME classification thresholds based on investment and turnover, giving enterprises greater room to scale without losing policy support — addressing a longstanding cliff-edge disincentive to growth.
    • Formalisation reach: Udyam and Udyam Assist registrations crossed 8.7 crore as of June 2026, expanding access to institutional finance and government schemes for previously informal enterprises.
    • Persistent equity gap: Debt-based credit schemes have scaled, but equity capital essential for MSMEs seeking to move beyond micro-scale remains structurally limited. The SRI Fund (Fund of Funds) has reached only 761 enterprises with ₹2,851 crore as of May 2026, a narrow footprint relative to sector size.

    How has credit access for MSMEs been restructured, and what constraints remain in reaching the smallest enterprises?

    • CGTMSE expansion: The Credit Guarantee Fund Trust for Micro and Small Enterprises approved 29.03 lakh guarantees worth ₹3.77 lakh crore (January–November 2025). The guarantee ceiling was raised from ₹5 crore to ₹10 crore, enabling larger collateral-free support.
    • Digital Credit Assessment Model: A new model reduces dependence on traditional collateral and balance-sheet assessment, improving access for first-generation and informal-origin entrepreneurs who lack formal credit histories.
    • PMEGP reach: The Prime Minister’s Employment Generation Programme has supported 10.84 lakh micro-enterprises with ₹29,623 crore in margin money subsidies, generating employment for over 97 lakh people since inception. Applications are now available in 19 regional languages (since June 2025).
    • Remaining constraint: Guarantee schemes address debt access but not enterprise viability. MSMEs without bankable cash flows common among artisan and rural enterprises — remain outside the formal credit architecture despite formalisation.

    How are technology adoption and quality certification being embedded into the MSME ecosystem?

    • ZED Certification (Zero Defect Zero Effect): Over 93.61 lakh MSMEs registered and 6.68 lakh certified as of May 2026. The framework promotes quality manufacturing with minimal environmental impact — aligning MSME output with global supply chain standards.
    • LEAN Manufacturing: Over 65,647 enterprises registered and 18,961 certified under the Lean Manufacturing scheme. Adoption of globally recognised lean practices reduces waste and raises operational efficiency.
    • Technology Centre network: 18 existing Technology Centres, 25 operational Extension Centres (trained 53,963 youth), and 9 World Bank-supported centres (trained 59,357 individuals, assisted 1,520 MSMEs as of November 2025). An additional 20 Technology Centres and 100 Extension Centres are under development.
    • IPR facilitation: Intellectual Property Facilitation Centres have approved 191 patents, 807 trademarks, 99 designs, and 6 GI registrations building a thin but growing innovation asset base within the sector.

    How effectively is MSME policy reaching marginalised groups artisans, SC/ST entrepreneurs, women, and the North East?

    • PM Vishwakarma: The scheme covers 18 traditional trades and reached its four-year registration target of 30 lakh beneficiaries in two years. Over 24 lakh completed basic skill training; ₹5,133 crore in collateral-free loans sanctioned to 5.98 lakh beneficiaries.
    • National SC/ST Hub: Public procurement from SC/ST-owned enterprises rose from ₹99 crore (2015–16) to ₹3,731 crore (2024–25). SC/ST-owned MSEs accounted for 1.93% of total public procurement as of December 2025, progress visible but far below proportional representation.
    • Women entrepreneurship: At the 44th IITF 2025, over 67% of MSME stalls were allotted to women entrepreneurs a market access intervention, though stall allocation does not translate directly into sustained commercial scale.
    • North East promotion: 73 projects approved under the NER & Sikkim scheme (total cost ₹114.37 crore, government assistance ₹89.60 crore), targeting manufacturing, testing, packaging, skilling, and tourism infrastructure. Eight new projects were approved in Assam and Meghalaya in 2025.
    • SFURTI (traditional industry clusters): 513 clusters approved, 376 functional as of June 2026, benefiting 3.03 lakh artisans. Cluster-based organisation addresses market linkage and tool access — the structural gaps that individual artisan support cannot solve.

    Do the governance and grievance redressal mechanisms match the scale of the MSME sector’s delayed payment and dispute burden?

    • MSME Samadhaan Portal: 2,56,892 applications received involving ₹55,244 crore in claims as of June 2026. Only 58,148 cases disposed — a 22.6% resolution rate, revealing a large unresolved claims backlog despite the portal’s existence.
    • CHAMPIONS Portal: 39,494 grievances received in 2025–26; 39,387 resolved a 99.72% disposal rate. High throughput here contrasts sharply with Samadhaan’s backlog, suggesting delayed payments are the deeper structural problem, not general grievance handling.
    • Online Dispute Resolution (ODR) Portal: Newly launched to reduce delayed payments through technology-enabled dispute resolution. Effectiveness is yet to be demonstrated at scale.
    • Public procurement monitoring: The MSME Sambandh Portal tracked ₹31,443 crore in CPSE procurement during FY 2026–27 (as of June 2026), with 54.51% sourced from MSEs across 29,769 enterprises. Mandatory procurement targets create market access but do not resolve the downstream payment delay problem.

    Conclusion

    India’s MSME sector has achieved significant formalisation and credit access milestones — but the policy architecture still addresses inputs (registrations, guarantees, skilling) more effectively than outcomes (enterprise viability, market competitiveness, equitable inclusion). The delayed payment backlog on Samadhaan, the narrow reach of equity capital under the SRI Fund, and the 1.93% SC/ST share in public procurement collectively indicate that expansion of the formal enterprise base has not yet translated into structural economic empowerment. For Viksit Bharat 2047, the MSME agenda must shift from formalisation as an end to commercialisation and sustained enterprise growth as the measure of success.

  • Relief to digital fraud victims: How losses upto 50K can be recovered

    Why in the News?

    The RBI notified a revised compensation framework for victims of digital payment fraud, effective 1 January 2027. Under the scheme, victims can recover part of losses up to ₹50,000 through a state-supported fund. The move follows a sharp rise in fraud value despite fewer reported cases.

    Why did the RBI intervene now, and what does the scale of digital fraud reveal about the existing liability framework?

    1. Rising fraud value: Fraud cases fell to 10,114 in FY26, but the amount involved increased 46% to ₹48,021 crore, indicating fewer but larger frauds.
    2. Consumer liability gap: The earlier framework placed the burden of proof and recovery on customers. Banks faced limited liability unless negligence was established
    3. Electronic Banking Transactions (EBTs) as the primary vector: EBT are a digitally initiated banking transaction, including NEFT, RTGS, UPI, and card-based payments. They became the primary fraud channel, exposing a liability gap.
    4. State absorption of residual risk: The new framework makes the RBI the majority loss-bearer for unrecovered fraud amounts. This signals that the regulator treats digital fraud loss as a systemic risk requiring regulatory underwriting, not merely a bilateral consumer-bank dispute.

    What is the consumer entitlement under the new framework, and what conditions govern eligibility?

    1. Maximum compensation ceiling: A victim is eligible for compensation of up to 85% of net loss amount or ₹25,000, whichever is less. This applies to gross fraudulent EBT losses up to ₹50,000.
    2. Lifetime cap: The compensation is available once during the lifetime of the account holder. Repeat claims for subsequent fraud events are not covered under this mechanism.
    3. Complaint filing window: Victims must lodge a complaint regarding the fraud within five calendar days of the event. Claims filed beyond this window are ineligible regardless of the loss amount.
    4. Loss verification standard: The loss must be established in accordance with the internal processes set out in the victim’s bank’s policy. The framework does not prescribe a uniform evidentiary standard across banks, leaving verification to individual bank procedures.
    5. Threshold-based compensation rate: For losses below ₹29,412, the victim receives 85% of the amount lost. For losses between ₹29,412 and ₹50,000, the victim receives a flat ₹25,000 (the ceiling).

    How is the cost of compensation shared between the RBI, the victim’s bank, and the beneficiary bank?

    1. Domestic fraud (below ₹29,412): RBI bears 65% of compensation. The victim’s bank and beneficiary bank contribute 10% each.
    2. Domestic EBT fraud between ₹29,412 and ₹50,000 (₹25,000 flat compensation): The RBI contributes ₹19,118 (76.5%). The victim’s bank and the beneficiary bank each contribute ₹2,941 (approximately 12% each).
    3. Cross-border EBT fraud (elevated bank contribution): In cross-border cases, the victim’s bank’s contribution rises to 20% for frauds below ₹29,412, and to ₹5,882 for frauds in the ₹29,412-₹50,000 band.
    4. Multiple beneficiary banks (proportionate allocation): Where more than one beneficiary bank receives the fraudulent amount, each bank’s share of the compensation is proportionate to the amount credited to its accounts.
    5. Numerical illustration (official example): If fraud loss is ₹40,000 and ₹15,000 is recovered, the net compensable loss is ₹25,000. The victim receives 85% of ₹25,000 = ₹21,250. The RBI contributes ₹16,250; victim’s bank and beneficiary bank contribute ₹2,500 each. If nothing is recovered, the victim receives ₹25,000 (ceiling), distributed in the same proportion.

    What standard of bank negligence triggers full bank liability, and what are the banks’ procedural obligations?

    1. Full bank liability for own negligence: Where fraud arises from the bank’s own negligence, the bank must compensate the victim entirely. The RBI cost-sharing mechanism does not apply in such cases.
    2. Safety and security failures: Failing to ensure proper safety and security mechanisms for EBTs constitutes negligence. This includes system malfunctions and security breaches.
    3. Alert failures: Failing to send mandatory transaction alerts for EBTs above ₹500 is classified as negligence. The alert obligation is non-discretionary.
    4. Complaint handling failures: Failing to provide 24×7 channels for customer complaints and failing to act diligently on received complaints both constitute negligence. Banks cannot limit complaint access to business hours.
    5. Complaint resolution timelines: Banks must resolve fraudulent EBT complaints within 45 calendar days for domestic EBTs and within 60 calendar days for cross-border EBTs. Breach of these timelines has implications for bank liability assessment.
    6. Post-complaint containment obligation: On receipt of any fraudulent EBT complaint, a bank must take prompt steps to prevent further unauthorised EBTs in the customer’s account. This is a proactive duty, not a passive acknowledgment obligation.

    Does the framework resolve the consumer’s structural vulnerability to digital fraud, or does it shift the problem without eliminating it?

    1. Consumer protection: The framework guarantees time-bound compensation and imposes liability for proven bank negligence.
    2. Limited bank incentives: RBI bears most compensation costs. Banks usually contribute only 10-20%, reducing incentives to strengthen fraud prevention.
    3. Procedural burden: Victims must report fraud within five days and satisfy bank-specific verification standards.
    4. Source of fraud: The framework compensates losses but does not strengthen EBT security standards or regulate payment intermediaries.
    5. Residual reporting: Victims must also report fraud to the National Cyber Crime Reporting Portal or Cyber Crime Helpline. This supports record-keeping, not recovery.
    6. Coverage mismatch: The compensation cap is ₹25,000, whereas average fraud value in FY26 was about ₹4.75 crore per case, limiting relevance to small-value consumer fraud.

    Conclusion

    The RBI framework introduces the first regulatory mechanism for sharing consumer losses from digital fraud. It reduces immediate customer losses but leaves banks with limited financial incentives to prevent fraud. Large-value frauds, security standards and accountability of payment intermediaries remain unresolved.