💥Join UPSC 2027,2028 Mentorship (August Batch) + XFactor Notes & Microthemes PDF

Type: Op-ed

  • [29th August 2026] The Hindu OpED: Unkind cuts: On the Telangana and Karnataka electoral rolls

    [29th August 2026] The Hindu OpED: Unkind cuts: On the Telangana and Karnataka electoral rolls

    Question (2018, GS2): “In the light of recent controversy regarding the use of Electronic Voting Machines (EVM), what are the challenges before the Election Commission of India to ensure the trustworthiness of elections in India?
    Linkage: The core of the current news is the concern over potential wrongful disenfranchisement vs. genuine roll clean-up. When the ECI implements large-scale deletions (up to 50% in some urban constituencies) without releasing verifiable metrics like the elector-to-population ratio, it creates a transparency deficit. This directly mirrors the challenge of maintaining public trust in the electoral process, similar to the EVM debate.

    Mentor Comment:

    The Election Commission of India’s Special Intensive Revision (SIR) has struck off nearly a fifth of the electoral rolls in Telangana and Karnataka, about 22 per cent and 19.5 per cent respectively, with some Bengaluru and Hyderabad constituencies losing more than 40 to 50 per cent of their electors. The revision has proceeded after the Supreme Court of India permitted the SIR process to continue, and follows the Bihar SIR, where the Court had questioned why political parties filed so few objections to wrongful deletions. The Commission has not published the elector-to-population ratio, the only test of under-enrolment, for any state during the revision, making it impossible to verify whether the deletions reflect genuine bloat or wrongful disenfranchisement.

    What is the Special Intensive Revision (SIR)?

    1. What it is: The SIR is an intensive revision of electoral rolls conducted by the Election Commission of India, distinct from its routine summary revision process.
    2. How it works: It places the onus on electors and political parties to file objections against wrongful deletions.
    3. Its template: The Bihar SIR set the process the Commission has since extended to other states, including Telangana and Karnataka.

    What does the scale of deletions in Telangana and Karnataka show?

    1. High deletion rates: Telangana lost about 22 per cent and Karnataka about 19.5 per cent of electoral roll names, among the highest deletion rates in the country.
    2. Sharpest cuts in capital cities: Five Bengaluru constituencies lost more than half their electors, and nine of Hyderabad’s 15 constituencies saw deletions of more than 40 per cent.
    3. Implausible as genuine bloat: Both states have high net in-migration from the rest of India, and a deletion is justified only if the elector left the state altogether, since a move within the state would only relocate a name on the same roll rather than remove it.

    Why is the Commission’s justification hard to verify?

    1. Mandatory ratio withheld: The Commission has not published the elector-to-population ratio for any state during the revision, though doing so is mandatory and is the only test of under-enrolment.
    2. Opaque data release: Karnataka’s Chief Electoral Officer has not released a gender-wise breakdown of deletions and has scattered lists across Google Drive links without the old booth numbers, making verification difficult.
    3. A precedent of wrongful exclusion: A similar “logical discrepancy” process in West Bengal disenfranchised lakhs of electors; a Right to Information request found barely 82,000 of nearly 38 lakh appeals before 19 tribunals had been decided months after the state’s elections, with more than 90 per cent of decided appeals restoring the elector.

    Challenges to the SIR process

    1. Onus on electors invites under-objection: Requiring electors and parties to actively contest wrongful deletions means low awareness and the infrequent use of a voter identity card lead to few objections being filed. Eg. During the Bihar SIR, the Supreme Court itself asked why political parties had filed so few objections. Fix. Shift the burden to the Commission by requiring it to proactively verify a deletion against updated residence or migration data before finalising it.
    2. Opacity defeats verification: Withholding the elector-to-population ratio and publishing deletion lists without booth numbers or gender breakdowns prevents independent scrutiny of whether cuts are justified. Eg. The Karnataka Chief Electoral Officer scattered deletion lists across Google Drive links without old booth numbers. Fix. Mandate publication of the elector-to-population ratio and a standardised, booth-wise deletion list for every state before a revision is finalised.

    Conclusion

    Unless the Commission publishes the verification data it is required to release, the scale of the Telangana and Karnataka deletions will remain unexplained, and the West Bengal experience suggests a substantial share of those struck off may eventually prove to have been wrongly excluded.

  • Economy weathered West Asia shock. Now, reform for sustained growth (Op-ed by Sajjid Chinoy)

    Why in the News

    India’s gross domestic product (GDP) growth for the last quarter is expected to print close to 8 per cent, defying fears that the West Asia conflict had dented the economy. This follows a joint fiscal, monetary and regulatory stimulus through 2025, direct tax cuts, a Goods and Services Tax (GST) rationalisation, and an effective 150 basis point policy rate cut, combined with a swift diversification of energy imports during the conflict. The pickup is largely cyclical, and the investment rate, corporate capital expenditure (capex) and structural export and employment growth remain too weak to sustain the expansion once the stimulus fades.

    What explains India’s growth resilience through the West Asia conflict?

    1. A joint stimulus in 2025: Direct taxes were cut in February, GST was rationalised in September, and policy rates were cut by an effective 150 basis points along with regulatory easing in the financial sector.
    2. Non-oil export acceleration: Exports have picked up on the back of a near 15 per cent depreciation of the real effective exchange rate (REER), the trade weighted, inflation adjusted value of the rupee against a basket of currencies, since 2025, a reduction in United States tariffs, and resilient global growth.
    3. Swift energy diversification: India sourced crude from Russia and liquefied natural gas from the United States and Oman to prevent shortages, importing 17 per cent more energy than normal last quarter, while the government absorbed the bulk of the oil price shock through the fisc to insulate the private sector.

    Why does India’s investment rate remain a structural concern?

    1. Fixed investment stagnant: Fixed investment remains near its decadal average of 32 per cent of GDP and has not lifted despite rising public investment and real estate capex.
    2. Corporate capex has not picked up: Corporate capex continues to languish around 10 to 11 per cent of GDP, and balance sheets of the top 1,000 listed companies show no discernible pickup in 2025-26.
    3. Central capex is slowing: Central capex grew 30 per cent between 2020 and 2023, then slowed to 11 per cent in 2024 and just 1.6 per cent in 2025, as tax cuts absorbed fiscal space.
    4. State capex under pressure: Cash transfers on demand are pushing state capex growth below nominal GDP growth.
    5. Weak demand visibility: Capacity utilisation has stayed in the 75 to 76 per cent range for a decade, and rising Chinese overcapacity is discouraging corporate investment.

    Why are consumption and export growth not yet structural?

    1. Weaker growth than the earlier export led cycle: Post-pandemic private consumption and exports grew at about 5 per cent, against the 16 per cent export growth between 2003 and 2012 that had crowded in private capex.
    2. Service export growth has halved: Service export growth in nominal dollars has fallen to 8 per cent over the last year from 16 per cent over the previous four years, and employment across major IT firms has stayed flat.
    3. Employment mix is shifting toward self-employment: The Periodic Labour Force Survey shows India’s employment rate rising, but a significant share of new jobs are self-employed rather than salaried, even as the mix improved in 2025.
    4. Consumption is credit fuelled: Non-Banking Financial Company lending to households is growing at 20 per cent and unsecured personal lending momentum has risen to 25 per cent, on the back of rising household leverage.

    What must change for the growth cycle to become structural?

    1. Labour must become more competitive against capital: India’s capital-labour ratio has risen for over two decades, and reversing this needs education, skilling and health investment, alongside rationalising labour laws that raise the cost of labour.
    2. Exports need structural competitiveness: Goods exports have fallen from 17 per cent of GDP a decade ago to 11 per cent, and further gains need tariffs and non-tariff barriers rationalised and overregulation reduced.
    3. Private capex is the real crowding-in mechanism: Structurally higher consumption and exports are what would draw in a sustained private capex cycle, which in turn would crowd in foreign direct investment and stabilise the balance of payments.

    Conclusion

    The current cyclical strength, backed by clean corporate and financial balance sheets and a sustained agricultural surplus, is a bridge over the West Asia shock, not a destination. Unless investment, exports and employment turn structural, the growth cycle will not sustain once the fiscal and monetary stimulus fades, and the piece warns there is little time left to act given global automation, trade fragmentation and a fraying international order.

    Matching Previous Year Question

    No direct PYQ traced in the provided files.

  • Problem with ethanol blending isn’t sugar — it’s reliance on grains; the way forward (Op-ed by Harish Damodaran)

    Why in the News

    India’s ethanol blended petrol (EBP) programme, an arrangement under which oil marketing companies blend ethanol into petrol to progressively raise the blending ratio, was designed primarily to help sugar mills earn an additional revenue stream so they could pay cane farmers on time. For the current supply year ending October 2026, grain based feedstock accounts for 759.8 crore litres, or 72.5 percent, of the 1,048.3 crore litres of ethanol allocated among distilleries, against 288.5 crore litres, or 27.5 percent, from sugarcane based feedstock. What began as a sugar-support programme has become a grain-dependent one, and the article argues this reversal, not sugar diversion, is the programme’s real problem.

    What is the Ethanol Blended Petrol (EBP) programme?

    1. About: The EBP programme requires oil marketing companies to blend ethanol into petrol at a rising target ratio, currently 20 percent under the E20 standard, to cut crude oil imports and support farm incomes.
    2. Feedstock: Ethanol can be produced from sugarcane derived molasses and juice, or from cereal grains such as maize and rice, through milling, starch extraction, fermentation, distillation and dehydration to 99.9 percent pure alcohol.
    3. Original design: The programme was conceived to give sugar mills a secondary revenue stream so they could clear cane payment dues to farmers, and was later extended to maize farmers as an additional demand source.

    How did the feedstock mix shift from sugarcane to grain?

    1. The molasses-only phase, till 2017-18: All ethanol supplied to oil marketing companies came from C-heavy molasses, the final byproduct of cane juice processing left after mills had recovered all economically extractable sugar.
    2. The B-heavy and direct-juice phase, from 2018-19: Mills began producing ethanol from intermediate B-heavy molasses and directly from cane juice or syrup, incentivised by higher government-set prices for ethanol from these routes, which let mills divert sucrose before it was even crystallised into sugar. Ethanol supplies to oil marketing companies rose from 38 crore litres in 2013-14 to 190 crore litres in 2018-19, and blending rose from 1.6 percent to 4.9 percent over the same period.
    3. The grain takeover, 2018-19 onward: Standalone grain-based distilleries, running on maize or on surplus and damaged rice sourced from the Food Corporation of India (FCI) or the open market, expanded independently of the sugar season. By 2023-24, grain-based feedstock supplied 402 crore litres, or 59.7 percent, of the 673 crore litre total that helped achieve 14.6 percent average blending, a reversal the article calls the tail wagging the dog.
    4. Current supply year, 2025-26: Of the 1,048.3 crore litres allocated to hit the E20 target, 759.8 crore litres, or 72.5 percent, is from grains and only 288.5 crore litres, or 27.5 percent, is from sugarcane-based feedstock, against a backdrop of September-ending sugar stocks projected at a 17-year low.

    Why is rice, not maize, now the likely mainstay feedstock?

    1. Maize supply risk: El Nino conditions are expected to persist through the first half of next year, raising doubts about maize availability for ethanol in 2026-27 even as sugarcane diversion is curtailed.
    2. Rising reliance on FCI rice: The government allocated 5.2 million tonnes of surplus FCI rice to ethanol distilleries for 2025-26, raised to 7.2 million tonnes in July; at 450 to 460 litres of ethanol per tonne, that yields only 325 to 330 crore litres, well short of the roughly 1,050 crore litres needed to sustain E20.
    3. Rice is water-intensive and underpriced for this use: FCI rice is sold to ethanol distilleries at Rs 23.2 per kg, with a reserve price of Rs 21 per kg for fully broken grains, against a retail market price of Rs 40 per kg for normal rice and Rs 30 per kg for broken rice, and rice is a water-guzzling crop to be diverting toward fuel at scale.
    4. Distillery capacity outpaces demand: Distillers have built an aggregate ethanol production capacity of nearly 2,000 crore litres, against 421 crore litres in 2014 and current annual offtake of 1,050 crore litres, and it is this installed capacity, not farmer need, that is driving the push for even higher blending standards such as E22, E25, E27 and E30.

    What effect has the programme had on maize farmers, and what is at risk if grain reliance deepens further?

    1. Maize price gains: With ethanol demand added to poultry and livestock feed demand, wholesale maize prices in India rose from a Rs 13.8 to Rs 17.8 per kg range in 2021 to a Rs 22.1 to Rs 24.5 range in 2024, benefiting maize growers the way the programme once benefited cane farmers.
    2. A rice-driven repeat of the same trade-off: Sustaining current blending targets without sugar or adequate maize would require earmarking still more FCI rice, a shift the article argues is difficult to justify given rice’s water footprint and its underpriced diversion from the food security stock.

    Way Forward

    1. Discourage standalone grain distilleries reliant on FCI rice: The government should end this diversion route and push distillers toward less water-intensive grains such as bajra and jowar, which carry 58 to 62 percent recoverable starch and can yield 380 to 400 litres of ethanol per tonne, comparable to maize, letting millet farmers gain the same price benefit maize growers have seen.
    2. Stop chasing blending targets ahead of schedule: The EBP programme was already succeeding at 10 to 15 percent blending, and the article notes the government’s own chief economic adviser has suggested reverting to the E10 standard, an argument the piece endorses as pragmatic rather than a retreat.

    Back2Basics: What is the E10/E20 standard?

    1. E10 and E20 denote the percentage of ethanol blended into petrol, so E20 petrol contains 20 percent ethanol against 80 percent petrol by volume.
    2. India crossed the E10 blending average in 2021-22 and reached the E20 national average in the current 2025-26 supply year, years ahead of the original 2030 target set for E20.
    3. Government notified fuel standards now extend beyond E20 to E22, E25, E27 and E30, reflecting distillery capacity built well beyond current ethanol offtake.

    Matching Previous Year Question

    PrelimsPYQ.csv: “In the context of alternative sources of energy, ethanol as a viable bio-fuel can be obtained from:” (2009, Microtheme: Biofertilizers/Fuels, Subject: Environment)

  • Policy mistakes, not ethanol, behind sugar price rise (Editorial)

    Why in the News

    Retail sugar prices have risen from an average of Rs 45 to Rs 65 per kg within a month, and the increase is being widely blamed on the ethanol blended petrol programme. Only 27.5 percent of the ethanol supplied by distilleries to oil marketing companies in 2025-26 came from sugarcane juice and molasses, with the balance from cereal grains, and the roughly 3 million tonnes of sugar diverted for ethanol is close to a tenth of the year’s 30.9 million tonne gross production. Similar or larger diversions in the four preceding sugar years did not cause comparable price spikes, which places the blame elsewhere.

    Is ethanol actually responsible for the price spike?

    1. Small diversion share: The estimated 3 million tonnes of sugar diverted to ethanol production is close to a tenth of the 30.9 million tonne gross sugar output for the year ending September 2026.
    2. No precedent for a price link: The four preceding sugar years saw diversions of 3.5 million tonnes, 2.4 million tonnes, 4.3 million tonnes and 3.6 million tonnes respectively, all without triggering a comparable price spiral.
    3. Feedstock mix has shifted away from sugar already: Only 27.5 percent of ethanol supplied to oil marketing companies in 2025-26 came from sugarcane juice and molasses, with the rest from cereal grains, so the programme is no longer primarily a sugar diversion story.

    What actually explains the price spurt?

    1. A large output shortfall: Gross sugar production for the year came in well below the initial 34.4 million tonne projection made at the start of crushing in November, a shortfall of 3.5 million tonnes.
    2. A late government response: Mills in Uttar Pradesh and Maharashtra were struggling to get cane and shutting down crushing operations by February, but the shortfall was not addressed until exports were banned only in mid-May.
    3. Panic measures after prices soared: From July, as a deficient June monsoon raised concerns about cane yields for 2026-27, the government imposed a 400 tonne stock limit with a 30 day holding cap on all dealers and ordered mills to furnish details of bulk buyers who purchased 500 tonnes or more.

    What should the government have done instead?

    1. Keep the import window open: Rather than banning exports, the government could have cut the tariff on raw and white sugar imports from 100 percent to zero by April, when most mills had stopped crushing.
    2. Rely on market intelligence over controls: The sugar industry runs on government-set controls, from cane pricing to how much a mill may sell in a given month, a control structure this crisis exposed as failing to anticipate and balance supply and demand.

    Conclusion

    The editorial’s central claim is that the sugar price rise is a policy failure, rooted in a delayed response to an anticipated output shortfall and a subsequent set of panic controls, not a consequence of the ethanol blending programme. The remedy it points to, opening the import window through tariff cuts rather than export bans and stock limits, remains untested by the government to date.

    Matching Previous Year Question

    PrelimsPYQ.csv: “Statement I: Of the two major ethanol producers in the world, i.e., Brazil and the United States of America, the former produces more ethanol than the latter. Statement II: Unlike in the United States of America, where corn is the principal feedstock for ethanol production, sugarcane is the principal feedstock for ethanol production in Brazil.” (2025, Microtheme: Biofertilizers/Fuels, Subject: Environment)

  • [28th August 2026] The Hindu OpED: New-age fires

    [28th August 2026] The Hindu OpED: New-age fires

    Question (2024, GS3): “What is disaster resilience? How is it determined? Describe various elements of a resilience framework. Also mention the global targets of the Sendai Framework for Disaster Risk Reduction (2015-2030).”
    Linkage: The lack of a “distinct safety regime” for highly vulnerable environments like ICUs represents a core gap in India’s disaster resilience framework. This question challenges candidates to describe how to move from a structural vulnerability to a resilient system using global standards like the Sendai Framework.

    Mentor Comment

    India’s fire risk profile has shifted over the past 15 years from industrial facilities, large offices and mass gatherings toward residential buildings, hotels and hospitals, with electrical fires, driven by heavier appliance use, overloaded circuits and poor maintenance, now predominant. Intensive Care Units are especially vulnerable because of their oxygen rich environments, and this month back to back fires struck neonatal Intensive Care Units in Amravati, Maharashtra, and Chhindwara, Madhya Pradesh. Despite a string of near identical incidents since the 2024 Jhansi fire in which 18 newborns died, ICU fires have still not produced a single, distinct safety regime for the units most at risk.

    What happened in this month’s neonatal ICU fires?

    1. Amravati: The fire was extinguished within 30 minutes, but smoke proved fatal for three babies who were already being treated for complications, with a faulty ventilator suspected as the cause.
    2. Chhindwara: A short circuit in a warmer at the district hospital’s Neonatal Intensive Care Unit triggered a fire in which three newborns, only days old, suffered burns.

    Why should ICU fires be treated as a distinct safety category?

    1. They are sealed spaces that fill with smoke fast: Intensive Care Units are sealed compartments where smoke accumulates quickly, and in a Neonatal Intensive Care Unit patients cannot evacuate on their own, making regular evacuation drills essential.
    2. A safer design already exists on paper: A best case setup includes three independent exits, with at least two allowing horizontal evacuation, automatic sprinklers, independent power lines for major equipment, oxygen cylinder supports positioned away from electrical sockets, and fire drills held every two years.

    What regulatory response has followed past ICU fires?

    1. A professional body called for mandatory certification: Following an earlier Neonatal Intensive Care Unit fire in Delhi, the National Neonatology Forum called for mandatory fire safety certification for Neonatal Intensive Care Unit equipped hospitals, regular power audits and analogue addressable alarms.
    2. A named evacuation protocol followed: The same push produced a standard evacuation protocol, now known as RACE, for Rescue, Alarm, Confine, and Extinguish or Evacuate.
    3. New national guidelines offer a starting point: The 2026 National Guidelines on Fire and Life Safety in Healthcare Facilities can serve as a starting point for building ICU and Neonatal Intensive Care Unit specific safety standards.

    What risk do post fire investigations typically miss?

    1. Electrical harmonics is a largely unaudited factor: Neonatal Intensive Care Unit equipment is packed with electronic components that draw distorted current, which can silently overheat neutral wiring, transformers and loose connections without ever tripping a circuit breaker.
    2. Generic findings may be hiding the real cause: Post fire reports that cite generic “short circuits” or “technical faults” may be missing this harmonic driven degradation entirely, leaving the underlying risk unaddressed even after an inquiry closes the case.

    Challenges to ICU fire safety

    1. Fire safety certification is not uniformly enforced: Many hospitals, particularly outside metro cities, operate without a valid fire safety no objection certificate or lapse on renewal. Eg. Investigations after major hospital fires, including the Jhansi Neonatal Intensive Care Unit fire in which 18 newborns died, have repeatedly found expired or absent fire clearances. Fix. Link a hospital’s fire safety certificate renewal to its registration and accreditation status, so a lapsed certificate automatically suspends the facility’s licence to operate.
    2. Backup power for critical equipment is often shared, not independent: Ventilators, warmers and monitors frequently run off the same power lines as general hospital load, so a single fault can cut life support equipment. Eg. A suspected equipment fault caused this month’s Amravati Neonatal Intensive Care Unit fire. Fix. Mandate a dedicated, separately fused power line for every ICU bed’s life support equipment, independent of the hospital’s general electrical circuit.
    3. Frontline staff are rarely trained for ICU specific evacuation: Evacuating patients who cannot move on their own requires drilled procedures that most hospital staff never practise. Eg. Regular ICU evacuation drills remain the exception rather than the norm even at accredited hospitals nationally. Fix. Make a biennial ICU evacuation drill, as already recommended for Neonatal Intensive Care Units, a mandatory condition of hospital accreditation across all critical care units, not only newborn wards.

    Conclusion

    ICU and Neonatal Intensive Care Unit fires have recurred at roughly the same scale and for the same reasons since the 2024 Jhansi fire, with certification calls and evacuation protocols repeatedly following each incident without preventing the next one. Treating ICU fires as a distinct safety category, backed by independent power lines, harmonics audits and enforced certification, is what remains to convert a decade of incident specific responses into a standing safety regime.

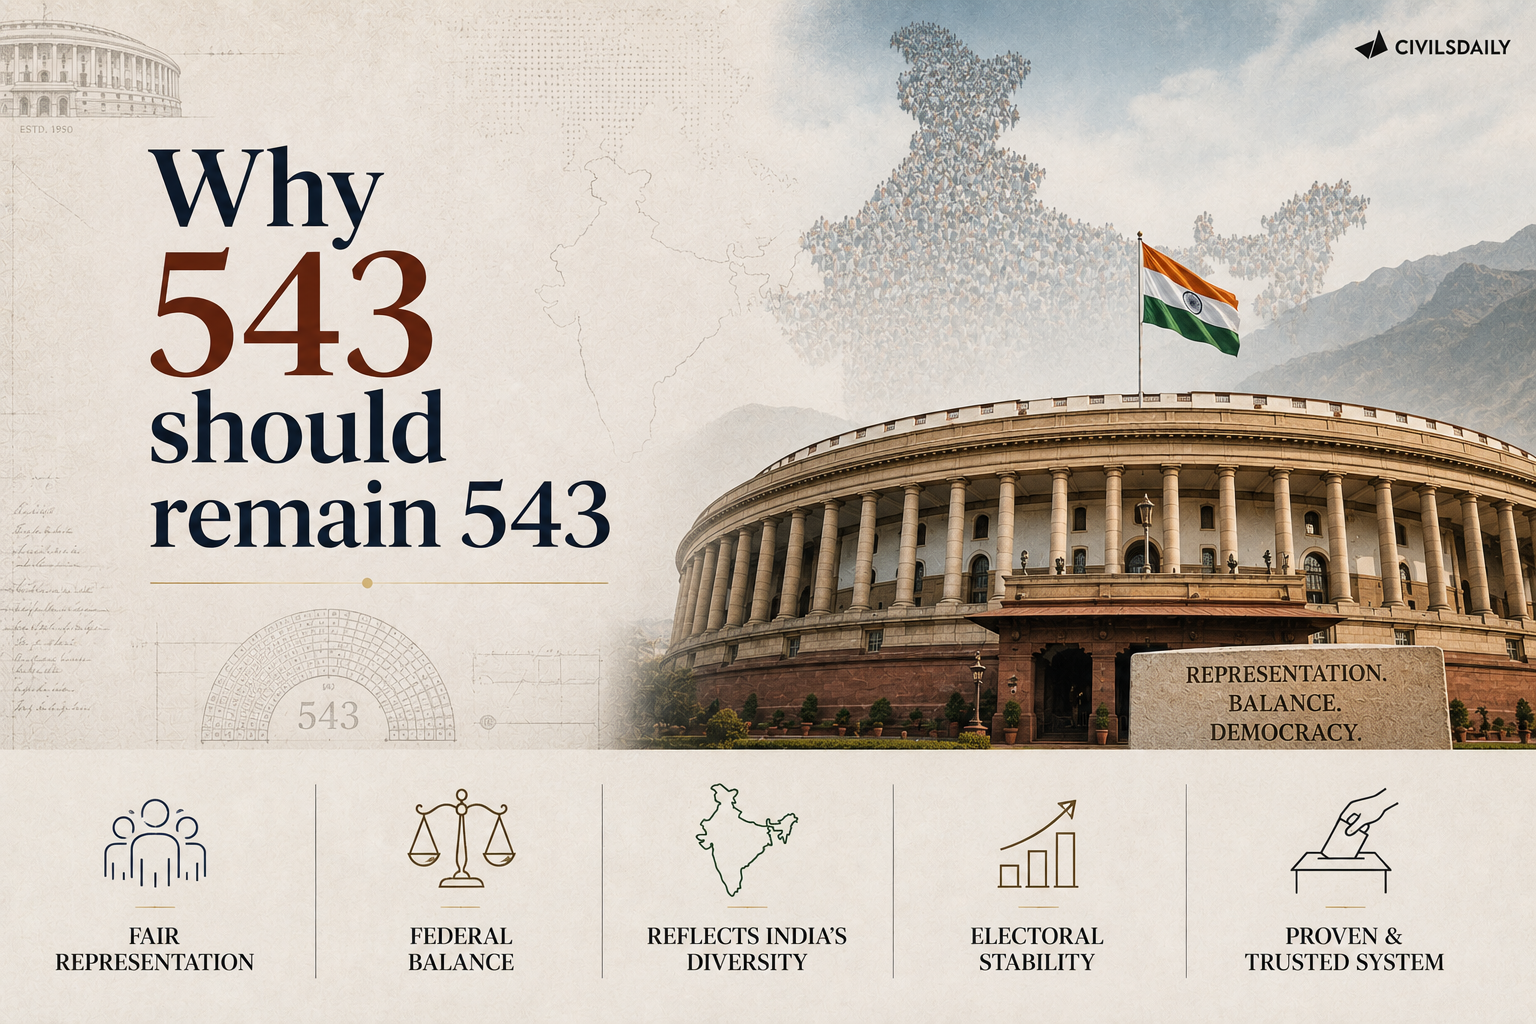
  • Why 543 should remain 543

    Why 543 should remain 543

    Why in the News

    After both Houses of Parliament were adjourned sine die, the monsoon session has yet to be formally prorogued, prompting speculation that Parliament could be reconvened for another attempt at the constitutional amendment linked to delimitation and women’s reservation. That uncertainty sharpens a question Parliament must confront: whether delimitation, the redrawing of constituency boundaries to reflect population change, must necessarily mean enlarging the Lok Sabha beyond its present 543 seats. The government has reportedly suggested increasing every State’s representation by roughly 50 percent so each keeps its current proportion of seats, a formula that leaves the proportional balance between States unchanged even as it widens the absolute gap in their voting strength.

    What is the constitutional basis linking delimitation to the Lok Sabha’s size?

    1. The representation principle: Article 81 requires that representation broadly correspond to population “so far as practicable,” while Article 82 provides for a fresh delimitation exercise after every Census.
    2. The 1976 freeze: The 42nd Constitutional Amendment, 1976 froze the inter State allocation of Lok Sabha seats on the basis of the 1971 Census, so States that succeeded in family planning were not politically penalised for slowing population growth.
    3. The extension: The freeze was extended by the 84th Constitutional Amendment, 2001 until the first Census conducted after 2026 is published.

    Why does a proportional expansion still favour larger States?

    1. Proportions stay the same: A roughly 50 percent increase in every State’s seats would keep each State’s share of the Lok Sabha unchanged from today.
    2. But the absolute gap widens: If Uttar Pradesh’s seats rose from 80 to 120 and Tamil Nadu’s from 39 to about 59, the proportional relationship would hold, yet the absolute gap in voting strength would widen from 41 Members of Parliament to around 61.
    3. Why the gap matters: Parliament votes in absolute numbers rather than proportions, so governments, confidence motions and constitutional amendments would all turn on a wider numerical gap than exists today.

    Can delimitation happen without enlarging the House?

    1. A precedent already exists: The delimitation exercise after the 2001 Census reorganised constituencies within States while leaving the existing inter State seat allocation untouched.
    2. The same principle can apply again: The Census expected in 2027 could provide the basis for redrawing constituencies within each State to reflect demographic movement and urbanisation, without increasing the Lok Sabha beyond 543 seats.

    What do other democracies show about legislature size and population growth?

    1. United States: The House of Representatives has remained at 435 voting members for more than a century, despite the country’s population growing many times over.
    2. Switzerland: The National Council has stayed at 200 members since 1963.
    3. Hungary: Parliament was reduced from 386 members to 199.
    4. Italy: The Chamber of Deputies was cut from 630 members to 400.

    What would a larger Lok Sabha do to Parliament’s own functioning?

    1. Fixed parliamentary time: Parliamentary time does not expand with the number of Members of Parliament, so even with 543 members, many already get few opportunities to speak, ask questions or raise matters of public importance.
    2. A larger House would worsen this: A Lok Sabha enlarged to more than 800 members would reduce those opportunities further even as numerical representation rises.
    3. Already outsized constituencies: Indian Members of Parliament already represent the largest average constituencies among the world’s major democracies, several times the size of a United States congressional district or a United Kingdom constituency.

    Where should the accessibility pressure from population growth be absorbed instead?

    1. No federal arithmetic constraint at the State level: A larger Vidhan Sabha, or State Legislative Assembly, shifts no balance between States, since each Assembly answers only to its own State’s population.
    2. The proposed shift: Strengthening representation through more Members of the Legislative Assembly and smaller Assembly constituencies can bring representatives closer to citizens without enlarging the national legislature, since most citizens approach elected representatives over matters substantially within the State sphere, such as roads, schools and hospitals.

    How does women’s reservation fit within a frozen 543 seat House?

    1. The existing House can absorb it: One third of the present Lok Sabha is approximately 181 seats, and women’s constitutionally promised representation can be delivered within the existing House of 543 rather than through additional seats.
    2. What reservation is meant to do: The purpose of reservation is to alter who occupies parliamentary seats, not to create hundreds of additional ones.
    3. The risk of combining it with enlargement: An expansion on the proposed scale could raise the number of women Members of Parliament while also deepening the numerical dominance of the already larger States, so a reform addressing one imbalance could deepen another.

    Challenges to keeping the Lok Sabha frozen at 543

    1. Political resistance from faster growing States: States whose population has grown fastest since 1971 may resist a freeze that keeps their Lok Sabha strength unchanged relative to their current population share. Eg. States with higher population growth could press for the government’s enlargement proposal precisely because it raises their absolute seat count. Fix. Pair the freeze with strengthened State level representation, so faster growing States gain proportionate voice through larger Assemblies rather than through the Lok Sabha.
    2. Redrawing constituencies within States is itself contentious: Internal redelimitation shifts constituency boundaries and can alter the political weight of specific regions or social groups within a State, so it invites dispute even where a State’s total seat count is untouched. Eg. The Jammu and Kashmir Delimitation Commission’s 2022 exercise was contested by opposition parties as tilting the balance toward one region over another. Fix. Anchor any internal redelimitation in updated, transparent 2027 Census data, with a public objection and hearing process before boundaries are finalised.
    3. A prolonged freeze delays updated representation: Continuing the freeze until the first post 2026 Census pushes any change in the Lok Sabha’s internal distribution well into the future, leaving current population shifts unreflected for years. Eg. The freeze first imposed in 1976 has already run for close to half a century without a fresh count of inter State seat shares. Fix. Commit to a fixed timeline for the post 2026 Census based delimitation, so the freeze does not become indefinite by default.

    Conclusion

    Delimitation and the size of the Lok Sabha are separable questions, and preserving the House at 543 seats while redrawing constituencies within States and absorbing accessibility pressure through larger State Assemblies would deliver updated representation, women’s reservation and federal fairness without disturbing the balance between larger and smaller States. Whether Parliament chooses this route or an across the board enlargement that widens the absolute gap between States even as it keeps their proportions unchanged will shape the federal balance of the Republic for decades, a question that stays open as long as the constitutional amendment remains pending.

    Back2Basics: What is a Delimitation Commission?

    1. What it is: A Delimitation Commission is a body constituted under a Delimitation Act to redraw the boundaries of parliamentary and Assembly constituencies based on the latest Census.
    2. How many: Delimitation Commissions have been constituted four times in independent India, in 1952, 1963, 1973 and 2002.
    3. Legal basis: Its orders have the force of law and cannot be challenged in a court.
    4. Latest exercise: The most recent Commission, based on the 2001 Census, redrew constituency boundaries within States without altering the inter State allocation of Lok Sabha seats frozen since 1976.

    [2024] How many Delimitation Commissions have been constituted by the Government of India till December 2023?

    [A] One

    [B] Two

    [C] Three

    [D] Four

  • [27th May 2026] The Hindu OpED: The high cost of India’s private health-care boom

    [27th May 2026] The Hindu OpED: The high cost of India’s private health-care boom

    Question (2024, GS2): “In a crucial domain like the public healthcare system, the Indian State should play a vital role to contain the adverse impact of marketisation of the system. Suggest some measures through which the State can enhance the reach of public healthcare at the grassroots level.”
    Linkage: This question directly targets the core of the private healthcare boom, framing it as the “marketisation of the system”. It asks candidates to address the “adverse impacts” (such as high costs and inequitable access) and outlines the state’s responsibility to provide affordable, grassroots-level alternatives

    Mentor Comment

    The Parliamentary Standing Committee on Health and Family Welfare’s 176th Report has found that the average cost of hospitalisation is ₹50,508 in a private facility against ₹6,631 in a government facility, and that out-of-pocket childbirth expenditure is ₹7,630 in private facilities against ₹2,299 in public ones. The Committee has made 368 recommendations, including standardised package rates, mandatory pre-treatment cost estimates, a proposal to cap basic room tariffs in metropolitan private hospitals at the average tariff of nearby three-star hotels, and a review of foreign direct investment (FDI) rules governing the acquisition and management of existing hospitals. The article argues this exposes a contradiction at the heart of India’s health policy: the country wants more private and foreign capital in health care, particularly in Tier-2, Tier-3 and rural areas, even as it moves to restrict the same capital’s ability to acquire existing hospitals.

    What contradiction does the Committee’s report expose?

    1. Wanting more capital and restricting it at once: The Committee wants India to attract more private and foreign investment in health care, especially in under-served Tier-2, Tier-3 and rural areas, while simultaneously asking the government to review FDI rules on the acquisition and management of existing hospitals.
    2. Cross-subsidy expectation on corporate hospitals: Among its recommendations, large corporate hospitals earning from medical tourism, foreign patients and high-net-worth individuals are expected to cross-subsidise poorer Indians and reserve beds for Ayushman Bharat-Pradhan Mantri Jan Arogya Yojana (AB-PMJAY) beneficiaries at regulated rates.
    3. The case for continued investment: Hospitals require substantial capital, for land, equipment, intensive care units, digital systems, laboratories and trained personnel, and public hospitals cannot currently meet all demand for secondary and tertiary care, so foreign investors and private-equity funds fill a genuine capacity gap; excessively restrictive or unpredictable regulation risks pushing that investment elsewhere.

    How does information asymmetry drive up private health-care costs?

    1. The patient cannot independently verify need: A patient rarely decides independently whether an MRI is required, whether admission should continue for two more days, or whether a procedure is necessary, because the provider knows more than the patient, the condition economists call information asymmetry.
    2. Financial incentives shape volume, not just price: When financial incentives become too strong, they can influence not just the price of care but how much care is delivered in the first place.
    3. Institutional incentives compound the effect: Corporate hospital groups competing for well-known specialists, sophisticated technology and premium infrastructure build a high-cost ecosystem; revenue targets, procedure-linked incentives, and higher occupancy or revenue-per-bed expectations can gradually influence institutional behaviour even where most doctors act in patients’ interests.
    4. The resulting medicalisation: Lab investigations may detect abnormalities that would never have caused harm, more screening can lead to unnecessary follow-up tests, and a patient manageable as an outpatient may be admitted; Caesarean sections, angioplasties, intensive-care admissions, diagnostic packages and long medicine lists need to be read within this incentive structure, not only as individual clinical decisions.

    What should an FDI review in hospitals actually test?

    1. New capacity versus acquired capacity: Whether an investment creates new beds or simply acquires existing ones.
    2. Competition versus concentration: Whether it improves competition or leads to market concentration.
    3. Under-served areas versus metro saturation: Whether it enters an under-served district or adds another high-end facility in a metro that already has one.
    4. Enforceable public-interest conditions: Where an investor receives concessional land, tax benefits or other public support, whether there are enforceable obligations tied to affordable beds or participation in public insurance schemes.

    Why can’t a hotel-tariff-linked room cap fix hospital pricing?

    1. A hospital room is not a hotel room: A hospital room includes nursing, infection-control and emergency support that a hotel room does not, so tying its tariff to a nearby three-star hotel’s rate is easy to understand but does not capture what the charge covers.
    2. Capping one component shifts cost elsewhere: If one component of the bill is capped, hospitals may raise charges on other components, leaving the total bill largely unaffected.
    3. A relevant precedent, with a caveat: India’s experience with coronary stent price regulation showed that government intervention can reduce excessive mark-ups, but hospital care is more complex than a single device, since what matters is the total cost of an episode, not one component.
    4. The alternative on the table: Diagnosis-Related Groups (DRG), a patient-classification system that pays a fixed, predetermined amount for an inpatient stay based on the diagnosis and procedures involved, rather than reimbursing each service separately, alongside package rates, transparent cost estimates, billing standards and audit mechanisms.

    Challenges to price capping and FDI review as the fix

    1. Regulation cannot substitute for public capacity: India cannot regulate its way out of weak public health care; if government hospitals stay overcrowded, understaffed or hard to access, citizens will keep depending heavily on private providers regardless of price rules. Eg. OECD countries’ experience shows a strong public health system that offers a credible alternative is itself one of the most effective forms of regulation. Fix. Strengthen primary health care so disease is prevented, detected and treated early, so public hospitals become a genuine option rather than a last resort.
    2. Insurance design can reinforce the wrong incentive: An insurance system that pays for volume of procedures, rather than appropriate care, reproduces the same incentive problem privately funded care already has. Fix. Redesign AB-PMJAY and similar insurance systems to reward appropriate, outcome-linked care rather than higher procedure volumes, backed by clinical audits and evidence-based treatment protocols.

    Conclusion

    Price caps and an FDI review are reasonable starting points, but the Committee’s own recommendations expose a deeper contradiction between wanting more private and foreign capital in health care and restricting the same capital’s ability to acquire hospitals. The article’s central argument is that the real fix does not lie only in capping prices, but in building a public health system credible enough to counterbalance the incentive structure that private investment creates; the next milestone is whether the government acts on the Committee’s recommendations, including the proposed FDI review.

    Parliamentary Standing Committee on Health and Family Welfare

    1. It is a Department-related Parliamentary Standing Committee, one of the panels through which Parliament examines the working of a ministry, here the Ministry of Health and Family Welfare, between sittings of the House.
    2. Its reports, such as the 176th Report cited here, are recommendatory: the government must respond to them but is not bound to act on their recommendations.
    3. Its membership is drawn from both Houses of Parliament, giving it cross-party composition distinct from a ministry-appointed expert panel.
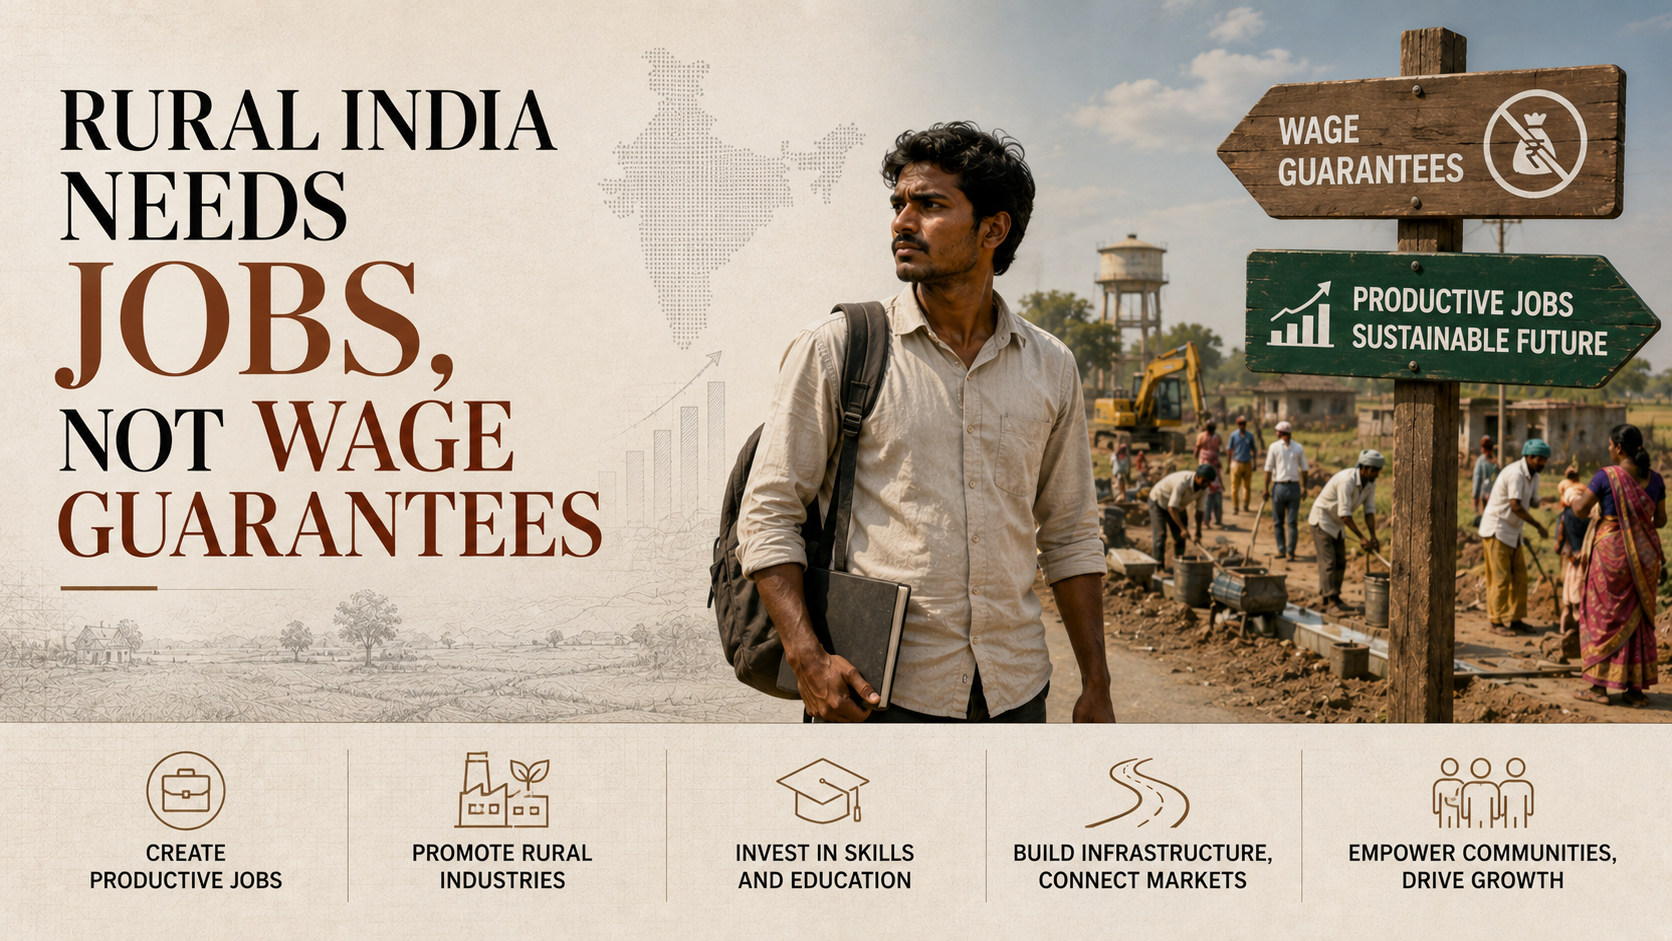
  • Rural India needs jobs, not wage guarantees

    Rural India needs jobs, not wage guarantees

    Why in the News

    An opinion piece argues that a new rural wage-guarantee scheme has recorded low uptake among the rural workforce, and contends this shows rural India needs durable, income-generating employment rather than a guaranteed-wage safety net. The scheme pays a guaranteed wage for a fixed number of days, which the piece contrasts with sectors such as food processing, renewable energy and small and medium enterprises (SMEs), which it argues could generate sustained employment rather than a temporary income floor. The tension is between a safety-net approach to rural distress and a growth-oriented approach that builds durable non-farm jobs.

    Why has the wage-guarantee scheme seen low uptake?

    1. Wage ceiling below market rates: Where the scheme’s guaranteed wage sits below prevailing local market wages for casual labour, workers have limited incentive to enrol, since informal market work pays more for the same effort.
    2. Seasonal mismatch: A fixed-day guarantee does not align well with the seasonal peaks in rural labour demand during sowing and harvest, when private demand for labour already absorbs much of the available workforce.

    What alternative does the piece propose?

    1. Food processing: Expanding food processing capacity near production zones can absorb rural labour in agro-processing roles that persist beyond a single season.
    2. Renewable energy: Rural solar and biomass energy projects can generate sustained local employment in installation, operation and maintenance roles.
    3. Small and medium enterprises: Supporting rural SMEs with credit and market access can create employment that grows with demand, rather than being capped at a fixed number of guaranteed days.

    Unemployment in India

    1. The International Labour Organization (ILO) defines an unemployed person as someone of working age, without work, currently available to work and actively seeking work in a reference period.
    2. India’s unemployment carries several distinct types: frictional, structural (a mismatch between workers’ skills and market demand), cyclical, seasonal, disguised (as in agriculture, where more people are employed than the work requires), and chronic.
    3. Over 90 percent of India’s workforce remains informal, which limits meaningful, secure job creation regardless of headline employment growth.
    4. Manufacturing contributes only about 16 to 18 percent of GDP, well below China’s roughly 26 percent, constraining the sector’s capacity to absorb surplus labour.

    Government Initiatives for Employment Generation

    1. Mahatma Gandhi National Rural Employment Guarantee Act (MGNREGA), 2005: Guarantees 100 days of rural wage employment a year to any adult member of a rural household, and is the specific scheme this op-ed’s wage-guarantee critique concerns.
    2. PM Vishwakarma: Provides collateral-free loans, skilling and toolkits to artisans across 18 traditional trades.
    3. PM Vishwakarma Rozgar Yojana / Employment Linked Incentive (ELI) scheme: Approved with an outlay of about 99,446 crore rupees, targeting 3.5 crore jobs over two years.
    4. e-Shram Portal: A national database that issues unorganised workers a Universal Account Number and links them to social security schemes.
    5. DAY-NRLM: Mobilises the rural poor into Self-Help Groups to build self-sustained livelihoods.

    Challenges in Unemployment

    1. Survey design undercounts informal and rural work: Household surveys do not fully capture home-based, gig or platform work within the roughly 90 percent informal workforce, and rural labour force surveys have historically run at a lower frequency than urban ones. Eg. Rural Periodic Labour Force Survey (PLFS) data was measured only annually for years, while urban data was collected quarterly, understating rural distress in real time. Fix. Move rural PLFS to the same quarterly frequency as urban surveys and explicitly incorporate underemployment into the headline definition.
    2. Capital-intensive growth limits absorption: Investment has flowed disproportionately toward information technology and infrastructure rather than labour-intensive sectors capable of absorbing low and semi-skilled workers. Eg. Services now drive the largest share of GDP growth while employing under 30 percent of the workforce, the jobless growth pattern this op-ed’s wage-guarantee critique responds to. Fix. Direct incentive schemes toward labour-intensive sectors such as textiles, leather, food processing and electronics assembly rather than capital-intensive ones alone.

    Conclusion

    The piece argues that a wage-guarantee scheme with low enrolment is evidence that rural India’s underlying problem is a shortage of durable jobs, not a shortage of a temporary income floor, and that policy should shift resources toward sectors capable of generating sustained rural employment.

    Back2Basics: Periodic Labour Force Survey (PLFS)

    1. The PLFS is India’s principal household survey for estimating employment and unemployment, conducted by the National Sample Survey Office (NSSO) under the Ministry of Statistics and Programme Implementation (MoSPI).
    2. It reports unemployment on three measures: Usual Status (activity over the preceding year), Current Weekly Status, and Current Daily Status, the last of which best captures underemployment.
    3. It has historically surveyed urban areas quarterly but rural areas only annually, a frequency gap that limits its ability to track rural distress as it develops.

    “[2023, GS3, 15 marks] Most of the unemployment in India is structural in nature. Examine the methodology adopted to compute unemployment in the country and suggest improvements.”

  • Fair pricing could help sustain UPI network

    Fair pricing could help sustain UPI network

    Why in the News

    The op-ed, by a NITI Aayog consultant, argues that the zero-Merchant Discount Rate (MDR) regime underpinning Unified Payments Interface (UPI)‘s free-to-use model is financially unsustainable, and proposes a differentiated pricing structure as the Department of Financial Services examines whether to restore MDR for high-threshold transactions or merchants. The piece is pegged to a Parliamentary Standing Committee on Finance report tabled this month, which cited an industry estimate of about Rs 20,700 crore in annual UPI operating costs against a Rs 2,000 crore government allocation under the zero-MDR regime.

    What is the fiscal problem with UPI’s current pricing model, and what does the op-ed propose?

    1. The cost-subsidy gap is large and quantified: The Parliamentary Standing Committee on Finance’s report cited industry estimates of roughly Rs 20,700 crore in annual UPI operating costs, against a government allocation of only Rs 2,000 crore under the zero-MDR regime, with banks and payment companies absorbing the balance.
    2. Two restructuring options are formally under examination: The Department of Financial Services is examining restoring MDR for certain high-threshold transactions or merchants, and separately, phasing out government support through a tiered incentive structure.
    3. The op-ed’s proposed principle is differentiated, not uniform, pricing: It argues for keeping UPI free for consumers and small merchants while allowing a capped MDR for larger commercial users and higher-value transactions, on the basis that a uniform rate would be negligible for a large retailer but consequential for a street vendor.
    4. The author’s own research links merchant ecosystem formalisation to UPI adoption: Citing research with Sharon Buteau, the op-ed states that more formalised merchant ecosystems are associated with higher UPI use, and that MDR design should be calibrated to where acceptance networks are still developing rather than applied uniformly.
    5. Aggregated payment data is proposed as a second, non-MDR revenue and policy tool: The op-ed cites PhonePe’s PulsePro and a recent MoU with the Ministry of Electronics and Information Technology (MeitY) to integrate UPI transaction metrics into PM GatiShakti for infrastructure and economic planning, arguing that privacy-safe aggregated payment signals have public value independent of any pricing decision.

    Conclusion

    The op-ed’s position is that UPI’s zero-MDR model has reached a fiscal limit documented by Parliament’s own Standing Committee, and that a threshold-based, differentiated MDR, protecting small merchants and consumers while pricing larger commercial transactions, is a more sustainable path than either continuing an unfunded subsidy or imposing a uniform fee that would slow onboarding in less-formalised markets.

    Back2Basics

    1. Merchant Discount Rate (MDR): The fee a merchant pays to their bank or payment service provider for accepting digital payments, historically waived to zero on UPI and RuPay debit card transactions in India since January 2020 to encourage adoption.
    2. Unified Payments Interface (UPI): A real-time payment system developed by the National Payments Corporation of India (NPCI) that enables instant interbank transactions through a single mobile application.

    “[2023, GS3, 10 marks] What is the status of digitalization in the Indian economy? Examine the problems faced in this regard and suggest improvements.”

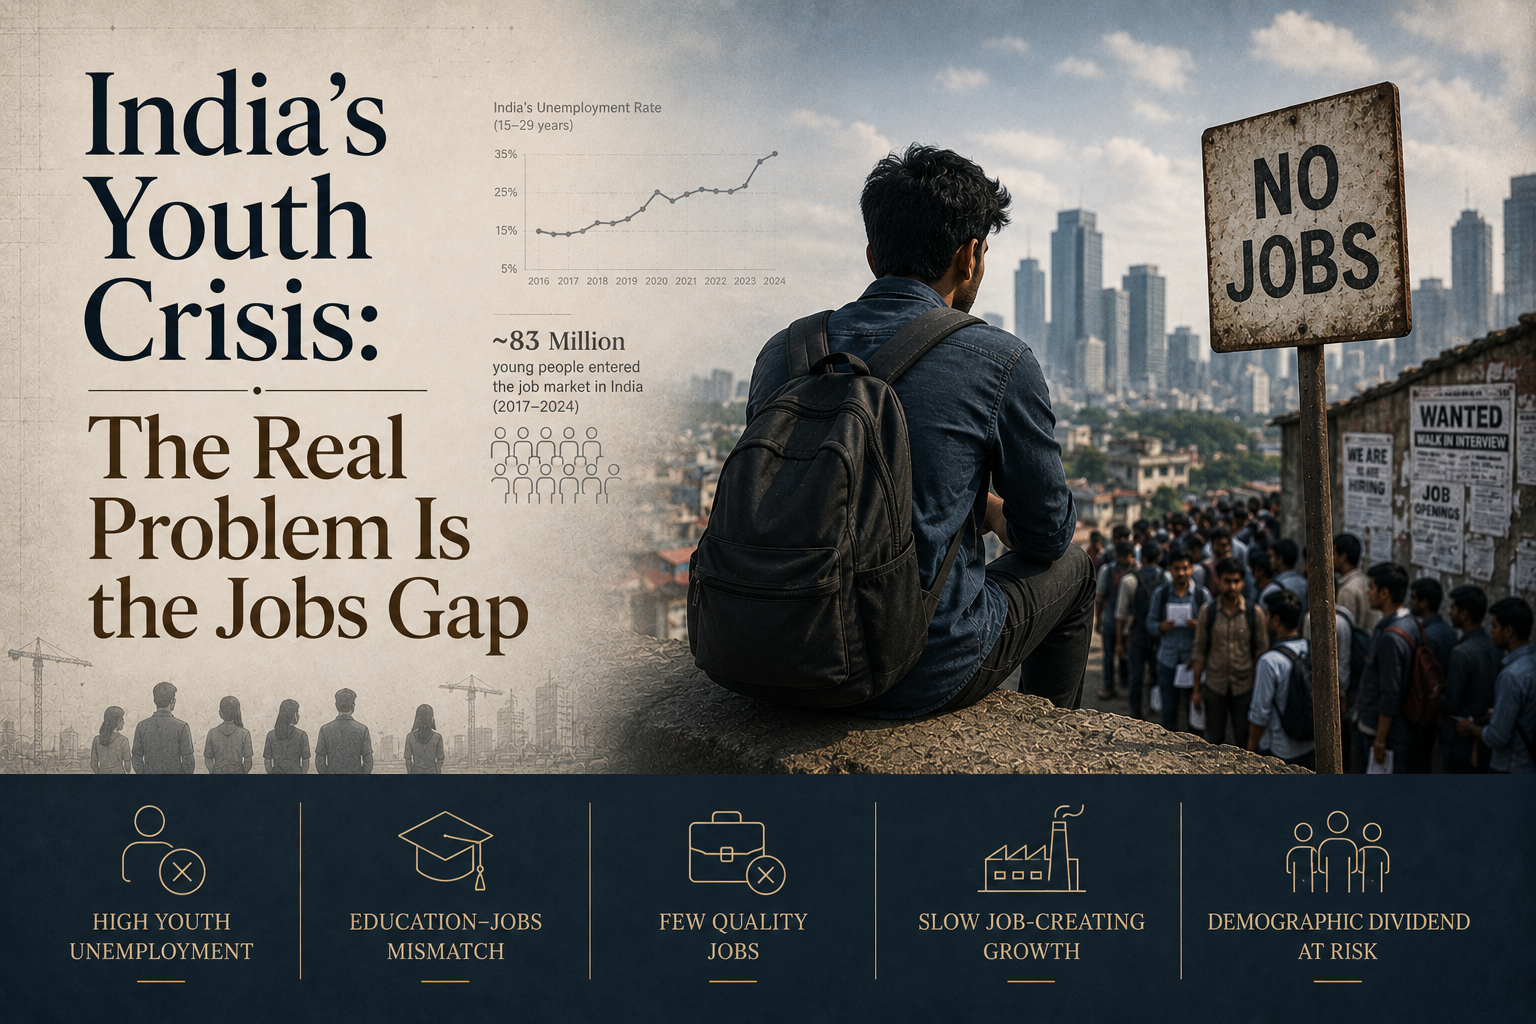
  • India’s youth crisis is about the absence of jobs, not just examination reform

    India’s youth crisis is about the absence of jobs, not just examination reform

    Question (2023, GS3): Most of the unemployment in India is structural in nature. Examine the methodology adopted to compute unemployment in the country and suggest improvements.
    Linkage: The editorial contends that youth agitations and demand for cheaper coaching address only the symptoms of the crisis, whereas the foundational issue is structural unemployment—the deep-seated absence of final job opportunities for qualified youths at the end of their preparation.

    Mentor comment

    The Hindu’s editorial argues that India’s youth unemployment problem is a jobs crisis, not merely an examination reform problem. The youth agitation that forced the resignation of the then Union Education Minister produced a government commitment to examination reform, including free online coaching for competitive examinations using India’s Digital Public Infrastructure. The editorial contends that cheaper coaching addresses only the preparation stage of the crisis, while the deeper problem is the absence of jobs at the end of that preparation.

    What does the data show about the scale of the crisis?

    1. Coaching costs have risen, not fallen: Private coaching now costs 16% of what an average Indian family spends on a child’s education, up from 12.5% in 2018. Nearly a quarter of that spending occurs during the higher secondary years, when students prepare for competitive examinations.
    2. Seat scarcity dwarfs coaching costs: Over 22 lakh candidates appeared for this year’s medical entrance examination for about 1.4 lakh undergraduate seats, with fewer than 10,000 of those seats at the top 50 colleges. The Joint Entrance Examination for engineering colleges shows a similar pattern.
    3. Undergraduate enrolment has fallen for the first time: For the first time since the All India Survey on Higher Education began in 2011, undergraduate enrolment fell by 93,322 in 2023-24, sharpest among young men.
    4. The fall is regionally concentrated: Uttar Pradesh recorded the steepest decline, with undergraduate enrolment down 1.53 lakh even as diploma enrolment rose 1.38 lakh, suggesting students are substituting away from degrees that do not lead to jobs.
    5. Formal, secure jobs remain rare among graduates: Periodic Labour Force Survey unit level data shows that of every 100 graduates aged 15 to 29 in 2025, only 26 held regular salaried employment, and only four held a salaried job with both a contract and social security.

    Why has growth not translated into jobs?

    1. Manufacturing has not absorbed graduates: Manufacturing, the sector best placed to absorb India’s college graduates, remains at around a sixth of gross value added, well short of the quarter of the economy the government has long promised.
    2. Private investment has retreated: Corporate investment fell from 17.3% of GDP in 2007-08 to 10.3% in 2024-25, unmoved by the cut in the corporate tax rate from 30% to 22% in 2019.
    3. Regulatory enforcement has turned selective: The editorial states that a regulatory and enforcement zeal that selectively targets enterprises has disproportionately affected medium sized companies, the segment best placed to generate jobs.

    Conclusion

    The youth employment crisis has two distinct ends: preparation for jobs, and the jobs themselves. Free coaching addresses only the first. The editorial’s position is that public investment in industrial capacity, export-disciplined industrial support, and a less selective regulatory posture toward medium sized enterprises would do more for youth employment than examination reform alone, citing Vietnam as a comparator that has used this route.