Note4Students
From UPSC perspective, the following things are important :
Prelims level: Women’s Reservation Bill.
Mains level: policies and initiatives aimed at promoting gender equity and inclusion

Central Idea:
The article highlights India’s commitment to gender equity and equality, emphasizing initiatives taken by both the government and industry to advance women’s empowerment. It discusses key achievements, challenges, and the launch of the ‘Alliance for Global Good – Gender Equity and Equality’ to drive inclusive development globally.
Key Highlights:
- India’s dedication to equality and inclusion as pillars of development, evidenced by initiatives like the New Delhi Leaders’ Declaration and the Women’s Reservation Bill.
- Increase in female participation in various sectors, including politics, education, and entrepreneurship.
- Launch of the ‘Alliance for Global Good – Gender Equity and Equality’ at the World Economic Forum, aiming to accelerate socio-economic progress on a global scale.
- India’s leadership in areas such as ed-tech, healthcare, and entrepreneurship, reflected in the Alliance’s goals.
- The Alliance’s partnership with stakeholders like the CII, Ministry of Women and Child Development, and the Bill and Melinda Gates Foundation, along with support from the World Economic Forum.
Key Challenges:
- Addressing persistent gender disparities in various sectors despite progress.
- Ensuring effective implementation of policies and initiatives to promote gender equity.
- Overcoming societal and cultural barriers that hinder women’s advancement.
- Mobilizing resources and sustaining momentum for inclusive development efforts.
- Encouraging broader global participation and collaboration to drive meaningful change.
Main Terms:
- Gender equity: Fair treatment and opportunities for all genders.
- Gender equality: Equal rights, responsibilities, and opportunities for all genders.
- Women’s empowerment: Enhancing women’s ability to access resources and participate fully in society.
- Inclusive development: Economic growth that benefits all segments of society, including marginalized groups.
- Stakeholders: Individuals or organizations with an interest or concern in a particular issue or initiative.
Important Phrases:
- “Women-led development”: Development initiatives driven by and focused on women’s empowerment.
- “Mainstreaming gender equality”: Integrating gender considerations into all aspects of policymaking and development efforts.
- “Shared direction”: Collaborative approach towards addressing gender-related challenges and promoting inclusion.
- “Vasudhaiva Kutumbakam”: Indian philosophy emphasizing the interconnectedness of all beings and the world.
- “Sabka Saath, Sabka Prayaas, Sabka Vikaas”: Indian motto promoting inclusive development for all.
Quotes:
- “Equality and inclusion are the cornerstones of India’s development journey.”
- “The enthusiasm around the We-Lead Lounge… saw global interest and curiosity.”
- “India’s abiding commitment to ‘Vasudhaiva Kutumbakam – One Earth, One Family, One Future’.”
Anecdotes:
- Success stories in space exploration, sports, entrepreneurship, and UN peacekeeping operations highlight India’s achievements and influence.
- The We-Lead Lounge at Davos served as a platform for meaningful discussions on inclusive development.
Useful Statements:
- “The Alliance for Global Good – Gender Equity and Equality aims to drive collective actions to augment women empowerment.”
- “India’s leadership in areas such as ed-tech and healthcare makes it a key contributor to global development efforts.”
- “Industry has an opportunity to invest in proven programs and initiatives to advance gender inclusion in the workspace.”
Examples and References:
- Passage of the Women’s Reservation Bill and increased female labor force participation rates.
- Participation of over nine crore women in self-help groups in rural India.
- India’s digital prowess and leadership in healthcare, highlighted through initiatives like the Alliance for Global Good.
Facts and Data:
- Increase in India’s female labor force participation rate from 23.3% in 2017-18 to 37% in 2022-23.
- Allocation of nearly $27 billion under the gender budget in 2023-24.
- Female enrollment in STEM courses at 43%.
- Participation of over nine crore women in self-help groups in rural India.
Critical Analysis:
- The article showcases India’s progress in promoting gender equity but also acknowledges ongoing challenges.
- It emphasizes the importance of collaboration between government, industry, and other stakeholders to drive meaningful change.
- While highlighting achievements, it also recognizes the need for sustained efforts to address persistent gender disparities.
Way Forward:
- Strengthening implementation of policies and initiatives aimed at promoting gender equity and inclusion.
- Continued investment in programs and initiatives to support women’s empowerment across various sectors.
- Enhancing global collaboration and partnerships to drive inclusive development efforts.
- Addressing societal and cultural barriers through awareness campaigns and education.
- Monitoring and evaluation of progress to ensure accountability and sustainability in gender-related initiatives.
Get an IAS/IPS ranker as your 1: 1 personal mentor for UPSC 2024
Attend Now
Note4Students
From UPSC perspective, the following things are important :
Prelims level: Indian STEM fields
Mains level: Launch of SWATI portal in 2024

Central Idea:
The article discusses the efforts of Indian science academies to address the gender gap in STEM fields, focusing on initiatives such as the launch of the SWATI portal. It highlights the evolution of these efforts, challenges faced, and the need for more inclusive and effective strategies.
Key Highlights:
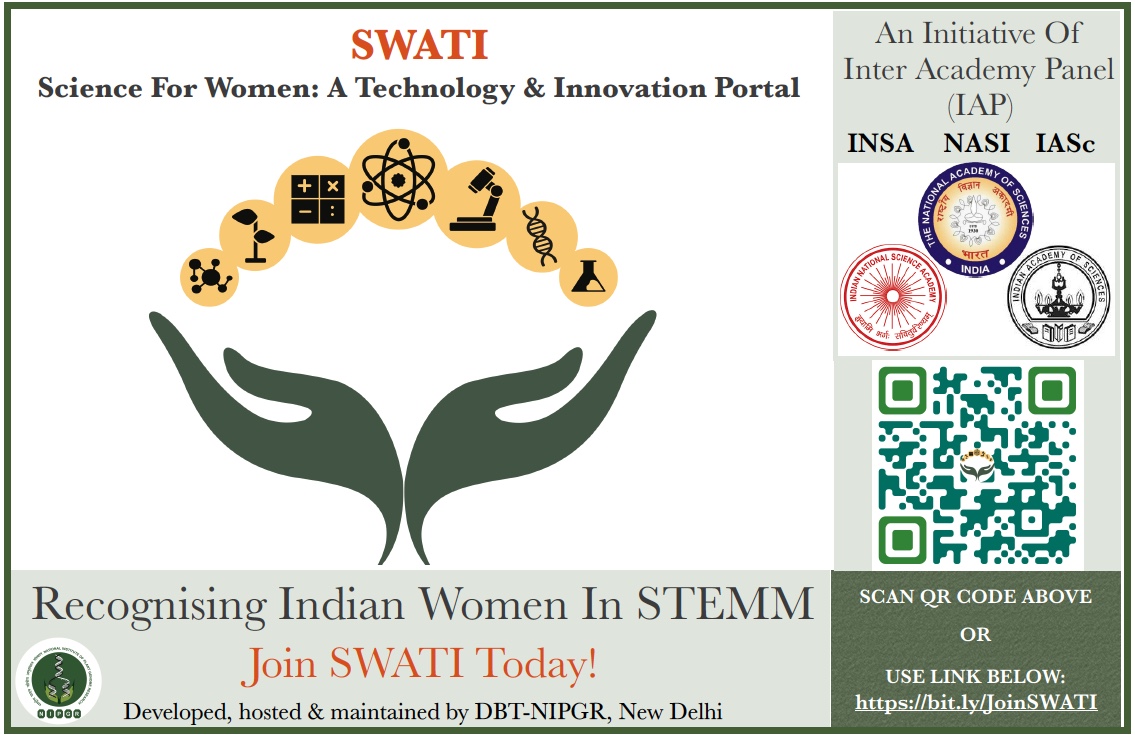
- Launch of SWATI portal by Indian science academies to create a database of women in science.
- Evolution of initiatives starting from the INSA report in 2004, highlighting discrimination and proposing solutions.
- Efforts like Lilavati’s Daughters compendium and national conferences to address gender gap issues.
- Gendered perceptions uncovered by sociologists and scientists regarding women leaving academia.
- Critique of initiatives focusing solely on “fixing” women instead of addressing systemic issues.
- Newer policies like GATI charter and STIP 2020 adopting more progressive language and inclusive approaches.
- Concerns about the effectiveness and sustainability of new initiatives like SWATI.
Key Challenges:
- Deep-rooted discrimination based on gender, caste, transgender identity, and disability.
- Lack of accountability for addressing systemic issues within the scientific community.
- Need for rules and laws to ensure gender equity and address unique challenges faced by marginalized groups.
- Risk of new initiatives losing momentum and failing to deliver on promises.
Main Terms:
- Gender gap: Disparity between men and women in STEM fields.
- Discrimination: Unfair treatment based on gender, caste, or other factors.
- Gender equity: Fair treatment regardless of gender.
- Inclusive policies: Strategies that consider diverse identities and experiences.
- STEM: Science, Technology, Engineering, and Mathematics.
Important Phrases:
- “Gender gap in STEM”
- “Discrimination in the workplace”
- “Systemic issues”
- “Inclusive group”
- “Gendered perceptions”
Quotes:
- “It is the females who need to be ‘fixed.'”
- “Equity is not just a women’s issue.”
Anecdotes:
- Launch of SWATI portal on International Day for Girls and Women in Science.
- Announcement of promises by then Science and Technology Minister Kapil Sibal at a national conference in 2008.
Useful Statements:
- “Initiatives focusing solely on ‘fixing’ women overlook systemic issues.”
- “Newer policies like GATI charter and STIP 2020 adopt more progressive language.”
Examples and References:
- Indian National Science Academy (INSA) report in 2004.
- Lilavati’s Daughters compendium by the Indian Academy of Sciences (IASc).
- Launch of SWATI portal in 2024.
Facts and Data:
- Collaboration between scientists and social scientists in the INSA report in 2004.
- Survey of about 800 scientists revealing gendered perceptions in academia.
- Announcement of promises for women scientists by Kapil Sibal in 2008.
Critical Analysis:
The article provides a comprehensive overview of efforts to address the gender gap in Indian STEM fields, highlighting both progress made and persistent challenges. It critiques initiatives that focus solely on individual women without addressing systemic issues and emphasizes the need for more inclusive and effective strategies.
Way Forward:
- Implement and monitor policies that address discrimination and promote gender equity.
- Engage diverse stakeholders, including marginalized groups, in policy development and implementation.
- Ensure transparency and accountability in initiatives like SWATI to maintain momentum and effectiveness.
- Foster a culture of inclusivity and support within the scientific community to retain and empower women in STEM.
Get an IAS/IPS ranker as your 1: 1 personal mentor for UPSC 2024
Attend Now
Note4Students
From UPSC perspective, the following things are important :
Prelims level: India's Kaladan Multi-Modal Transit Transport Project in Rakhine State
Mains level: complexities surrounding the Indian-Myanmar border situation
.jpg)
Central Idea:
The article discusses the complex situation at the Indian-Myanmar border, particularly in Mizoram, highlighting the influx of Myanmar soldiers seeking refuge and the growing influence of rebel groups. It also examines India’s response to these developments, focusing on the challenges posed by border security, economic interests, and diplomatic considerations.
Key Highlights:
- Refugee Crisis: Myanmar soldiers fleeing conflict in Chin State seek refuge in Mizoram, exacerbating tensions at the border.
- Rebel Advancements: Rebel groups, such as the Chin National Army and the Arakan Army, gain control over significant territories along the border, challenging the authority of the Myanmar government.
- Indian Response: India grapples with the security implications of the border situation, considering measures like building fences and ending the Free Movement Regime (FMR).
- Economic Interests: India’s economic interests in Myanmar, particularly in rebel-held areas like Rakhine State, necessitate a cautious approach amid escalating conflict.
- Diplomatic Dynamics: India’s policies in the region are influenced by considerations of regional stability, cooperation with Myanmar’s government, and competing interests with China.
Key Challenges:
- Security Concerns: India faces challenges in maintaining border security amidst escalating conflict and infiltration by armed groups.
- Economic Implications: Balancing economic interests with security concerns poses a dilemma for Indian policymakers.
- Diplomatic Complexity: India must navigate diplomatic relations with Myanmar while considering regional dynamics and competition with China.
- Social Impact: Measures like ending the Free Movement Regime may strain familial and tribal ties across the border, potentially leading to social unrest.
Main Terms:
- Rebel Groups
- Free Movement Regime (FMR)
- Border Security
- Refugee Crisis
- Economic Interests
- Regional Stability
Important Phrases:
- “Liberated zones”
- “Border fencing”
- “Neighbourhood First”
- “Act East”
- “Arakan Army surged”
Quotes:
- “We were surprised by how quickly the army posts fell.”
- “…the kinship and tribal ties are such that they will not be curbed by the measures.”
- “Neither China nor India are likely to change their current policies till such a viable process is in place.”
Useful Statements:
- “Calls for fencing the border have been strongest from the beleaguered Chief Minister of Manipur.”
- “India has not retreated from its support to the army dispensation in Myanmar.”
- “Rebel armed groups, some of which have been fighting the Myanmar army for over 70 years, are unlikely to be able to march on the capital of Naypyidaw.”
Examples and References:
- Chin National Army’s control over Chin State.
- Arakan Army’s campaign in Paletwa.
- India’s Kaladan Multi-Modal Transit Transport Project in Rakhine State.
Facts and Data:
- Chin refugees sheltering in Mizoram after the 2021 coup in Myanmar.
- India’s eastern border with Myanmar.
- Proposal to end the Free Movement Regime allowing movement up to 16 km across borders.
Critical Analysis:
The article provides a nuanced understanding of the complexities surrounding the Indian-Myanmar border situation, emphasizing the interconnectedness of security, economic, and diplomatic factors. It highlights the challenges faced by India in maintaining stability in the region amidst escalating conflict and competing interests with China.
Way Forward:
- India should adopt a balanced approach that prioritizes both security and economic interests.
- Diplomatic engagement with Myanmar should focus on promoting stability and addressing the root causes of conflict.
- Efforts to secure the border should be accompanied by measures to mitigate social and economic impacts on border communities.
Overall, a comprehensive strategy that considers the multifaceted nature of the border situation is essential for India to effectively navigate the challenges and opportunities presented by its eastern frontier with Myanmar.
Get an IAS/IPS ranker as your 1: 1 personal mentor for UPSC 2024
Attend Now
Note4Students
From UPSC perspective, the following things are important :
Prelims level: na
Mains level: detrimental effects of the booming coaching industry on students
Central Idea:
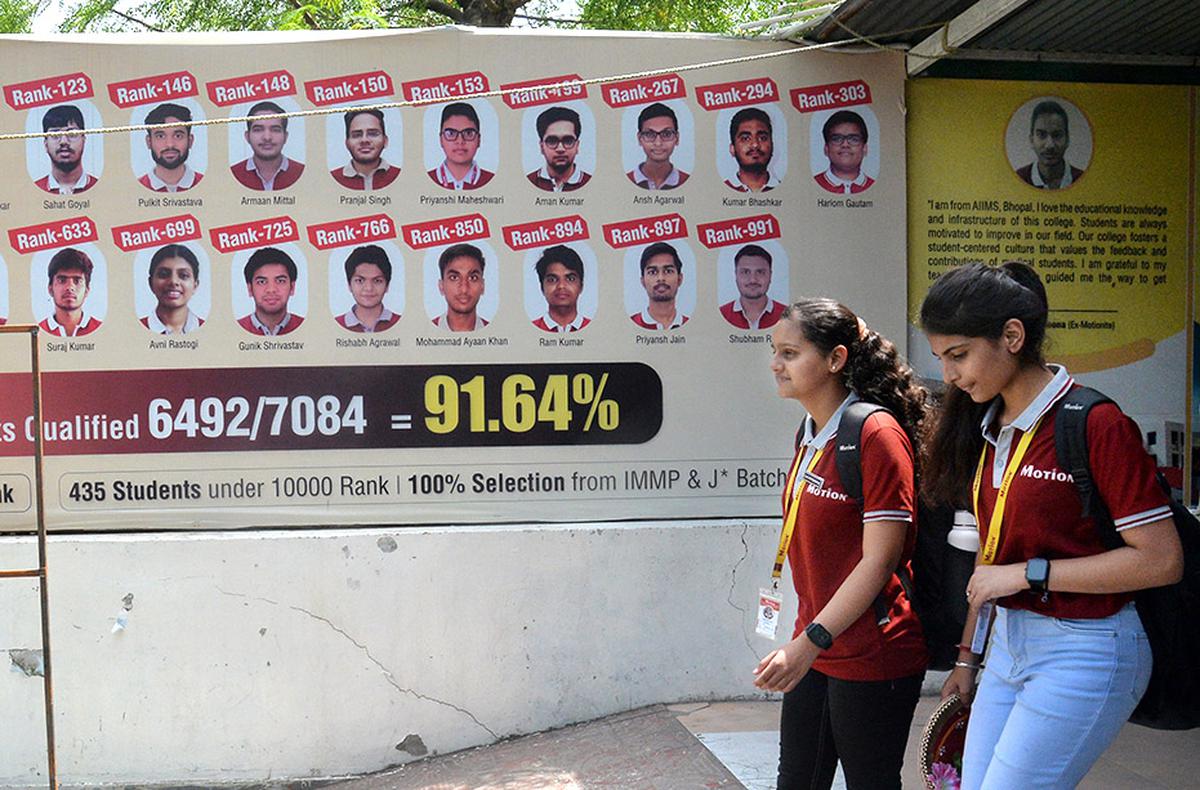
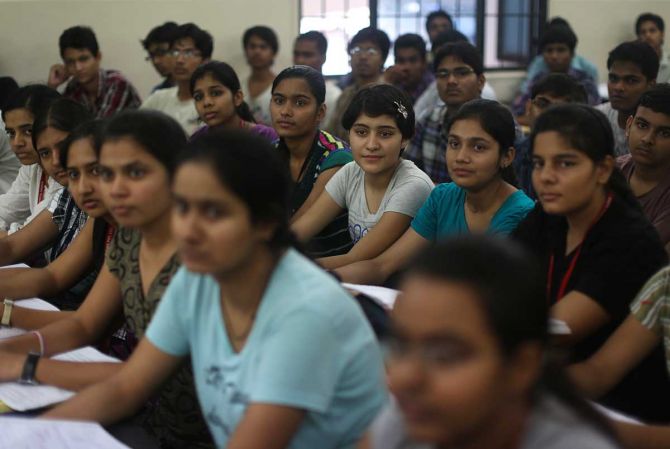
The article discusses the detrimental effects of the booming coaching industry on students’ mental health, educational values, and overall well-being. It emphasizes the need for a shift in focus towards holistic education and the nurturing of students’ inner needs.
Key Highlights:
- Concerns regarding the negative impact of the coaching industry on students’ welfare, leading to suicides and academic disengagement.
- Rise of coaching centres catering to various competitive exams, resulting in students abandoning traditional schooling.
- Lack of policy support for students beyond school, allowing coaching centres to become dominant in shaping students’ education.
- The importance of addressing mental health, learning, and understanding in education, as highlighted in the National Education Policy.
- Critique of the coaching culture for neglecting essential aspects such as sleep, social interaction, and identity development.
- Emphasis on the role of education in understanding and catering to the diverse needs and aspirations of students.
- Advocacy for a shared vision where student well-being is prioritized over mere academic achievement.
Key Challenges:
- Balancing the pressure for academic success with the need for holistic development.
- Overcoming the entrenched influence of coaching centres on students and parents.
- Realigning educational priorities to focus on mental health and emotional well-being.
- Addressing societal expectations that contribute to stress and false expectations among students.
- Encouraging collaboration between schools, parents, and policymakers to foster a supportive educational environment.
Main Terms:
- Coaching industry
- Competitive exams (e.g., NEET, JEE, CUET)
- Mental health
- Holistic education
- National Education Policy
- Identity development
- Academic pressure
- Emotional stability
- Well-being
- Co-agency
Important Phrases:
- “Children are not machines”
- “The role of education”
- “True education is value imparting”
- “Learning is a process”
- “Obsession with coaching”
- “Holistic development”
Quotes:
- “Children are walking away from classroom teaching into coaching centres, often with parental support.”
- “The obsession with coaching will never be able to validate and strengthen new ideas, approaches, and research, required for human flourishing.”
- “Students go to school to become purposeful, reflective, and responsible.”
Useful Statements:
- “If coaching centres are going to be the foundation of these years, then the youth of today will become directionless.”
- “Children suffer from anxiety and are unable to cope.”
- “As a country, we need a shared vision, where well-being is the goal of education and co-agency is a guiding light.”
Examples and References:
- Rise of coaching centres like Kota, which have become parallel systems to traditional schooling.
- Concerns about students opting for dummy schools to focus solely on coaching, neglecting the value of classroom education.
Facts and Data:
- The coaching industry generates Rs 6,000 crore annually and is growing at a rate of 7-10% per year.
- Instances of student suicides linked to academic pressure and coaching culture.
Critical Analysis:
The article effectively critiques the dominance of the coaching industry and highlights the need for a more holistic approach to education. It exposes the negative consequences of prioritizing academic achievement over students’ mental health and overall well-being. However, it could provide more concrete suggestions for addressing these issues and overcoming the challenges posed by the coaching culture.
Way Forward:
- Implement guidelines and regulations for coaching centres to ensure student welfare.
- Strengthen support systems for students beyond academics, focusing on mental health and emotional development.
- Promote collaboration between schools, parents, and policymakers to create a nurturing educational environment.
- Encourage a shift in societal attitudes towards education, valuing holistic development over narrow academic success.
Get an IAS/IPS ranker as your 1: 1 personal mentor for UPSC 2024
Attend Now
Note4Students
From UPSC perspective, the following things are important :
Prelims level: na
Mains level: implementation of a Uniform Civil Code in Uttarakhand

Central Idea:
The enactment of the Uniform Civil Code (UCC) in Uttarakhand marks a significant milestone in India, yet it has sparked controversy due to provisions requiring the registration of live-in relationships. This move, while aiming to address concerns over crimes against live-in couples, has raised questions about privacy, personal liberty, and the sanctity of informal relationships.
Key Highlights:
- Uttarakhand becomes the first state to implement a Uniform Civil Code under Article 44 of the Constitution.
- The UCC applies uniformly across religions, excluding tribal populations.
- Controversial provisions mandate the registration of live-in relationships, blurring the line between informal unions and formal marriages.
- Critics argue that such provisions infringe upon personal freedom and privacy rights.
- The law requires partners to register their relationship with the registrar and imposes penalties for non-compliance.
- The Code extends maintenance rights to women deserted by their live-in partners, similar to married women.
- Children born in live-in relationships are recognized as legitimate under the proposed law.
- The UCC applies to Uttarakhand residents both within the state and elsewhere in India.
Key Challenges:
- Lack of sufficient discussion and debate in the state legislature and among communities.
- Potential infringement on individual privacy and personal liberty.
- Criminalization of non-registration and stringent penalties may discourage young couples from opting for live-in relationships.
- Misuse of provisions by the registrar and societal interference.
- Potential infantilization of adult women and erosion of the purpose of informal unions.
Main Terms:
- Uniform Civil Code (UCC): A set of laws aimed at standardizing personal laws across different religious communities in India.
- Live-in Relationship: Cohabitation between partners without formal marriage.
- Registration: Formal documentation of a live-in relationship with the registrar.
- Maintenance: Financial support provided by one partner to another after separation or desertion.
- Legitimate Child: A child born to parents in a legally recognized relationship.
- Summary Inquiry: An expedited investigation conducted by the registrar to validate live-in relationships.
Important Phrases:
- “Relationship in the nature of marriage”: Describes the criteria for a live-in relationship under the UCC.
- “Deserted by her live-in partner”: Refers to the condition for claiming maintenance under the proposed law.
- “Summary inquiry”: Procedure conducted by the registrar to validate live-in relationships.
Quotes:
- “Concerns over heinous crimes among live-in couples” – State official citing the rationale behind registration provisions.
- “Protection of youngsters is also important” – Official highlighting the intention to safeguard individuals, particularly women.
- “When women in relationships ‘in the nature of marriage’ complain of domestic violence, they are entitled to claim maintenance” – Highlighting existing legal provisions for protection.
Anecdotes:
- Reports of incidents influencing public opinion during expert committee consultations.
- Concerns raised by parents and elders during public consultations regarding the need for legal protection.
Useful Statements:
- The registration requirement may erode the autonomy of individuals in choosing their relationship structures.
- Existing legal frameworks, such as the Domestic Violence Act, already provide protection for individuals in live-in relationships.
- The provision for summary inquiries by registrars raises concerns about potential misuse and infringement on privacy rights.
Examples and References:
- Instances of crimes against live-in couples cited as driving factors behind registration provisions.
- Comparisons drawn between the UCC’s treatment of live-in relationships and existing marriage laws.
Facts and Data:
- Uttarakhand is the first state to enact a Uniform Civil Code.
- Penalties for non-registration and desertion in live-in relationships include fines and imprisonment.
- The UCC extends maintenance rights to women in live-in relationships.
Critical Analysis:
- The UCC’s registration requirements may contradict the essence of informal unions and infringe upon personal liberties.
- Concerns over misuse of provisions by authorities and societal interference raise questions about the law’s effectiveness and fairness.
- The proposed UCC may fail to address the root causes of crimes against live-in couples and could deter individuals from opting for such relationships.
Way Forward:
- Engage in comprehensive discussions and debates to address concerns and refine provisions of the UCC.
- Ensure that laws prioritize individual freedoms while providing necessary protections.
- Consider alternative approaches to addressing crimes against live-in couples, focusing on prevention and support mechanisms rather than punitive measures.
In conclusion, while the implementation of a Uniform Civil Code in Uttarakhand signifies progress towards legal standardization, provisions regarding the registration of live-in relationships raise complex issues regarding privacy, personal liberty, and the sanctity of informal unions. It is imperative to address these concerns through informed dialogue and thoughtful policymaking to strike a balance between protection and individual autonomy.
Get an IAS/IPS ranker as your 1: 1 personal mentor for UPSC 2024
Attend Now
Note4Students
From UPSC perspective, the following things are important :
Prelims level: na
Mains level: comprehensive overview of the evolving India-UAE relationship

Central Idea:
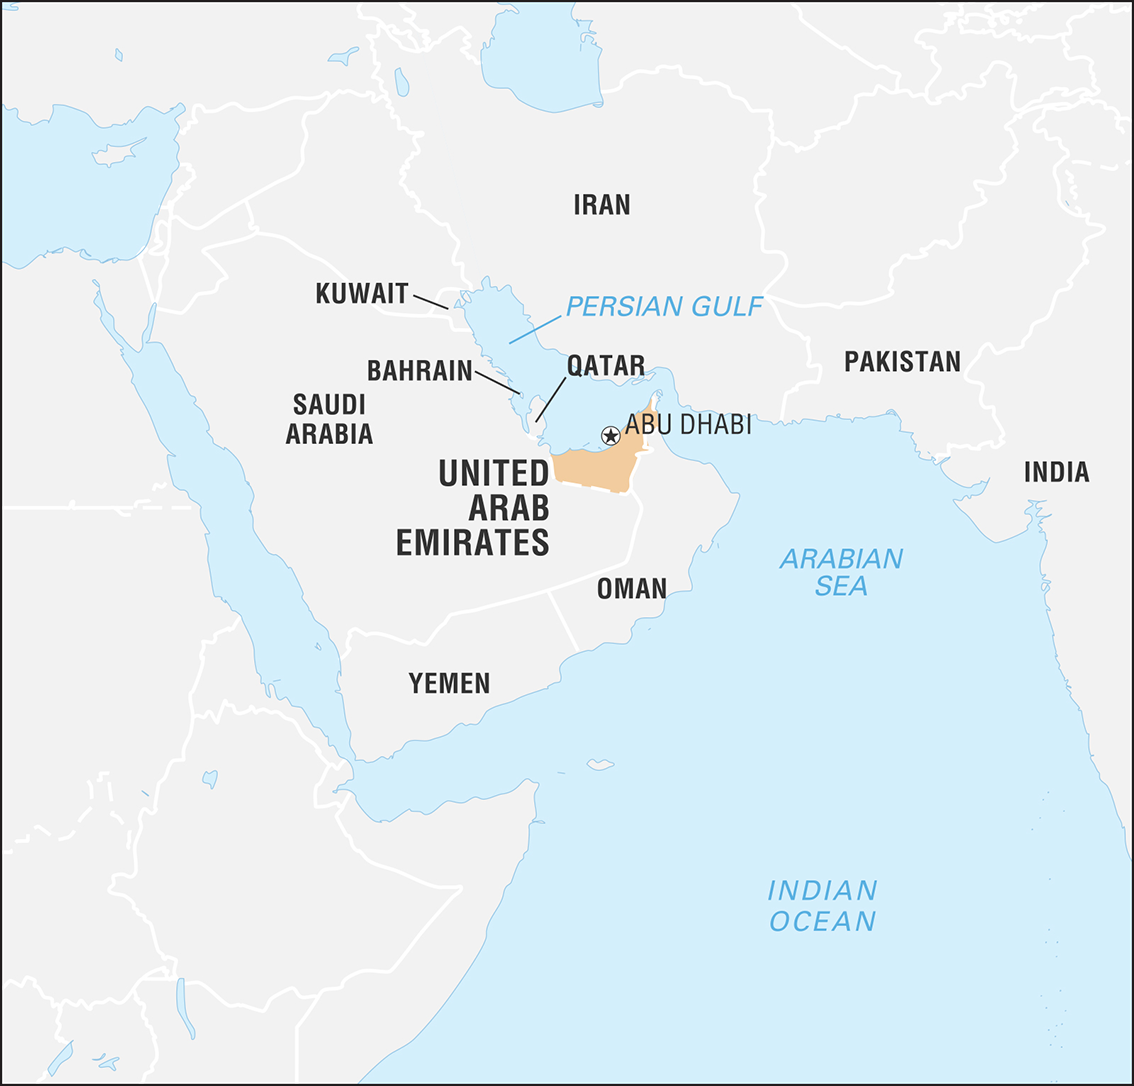
The article highlights the deepening and multifaceted relationship between India and the United Arab Emirates (UAE), focusing on various aspects such as economic ties, strategic partnerships, cultural exchanges, and shared interests in global affairs.
Key Highlights:
- Prime Minister Narendra Modi’s upcoming visit to the UAE signifies the strengthening of bilateral relations, marked by frequent high-level engagements.
- The inauguration of the BAPS temple in Abu Dhabi underscores the growing acceptance and promotion of cultural diversity in the UAE.
- Economic cooperation between India and the UAE has surged, with bilateral trade reaching $85 billion and significant investments in various sectors.
- The UAE is a key partner for India in areas such as energy security, defense cooperation, and people-to-people ties.
- Both countries have demonstrated exceptional gestures of friendship and cooperation, despite regional complexities and geopolitical challenges.
- Strategic collaborations extend beyond bilateral relations to include participation in international forums and infrastructure projects.
![Burning Issue] India-UAE Relations - Civilsdaily](https://d18x2uyjeekruj.cloudfront.net/wp-content/uploads/2022/02/bilateral.png)
Key Challenges:
- Despite strong ties, there may be occasional divergences in interests and priorities between India and the UAE.
- Regional conflicts and geopolitical tensions could pose challenges to the stability of the bilateral relationship.
- Maintaining momentum in economic cooperation and addressing barriers to trade and investment require continued efforts.
- Balancing relations with other regional actors, especially in the context of the Middle East, remains a delicate task for both countries.
Main Terms:
- Bilateral Relations: Mutual interactions and agreements between two countries.
- Economic Partnership: Collaborative efforts to enhance trade, investment, and economic cooperation.
- Strategic Cooperation: Joint efforts to address common security challenges and pursue shared interests.
- Cultural Exchange: Promotion of cultural understanding and appreciation through mutual exchanges.
- Energy Security: Ensuring stable and reliable access to energy resources.
- Global Leadership: A position of influence and responsibility in shaping international affairs.
Important Phrases:
- “Strategic partnership agreements”
- “Global leadership role”
- “Economic engagement”
- “Cultural diplomacy”
- “Mutual respect”
- “Strategic cooperation”
- “International forums”
- “Geopolitical challenges”
Quotes:
- “India-UAE relationship is one of the most prominent bilateral relationships for New Delhi.”
- “The UAE is India’s trusted partner in energy security.”
- “Both countries recognise that this privileged strategic partnership is only set to grow stronger in the years ahead.”
Anecdotes:
- Prime Minister Narendra Modi’s reception at the World Government Summit in Dubai as the ‘Guest of Honour’.
- Conferment of the UAE’s top civilian honour, the Order of Zayed, upon Prime Minister Modi during his visit to the UAE.
- India’s participation in the Abu Dhabi Festival as the ‘Guest of Honour’ in 2018.
Useful Statements:
- “The visit underscores the deepening ties and mutual cooperation between India and the UAE.”
- “Both countries have demonstrated exceptional gestures of friendship and cooperation.”
- “The bilateral relationship faces challenges but remains resilient.”
Examples and References:
- India-UAE Comprehensive Economic Partnership Agreement
- Participation in international forums like the G-20 summit
- Establishment of IIT Delhi Abu Dhabi campus and UAE consulate in Hyderabad
Facts and Data:
- Bilateral trade between India and the UAE reached $85 billion in 2022-23.
- India’s export destination: UAE is the second-largest.
- UAE is India’s third-largest trading partner.
Critical Analysis:
The article provides a comprehensive overview of the evolving India-UAE relationship, highlighting its strategic, economic, and cultural dimensions. It underscores the significance of the partnership amidst regional complexities and global challenges. However, it also acknowledges potential areas of divergence and the need for sustained efforts to overcome them.
Way Forward:
- Strengthening economic cooperation through trade facilitation and investment promotion.
- Enhancing strategic collaboration in areas of mutual interest, including defense and energy security.
- Deepening cultural ties through continued exchanges and collaborative initiatives.
- Addressing regional challenges through constructive dialogue and diplomacy.
- Leveraging the privileged partnership to contribute positively to global issues and regional stability.
Get an IAS/IPS ranker as your 1: 1 personal mentor for UPSC 2024
Attend Now
Note4Students
From UPSC perspective, the following things are important :
Prelims level: Merchant Sales
Mains level: India's ambitious renewable energy targets and the challenges associated with intermittency and peak demand
Get an IAS/IPS ranker as your 1: 1 personal mentor for UPSC 2024
Attend Now
Note4Students
From UPSC perspective, the following things are important :
Prelims level: Indian Ocean Rim Association (IORA)
Mains level: India's historical maritime prowess and its subsequent decline
6AIR.jpeg)
Central Idea:
The article highlights the historical significance of India’s maritime prowess in the first millennium and its subsequent decline, emphasizing the crucial role of naval power in economic prosperity. It underscores the shift of global power dynamics towards the Indo-Pacific region and the vital importance of the Indian Ocean to India’s trade and security interests. It calls for renewed attention towards leveraging India’s maritime potential and fostering cooperation among Indian Ocean nations to address common challenges.
Key Highlights:
- India’s dominance in the first millennium attributed to maritime strength and extensive trade networks.
- Decline in naval power coincided with economic decline during colonial rule.
- Lack of focus on maritime affairs persists post-independence, hindering India’s maritime capabilities.
- Indo-Pacific region emerges as the new global power center.
- Indian Ocean identified as vital to India’s trade and energy security.
- Indian government takes proactive steps to enhance cooperation and address common challenges in the Indian Ocean region.
Key Challenges:
- Historical neglect of maritime affairs leading to underdevelopment of naval capabilities.
- Competition from other major maritime powers like the United States and China.
- Non-traditional challenges such as climate change and natural disasters impacting maritime security and trade.
Main Terms:
- Maritime prowess
- Indo-Pacific
- Indian Ocean
- Naval power
- Trade routes
- Maritime security
Important Phrases:
- “He who rules on the sea will shortly rule on the land also”
- “Lords of the Sea”
- “Peninsular character”
- “British Lake”
Quotes:
- “He who rules on the sea will shortly rule on the land also.”
- “So far as India is concerned, it should be remembered that the peninsular character of the country and the essential dependence of its trade on maritime traffic give the sea a preponderant influence on its destiny.” – K M Panikkar
Anecdotes:
- Indian rulers’ dominance over the oceans in the first millennium facilitated extensive trade networks and economic prosperity.
- The Portuguese, Dutch, French, and British conquest of the seas in the second millennium challenged India’s maritime dominance.
Useful Statements:
- The Indian Ocean is not just a maritime geography but a civilization, carrying India’s cultural and civilizational influence.
- Eighty per cent of India’s external trade and 90 per cent of its energy trade occur through Indian Ocean routes.
Examples and References:
- Indian Ocean Rim Association (IORA)
- Fa-Hien’s account of maritime trade in ancient India.
- Establishment of the Royal Indian Navy during British rule.
- K M Panikkar’s warnings about India’s maritime importance.
- The 7th Indian Ocean Conference in Perth, Australia.
Facts and Data:
- India’s share of the world’s GDP was almost 33 per cent in the first millennium.
- The Indian Ocean covers over 74 million square kilometers.
- The Indian Navy has less than 200 combat vessels compared to 400 for the United States and 500 for China.
Critical Analysis:
The article effectively highlights India’s historical maritime prowess and its subsequent decline, emphasizing the importance of reinvigorating India’s naval capabilities in the modern context. It critiques the historical neglect of maritime affairs by Indian leadership and calls for greater attention towards leveraging India’s geostrategic position in the Indo-Pacific region.
Way Forward:
- Prioritize investments in maritime infrastructure and naval capabilities.
- Strengthen cooperation with Indian Ocean nations to address common challenges.
- Increase diplomatic engagement in the Indo-Pacific region.
- Enhance awareness and appreciation of India’s maritime heritage and geopolitical significance among policymakers and the public.
Get an IAS/IPS ranker as your 1: 1 personal mentor for UPSC 2024
Attend Now
Note4Students
From UPSC perspective, the following things are important :
Prelims level: Mandal Commission report
Mains level: comprehensive analysis of the forces that have shaped India's trajectory since the early 1990s
Central Idea:
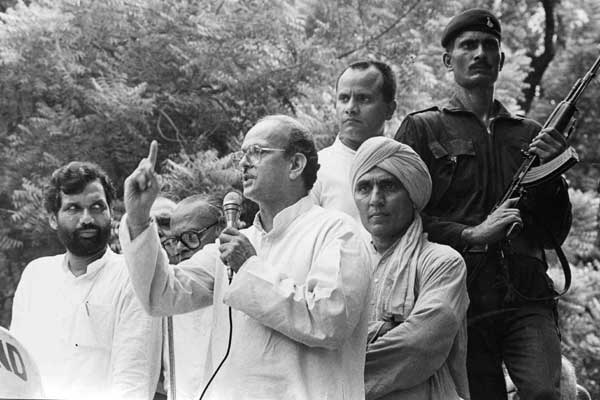
The article discusses the three pivotal forces that shaped contemporary India – Mandal, Mandir, and Market, which were unleashed between August 1990 and August 1991. It highlights the significance of these forces in defining India’s trajectory and how they continue to influence the country’s politics, economy, and society today. Furthermore, it focuses on the forgotten legacy of Prime Minister P.V. Narasimha Rao, who played a crucial role in implementing economic reforms and reshaping India’s foreign policy during his tenure from 1991 to 1996. The article underscores the importance of trusting society over the state, the necessity of liberalization for welfare schemes, and the harmony embedded in Indian civilization, as exemplified by Narasimha Rao’s approach.
Key Highlights:
- Mandal, Mandir, and Market as defining forces in contemporary India.
- Significance of the Ram temple movement and the Mandal Commission report.
- P.V. Narasimha Rao’s pivotal role in liberalizing India’s economy and reorienting its foreign policy.
- Lessons from Narasimha Rao’s leadership: trusting society, liberalization-led growth, and harmony in Indian civilization.
Key Challenges:
- Balancing economic liberalization with social welfare and inclusive growth.
- Addressing religious and social tensions in a diverse society.
- Overcoming political opposition and vested interests to implement reforms.
Main Terms:
- Mandal: Refers to the implementation of backward caste quotas in government jobs.
- Mandir: Symbolizes the movement for the construction of a Ram temple in Ayodhya.
- Market: Represents the liberalization of India’s economy, opening it up to globalization and private sector participation.
- Bharat Ratna: India’s highest civilian honor.
- Liberalization: The process of reducing government restrictions and regulations in the economy.
- Globalization: Integration of economies and societies through international trade, investment, and technology.
Important Phrases:
- “Mandal, Mandir, and Market continue to define India.”
- “Narasimha Rao actively plotted to open India’s economy to the world.”
- “India grows best when politicians trust society rather than the state.”
- “Liberalization-led growth is a precondition for welfare schemes.”
- “Harnessing the harmony embedded in Indian civilization.”
Quotes:
- “India grows best when politicians trust society rather than the state.”
- “My model is not Margaret Thatcher but Willy Brandt.”
- “Why are there only Western examples being given where violence — on some pretext or the other — is the basic propensity.”

Anecdotes:
- L.K. Advani’s rath yatra from Somnath to Ayodhya symbolized BJP’s alignment with the Ram temple movement.
- Narasimha Rao’s astute political maneuvering to implement economic reforms despite opposition from within his own party.
Useful Statements:
- “Narasimha Rao’s reforms were not confined to economics alone.”
- “India grows best when politicians trust society rather than the state.”
- “Liberalization-led growth is a precondition for welfare schemes.”
Examples and References:
- Implementation of backward caste quotas in government jobs following the Mandal Commission report.
- L.K. Advani’s rath yatra as a symbol of BJP’s support for the Ram temple movement.
- Narasimha Rao’s economic reforms leading to increased tax revenue, enabling government spending on welfare schemes.
Facts and Data:
- P.V. Narasimha Rao served as Prime Minister of India from 1991 to 1996.
- The Ram temple movement gained momentum in the early 1980s.
- Economic liberalization measures were initiated in mid-1991.
Critical Analysis:
The article presents a comprehensive analysis of the forces that have shaped India’s trajectory since the early 1990s, focusing on both political and economic dimensions. It highlights the role of leaders like Narasimha Rao in driving significant reforms despite facing numerous challenges. However, it also acknowledges the shortcomings and failures of political leadership, particularly in handling religious and social tensions. The emphasis on trust in society, liberalization-led growth, and harmony reflects a nuanced understanding of India’s complex socio-political landscape.
Way Forward:
- Emphasize continued trust in society over excessive state intervention.
- Prioritize economic liberalization to enable inclusive growth and welfare schemes.
- Promote harmony and understanding among diverse religious and cultural communities.
- Encourage political leadership to learn from past successes and failures to navigate future challenges effectively.
Get an IAS/IPS ranker as your 1: 1 personal mentor for UPSC 2024
Attend Now
Note4Students
From UPSC perspective, the following things are important :
Prelims level: Na
Mains level: India's growing private coaching industry has faced numerous challenges, including student suicides
Get an IAS/IPS ranker as your 1: 1 personal mentor for UPSC 2024
Attend Now
Note4Students
From UPSC perspective, the following things are important :
Prelims level: Telepathy device
Mains level: importance of transparency and data sharing in scientific research and development.

Central Idea:
Neuralink, founded by tech mogul Elon Musk, achieved a significant milestone by successfully implanting their device, Telepathy, in a human being, aiming to restore autonomy to quadriplegic individuals through thought control of digital devices. However, amidst the excitement, there are significant ethical and technical challenges that need to be addressed, particularly regarding transparency, data ownership, and long-term safety.
Key Highlights:
- Neuralink’s ambitious goals, founded by Elon Musk, include restoring functionality to those with neurological disabilities and enhancing human cognition.
- The lack of transparency and data sharing raises concerns about the safety and efficacy of the Neuralink device.
- Ethical considerations around data ownership and potential misuse of recorded intentions.
- The exclusion of individuals with certain medical conditions from the trial raises questions about safety and long-term effects.
- The importance of replicability, transparency, and oversight in scientific research and development.
Key Challenges:
- Lack of transparency and data sharing.
- Ethical concerns regarding data ownership and privacy.
- Ensuring the safety and efficacy of the Neuralink device over the long term.
- Addressing potential health risks associated with brain implantation and electrode insertion.
- Establishing replicability and reliability in scientific research.
Main Terms:
- Neuralink: A tech startup founded by Elon Musk, developing implantable brain-computer interface devices.
- Telepathy: Neuralink’s proprietary chip designed for recording and transmitting neural data.
- Quadriplegia: Paralysis or loss of function in all four limbs.
- ALS (Amyotrophic Lateral Sclerosis): A progressive neurodegenerative disease that affects nerve cells in the brain and spinal cord.
- FDA (Food and Drug Administration): A federal agency responsible for regulating and overseeing the safety and efficacy of medical devices and drugs.
Important Phrases:
- “Restore autonomy to those with unmet medical needs.”
- “Opaque development and pre-clinical testing results.”
- “Ethical breaches and lack of transparency.”
- “Concerns about data ownership and privacy.”
- “Long-term safety and efficacy.”
Quotes:
- “Neuralink’s ambition and vision extend beyond clinical use to enhance human cognition and possibilities.”
- “Secrecy does not instill confidence, and trust is something scientists have learned not to bestow on corporate entities too generously.”
Useful Statements:
- “The lack of transparency and data sharing raises concerns about the safety and efficacy of the Neuralink device.”
- “Ethical considerations around data ownership and potential misuse of recorded intentions are paramount.”
- “The exclusion of certain individuals from the trial raises questions about safety and long-term effects.”
Examples and References:
- Mention of Elon Musk as the founder of Neuralink.
- Features of the Neuralink device, such as the Telepathy chip.
- References to reports of monkeys using the Neuralink device and experiencing adverse events.
Facts and Data:
- Mention of the FDA approval for the Neuralink device.
- Discussion of the 18-month primary observation period in the trial.
- Reference to the lack of registration of the trial on clinical trial repositories like clinicaltrials.gov.
Critical Analysis:
- The article highlights the importance of transparency and data sharing in scientific research and development.
- Raises ethical concerns regarding data ownership and privacy in the context of brain-computer interface technology.
- Criticizes Neuralink for its lack of transparency and opaque development process.
Way Forward:
- Emphasize the importance of transparency and data sharing in scientific research and development.
- Advocate for clear guidelines on data ownership and privacy in the context of brain-computer interface technology.
- Call for increased oversight and regulation to ensure the safety and efficacy of emerging medical technologies like Neuralink’s Telepathy device.
Get an IAS/IPS ranker as your 1: 1 personal mentor for UPSC 2024
Attend Now
Note4Students
From UPSC perspective, the following things are important :
Mains level: Introduction of a high-powered committee to address challenges arising from rapid population growth
Central Idea:
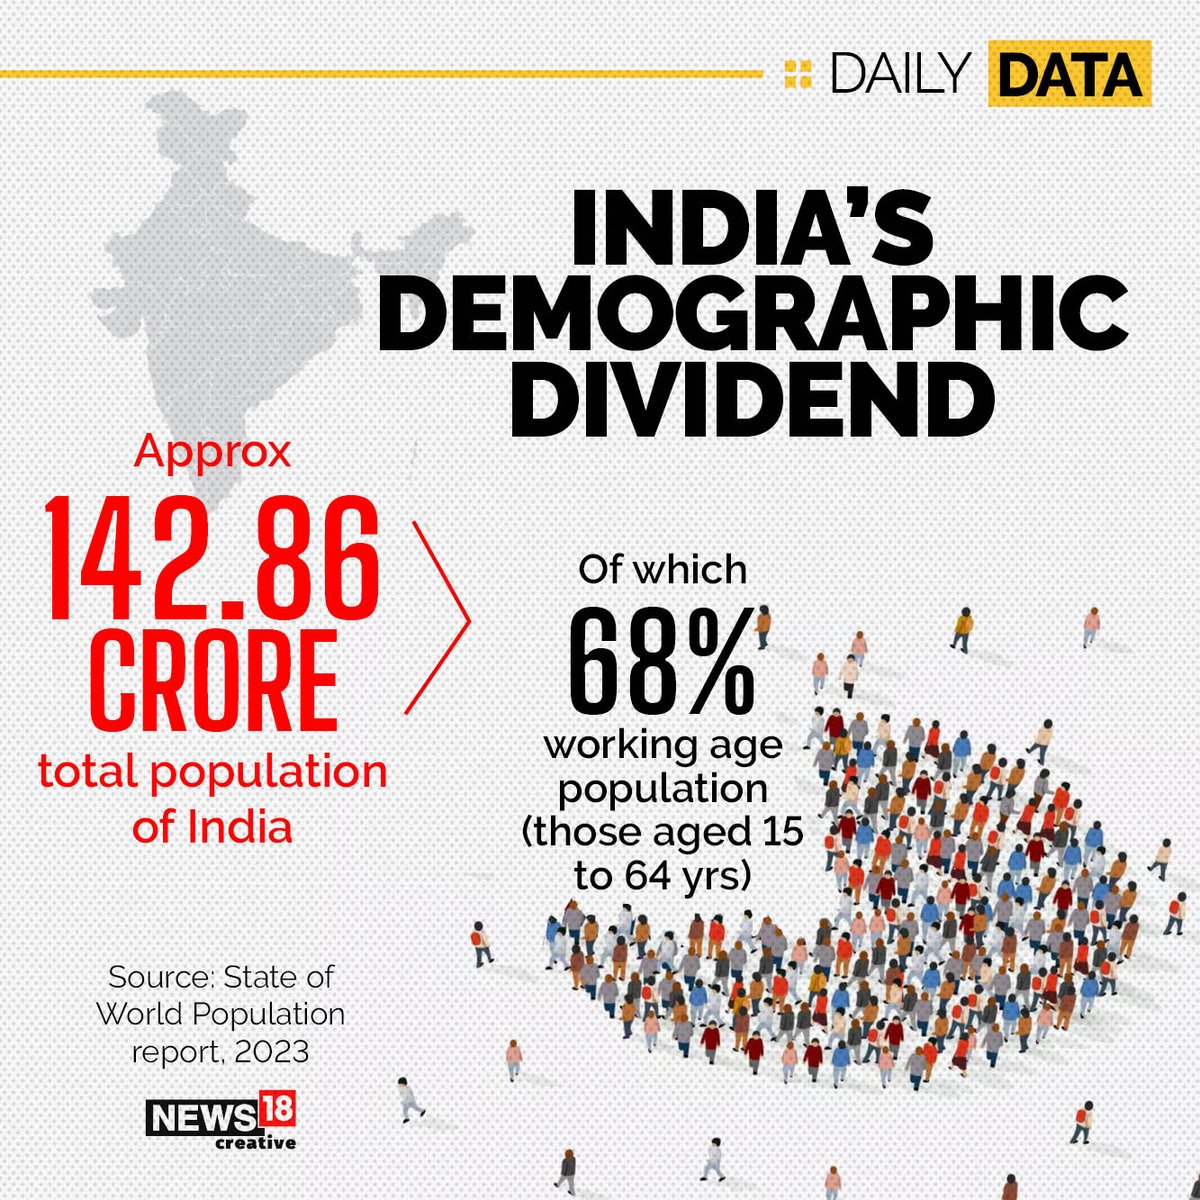
The article emphasizes the importance of addressing the challenges and harnessing the opportunities presented by India’s rapidly changing demographic landscape through strategic policies and investments in health, education, employment, and data infrastructure.
Key Highlights:
- Introduction of a high-powered committee to address challenges arising from rapid population growth.
- Need for interdisciplinary approach involving experts from various fields.
- Importance of data analysis and monitoring demographic trends.
- Emphasis on collaboration with stakeholders for effective policy implementation.
- Highlighting demographic shifts and their implications for economic growth.
- Focus on maximizing the demographic dividend through investments in human capital.
- Challenges in healthcare, education, and employment sectors.
- Importance of evidence-based decision making and data infrastructure.
- Collaboration with international organizations for best practices and funding opportunities.
Key Challenges:
- Limited public spending on healthcare and education.
- Persistent challenges in nutritional deprivation and access to quality education.
- Disruptions caused by the COVID-19 pandemic.
- Lack of accurate and timely demographic data.
- Need for modernization of data infrastructure and capacity building.
- Ensuring reliability and accuracy of population data.
- Bridging the gap between skill development initiatives and industry requirements.
Key Terms and Phrases:
- Demographic transition
- Population committee
- Interdisciplinary approach
- Demographic dividend
- Evidence-based policy
- Data infrastructure
- Human capital
- Skill development
- Stakeholder collaboration
- Economic growth
Case Studies and Best Practices:
- The successful implementation of the National Rural Health Mission in improving primary healthcare in rural areas.
- The Mid-Day Meal Scheme ensuring access to nutritious meals for school children, contributing to improved health and educational outcomes.
- The Aadhaar initiative in India, which has streamlined government services and facilitated targeted interventions in various sectors, including healthcare and education.
- The Pradhan Mantri Kaushal Vikas Yojana (PMKVY), a skill development initiative aimed at providing industry-relevant training to youth, enhancing their employability.
- The ASER (Annual Status of Education Report) survey providing valuable insights into the quality of education in rural India and informing policy decisions for improvement.
Key Quotes and Anecdotes:
- “India’s demographic landscape presents both opportunities and challenges for the country’s socio-economic development.”
- “Investments in health, education, and skill development are crucial to realizing India’s demographic dividend.”
- “Collaboration with international organizations can provide access to global best practices and technical expertise.”
Key Statements and Examples:
- India’s population committee aims to formulate policies addressing challenges like family planning and socio-economic development.
- The demographic dividend offers an opportunity for accelerated economic growth but requires investments in human capital.
- Limited public spending on healthcare and education underscores the need for policy prioritization in these sectors.
Key Facts and Data:
- India’s population is projected to reach 1.46 billion by 2030.
- Public spending on health has remained around 1% of GDP.
- Nearly 47% of Indian youth may lack necessary education and skills for employment by 2030.
- Over 250 million children were forced out of school due to the COVID-19 pandemic.
Critical Analysis:
- The article effectively highlights the interconnectedness of demographic factors with economic and social development.
- It underscores the importance of evidence-based policymaking and the challenges in data availability and reliability.
- The emphasis on collaboration with stakeholders and international organizations reflects a comprehensive approach to addressing demographic challenges.
Way Forward:
- Prioritize investments in health, education, and skill development.
- Modernize data infrastructure and improve data collection methodologies.
- Strengthen collaboration with stakeholders and international organizations.
- Implement policies that promote transparency, accountability, and inclusivity.
- Focus on bridging the gap between existing initiatives and industry requirements to enhance employment opportunities.
Get an IAS/IPS ranker as your 1: 1 personal mentor for UPSC 2024
Attend Now
Note4Students
From UPSC perspective, the following things are important :
Prelims level: COP28
Mains level: urgent need for action on climate change and the challenges associated with transitioning away from fossil fuels
Central Idea:
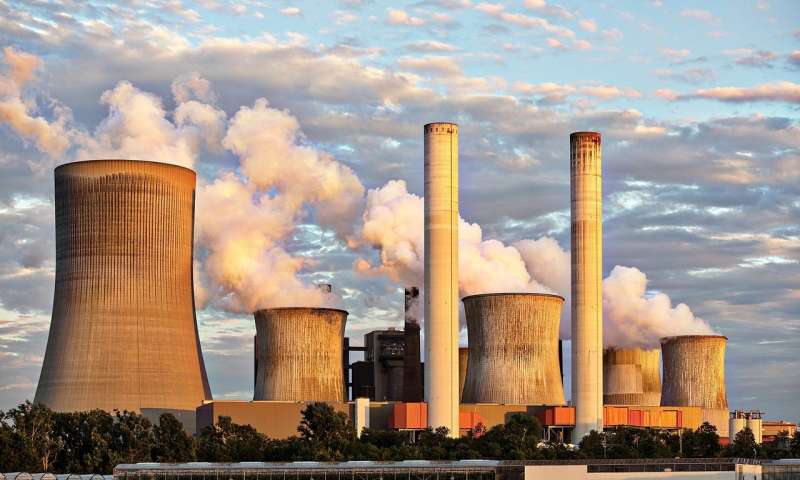
The inadequate response from governments and corporations to address climate change is fueling a rise in climate change litigation and a push for phasing out fossil fuel subsidies and extraction. This momentum is underscored by proposals like a coal elimination treaty by 2030 due to the significant gap between planned fossil fuel production and Paris Agreement goals. However, challenges exist in aligning these proposals with existing climate change principles, particularly regarding equitable transitions for heavily dependent fossil fuel economies like India.
Key Highlights:
- Rise in climate change litigation due to insufficient action from governments and corporations.
- Growing momentum to phase out fossil fuel subsidies and extraction, exemplified by proposals such as a coal elimination treaty by 2030.
- Challenges in aligning proposals with existing climate change principles like Common but Differentiated Responsibilities.
- Heavily dependent fossil fuel economies, such as India, face difficulties transitioning due to economic reliance on fossil fuels.
Key Challenges:
- Balancing the need for transitioning away from fossil fuels with the economic dependence of certain countries on fossil fuel revenues.
- Ensuring equitable transitions for heavily dependent fossil fuel economies.
- Aligning proposals for phasing out fossil fuels with existing climate change principles like Common but Differentiated Responsibilities.
- Addressing the discrepancy between planned fossil fuel production and Paris Agreement goals.
Key Terms/Phrases:
- Climate change litigation
- Fossil fuel subsidies
- Coal elimination treaty
- Production Gap Report
- Common but Differentiated Responsibilities
- Nationally Determined Contributions
- Equitable transitions
- Heavily dependent fossil fuel economies
Case Studies/Best Practices:
- India’s reliance on fossil fuels despite progress in renewable energy.
- The transition strategy of countries like Canada, the United States, and the United Kingdom with more diversified economies.
- COP26 and COP28 decisions regarding phasing out coal and transitioning away from fossil fuels.
Key Quotes/Anecdotes/Statements:
- “The inadequate response from governments and corporations in dealing with the issue of climate change is leading to… dramatic rise in climate change litigation.”
- “Those countries that are heavily dependent on revenues and employment in the fossil fuel sector are likely to experience serious difficulties in transitioning away from fossil fuel.”
- “India’s subsidies on kerosene oil have come under scrutiny in the West as it is found to be inconsistent with Article 2(1)(c) of the Paris Agreement and is also considered as inefficient subsidies.”
Key Examples/References/Facts/Data:
- The Production Gap Report indicating a significant gap between planned fossil fuel production and Paris Agreement goals.
- India’s reliance on fossil fuels dominating its power sector despite progress in renewable energy.
- COP26 and COP28 decisions regarding phasing out coal and transitioning away from fossil fuels.
Critical Analysis:
The article highlights the urgent need for action on climate change and the challenges associated with transitioning away from fossil fuels. It underscores the discrepancy between proposed fossil fuel production and climate goals, as well as the economic dependence of certain countries on fossil fuel revenues. However, it also acknowledges the need for equitable transitions and the complexities of aligning proposals with existing climate change principles.
Way Forward:
- Implementing equitable transition strategies for heavily dependent fossil fuel economies.
- Strengthening international cooperation and commitments to phase out fossil fuel subsidies and extraction.
- Addressing discrepancies between proposed fossil fuel production and climate goals.
- Integrating principles of Common but Differentiated Responsibilities into transition strategies.
- Providing support and creating economic opportunities for those affected by the transition away from fossil fuels.
Get an IAS/IPS ranker as your 1: 1 personal mentor for UPSC 2024
Attend Now
Note4Students
From UPSC perspective, the following things are important :
Prelims level: POCSO Act
Mains level: Child pornography
Get an IAS/IPS ranker as your 1: 1 personal mentor for UPSC 2024
Attend Now
Note4Students
From UPSC perspective, the following things are important :
Prelims level: Fertility rates
Mains level: India's demographic challenges
Central Idea:
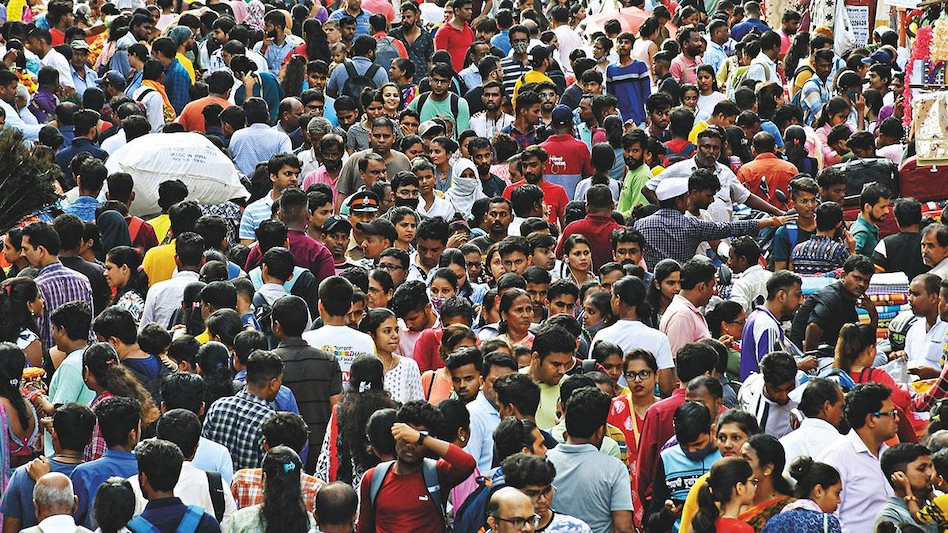
The article discusses India’s demographic transformation and the need for proactive policies to address opportunities and challenges arising from changing population dynamics.
Key Highlights:
- India’s population growth trends are being studied to align policies with the Viksit Bharat goal by 2047.
- Fertility rates have decreased, and family planning is becoming more prevalent.
- The workforce is changing, with an increase in middle-aged workers projected by 2047.
- Dependency burdens vary between states, requiring tailored policy interventions.
- There is an opportunity to enhance women’s workforce participation by providing better childcare support.
- Lessons from China’s one-child policy caution against drastic measures.
Key Challenges:
- Varying demographic trends between states pose challenges for policy formulation.
- Ensuring equitable workforce development and gender-inclusive policies.
- Addressing the needs of the growing elderly population while maintaining economic sustainability.
- Avoiding the negative consequences of drastic population control measures.
Key Terms:
- Demographic transformation
- Fertility rates
- Family planning
- Workforce dynamics
- Dependency burdens
- Women’s workforce participation
- One-child policy
Key Phrases:
- Changing population dynamics
- Tailored policy interventions
- Workforce inclusivity
- Sustainable economic development
- Lessons learned
Key Quotes:
- “Today, we are studying India’s population growth to align policies with the Viksit Bharat goal by 2047.”
- “There’s an opportunity to enhance women’s workforce participation by providing better childcare support.”
- “Lessons from China’s one-child policy caution against drastic measures.”
Anecdotes/Case Studies:
- The comparison with China’s one-child policy illustrates the importance of cautious policy measures in managing population dynamics.
Key Statements:
- “India’s population growth trends are being studied to align policies with the Viksit Bharat goal by 2047.”
- “There’s an opportunity to enhance women’s workforce participation by providing better childcare support.”
Key Examples and References:
- Comparative data on workforce demographics and dependency burdens between states provide concrete examples of demographic variations.
- The reference to China’s one-child policy serves as a cautionary example.
Key Facts/Data:
- India’s fertility rates have decreased significantly in recent years.
- Dependency burdens vary significantly between states.
- Women’s workforce participation rates could be improved with better childcare support.
Critical Analysis:
The article provides a balanced assessment of India’s demographic challenges and opportunities, cautioning against drastic measures while advocating for proactive policies.
Way Forward:
- Tailored policy interventions should address varying demographic trends between states.
- Gender-inclusive policies and better childcare support can enhance women’s workforce participation.
- Lessons from global best practices should inform India’s approach to demographic management.
- Caution should be exercised to avoid the negative consequences of drastic population control measures.
Get an IAS/IPS ranker as your 1: 1 personal mentor for UPSC 2024
Attend Now
Note4Students
From UPSC perspective, the following things are important :
Prelims level: Debt-to-GDP ratio
Mains level: Balancing fiscal consolidation with the need for increased government expenditure to address developmental challenges
Central Idea:
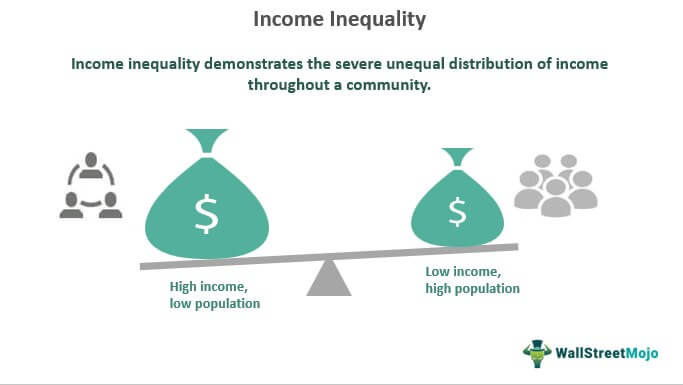
The article analyzes the recent interim Union budget in India, focusing on its macroeconomic policy objectives and the challenges facing the Indian economy. It discusses the government’s efforts to reduce the debt-to-GDP ratio and stimulate GDP growth, particularly by prioritizing capital expenditure over revenue expenditure. However, it questions the effectiveness of these objectives in addressing India’s developmental challenges, especially regarding employment generation and structural transformation.
Key Highlights:
- The budget presents a fiscally conservative approach with minimal increases in total expenditure, emphasizing capital expenditure over revenue expenditure.
- The government aims to reduce the debt-to-GDP ratio, primarily by limiting expenditure growth rates and increasing capital expenditure.
- The article raises concerns about the adequacy of these objectives in addressing India’s developmental challenges, particularly the need for employment generation and structural transformation.
- It highlights the stagnation in regular wages and the dominance of self-employment, indicating a worsening income distribution and weak improvements in welfare.
Key Challenges:
- Balancing fiscal consolidation with the need for increased government expenditure to address developmental challenges.
- Promoting structural transformation to shift workers from self-employment to modern sectors.
- Achieving inclusive growth that benefits all sections of society, especially marginalized groups.
- Enhancing the effectiveness of government spending to stimulate economic growth and employment generation.
Key Terms:
- Debt-to-GDP ratio: The ratio of a country’s total debt to its gross domestic product, indicating its ability to repay debt.
- Capital expenditure: Spending on acquiring or maintaining physical assets such as infrastructure, machinery, and buildings.
- Revenue expenditure: Day-to-day spending on government operations and services, including salaries, pensions, and subsidies.
- Primary deficit: The fiscal deficit excluding interest payments on government debt.
- Structural transformation: The process of shifting resources, including labor, from traditional sectors like agriculture to modern sectors such as manufacturing and services.
Key Phrases:
- Fiscally conservative approach
- Debt stability
- Structural change
- Employment generation
- Inclusive growth
Key Quotes:
- “The budget reflects a fiscally conservative approach with minimal increases in total expenditure.”
- “The government aims to reduce the debt-to-GDP ratio, primarily by limiting expenditure growth rates and increasing capital expenditure.”
- “The dominance of self-employment indicates a worsening income distribution and weak improvements in welfare.”
Key Examples and References:
- Comparison of expenditure growth rates and GDP growth rates to illustrate the government’s strategy in reducing the debt-to-GDP ratio.
- Analysis of employment data to highlight the challenges of structural transformation and income distribution.
Key Facts and Data:
- Total budgeted expenditure, with minimal increase over the previous year.
- Debt-to-GDP ratio currently at a certain level, targeted to be reduced to another level.
- Stagnation in regular wages and dominance of self-employment in the workforce.
- GDP growth rates and expenditure growth rates used to analyze the effectiveness of fiscal policies.
Critical Analysis:
The article provides a critical assessment of the interim Union budget’s macroeconomic policy objectives, highlighting potential shortcomings in addressing India’s developmental challenges. It questions the effectiveness of targeting a specific debt-to-GDP ratio and emphasizes the need for broader strategies to promote inclusive growth and structural transformation.
Way Forward:
- Reevaluate fiscal policies to ensure a balance between debt reduction and addressing developmental challenges.
- Prioritize investments in infrastructure and human capital to stimulate economic growth and employment generation.
- Implement targeted interventions to support marginalized groups and promote equitable income distribution.
- Enhance monitoring and evaluation mechanisms to assess the impact of government spending on welfare and economic development.
Get an IAS/IPS ranker as your 1: 1 personal mentor for UPSC 2024
Attend Now
Note4Students
From UPSC perspective, the following things are important :
Prelims level: Fiscal deficit
Mains level: Net Borrowing Ceiling (NBC)
Central Idea:
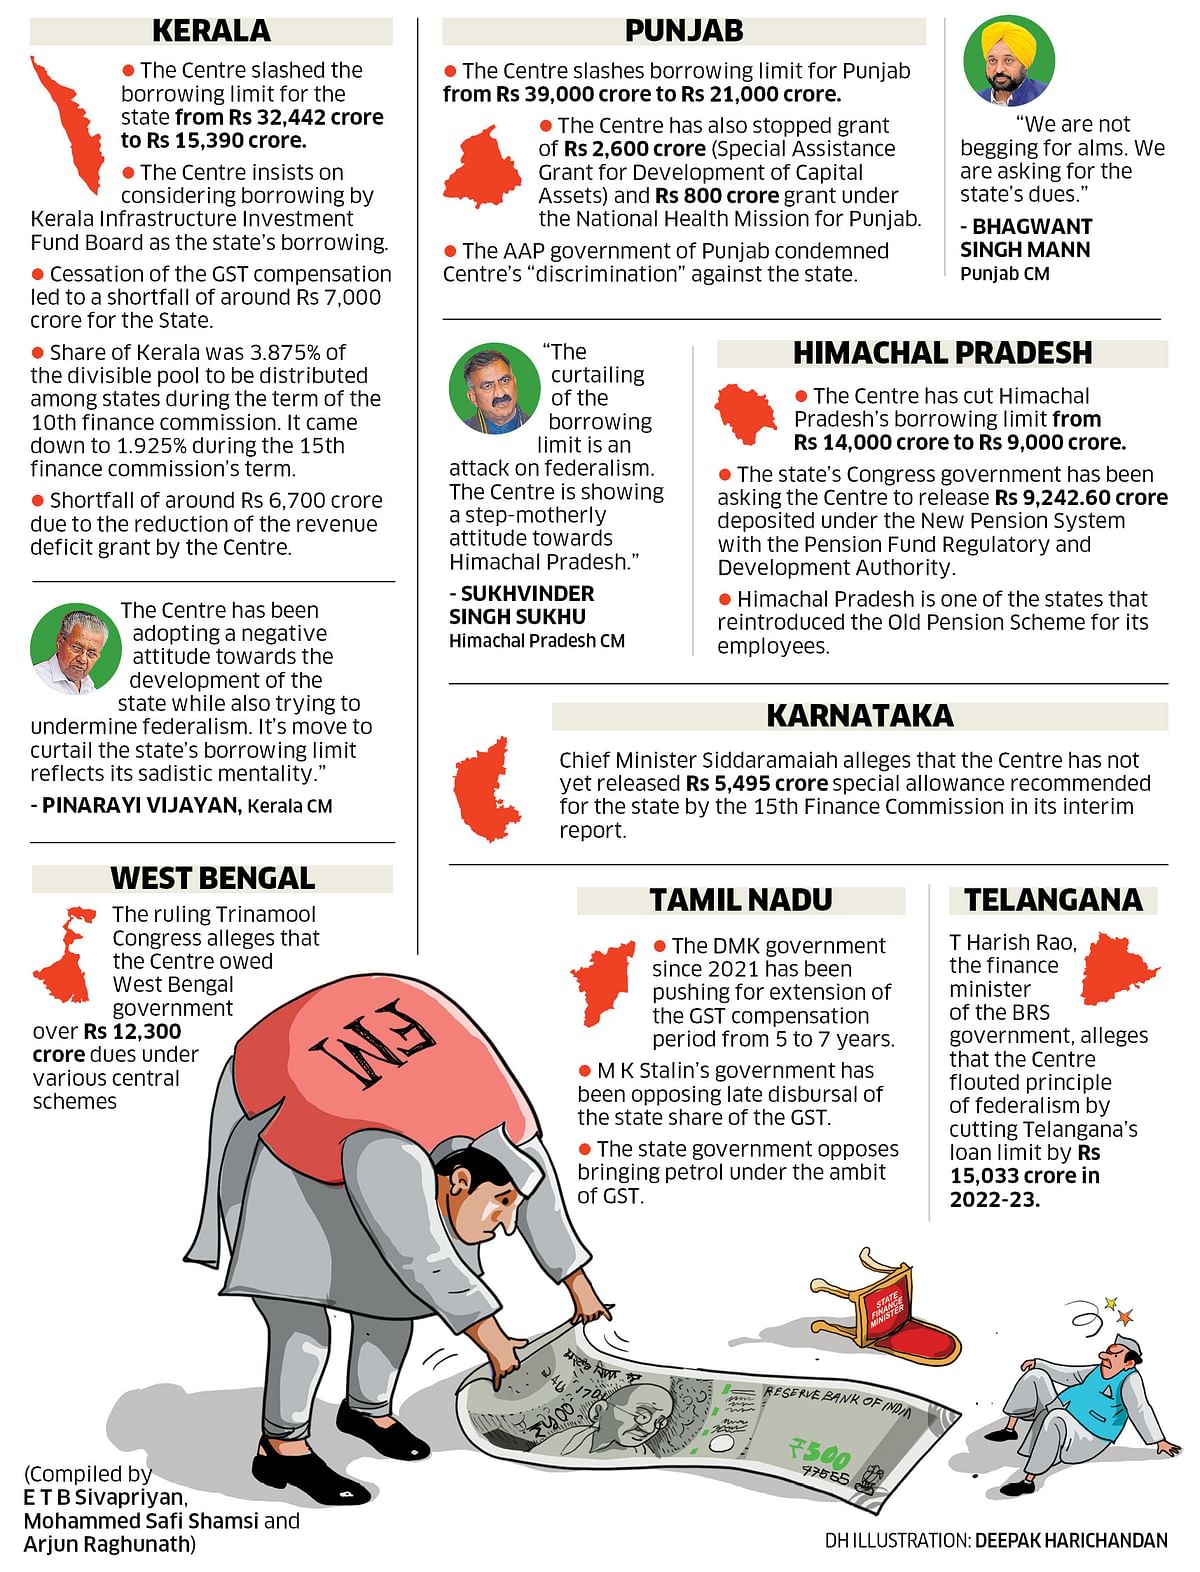
The article discusses Kerala’s protest against the imposition of a Net Borrowing Ceiling (NBC) by the Central Government, which restricts the state’s ability to borrow funds. It argues that this imposition undermines fiscal federalism and challenges the constitutional authority of the state legislature over financial matters.
Key Highlights:
- Kerala Chief Minister Pinarayi Vijayan leads a protest against the Central Government’s imposition of a financial embargo on Kerala.
- The NBC limits states’ borrowings, including those from state-owned enterprises like the Kerala Infrastructure Investment Fund Board (KIIFB), leading to a severe financial crisis in Kerala.
- The article questions the constitutionality of including state-owned enterprises’ debt in the state’s total debt, arguing that it encroaches on the state legislature’s authority over financial matters.
- Kerala’s Fiscal Responsibility Act, 2003, aims to reduce fiscal deficit, demonstrating the state’s commitment to fiscal discipline.
- The article criticizes the move towards “annihilative federalism,” where the central government’s actions detrimentally affect states’ ability to meet welfare obligations.
Key Challenges:
- Balancing fiscal discipline with the need for states to fund development projects and welfare schemes.
- Addressing the erosion of fiscal federalism and the encroachment of central authority over state finances.
- Resolving the conflict between the powers of the central government and state legislatures regarding financial matters.
- Mitigating the impact of borrowing restrictions on states’ ability to fulfill their financial obligations.
Key Terms:
- Net Borrowing Ceiling (NBC): Limit imposed on states’ borrowings from all sources.
- Kerala Infrastructure Investment Fund Board (KIIFB): State-owned body responsible for funding infrastructure projects.
- Fiscal Responsibility Act: Legislation aimed at reducing fiscal deficit and promoting financial discipline.
- Fiscal Federalism: Distribution of financial powers and responsibilities between the central government and states.
- Annihilative Federalism: Central government actions that undermine states’ financial autonomy and welfare obligations.
Key Quotes:
- “The wide array of constitutional issues…point at the severe erosion of fiscal federalism in the country.”
- “The borrowing restrictions are an example of ‘annihilative federalism’ at play.”
Key Examples and References:
- Kerala’s protest led by Chief Minister Pinarayi Vijayan against the financial embargo imposed by the Central Government.
- The inclusion of KIIFB’s debt in Kerala’s total debt, leading to funding constraints for welfare schemes.
- Comparison of Kerala’s fiscal deficit reduction efforts with the central government’s fiscal deficit estimates.
Key Facts and Data:
- Kerala’s fiscal deficit reported to have reduced to 2.44% of the GSDP.
- Central government’s fiscal deficit estimated to be 5.8% for 2023-2024.
Critical Analysis:
The article underscores the tension between central authority and state autonomy in financial matters, highlighting the constitutional ambiguity surrounding the imposition of borrowing restrictions. It argues for a balanced approach that acknowledges states’ fiscal responsibilities while ensuring fiscal discipline.
Way Forward:
- Reevaluate the imposition of borrowing restrictions to ensure they do not unduly impede states’ ability to meet financial obligations.
- Enhance dialogue and cooperation between the central government and states to address fiscal challenges while respecting constitutional principles.
- Clarify the division of financial powers between the central government and state legislatures to mitigate conflicts and promote fiscal federalism.
Get an IAS/IPS ranker as your 1: 1 personal mentor for UPSC 2024
Attend Now

Central Idea:
The ongoing crisis in the World Trade Organisation’s (WTO) dispute settlement mechanism (DSM), particularly the paralysis of the appellate body (AB) due to the US blocking the appointment of new members, poses a significant challenge to the multilateral trading regime. Developing countries like India are pushing for the restoration of the AB to its original form, but alternative options are being considered due to the US’s reluctance.
Key Highlights:
- The DSM, particularly the AB, is crucial for ensuring compliance with WTO rulings and maintaining a rules-based global trading system.
- The US has blocked the appointment of new AB members since 2019, rendering it ineffective and undermining the enforcement of WTO rulings.
- Developing countries, led by India, are advocating for the restoration of the AB to its original form to ensure fairness and predictability in dispute resolution.
- Alternative options include joining interim arrangements led by the European Union or proposing a diluted AB with limited powers, but these may compromise the effectiveness of the DSM.
- Scholars propose a compromise solution where countries can opt out of the AB’s jurisdiction, allowing its restoration while accommodating the US’s concerns.
Key Challenges:
- The deadlock caused by the US’s opposition to the AB’s functioning has led to a crisis in the DSM, undermining the WTO’s authority.
- Developing countries face the challenge of balancing their desire for a fully functioning AB with the need to accommodate the US’s concerns to maintain consensus within the WTO.
- Alternative solutions, such as interim arrangements or diluted AB proposals, may lack the necessary enforceability or compromise the integrity of the DSM.
Key Terms:
- World Trade Organisation (WTO)
- Dispute Settlement Mechanism (DSM)
- Appellate Body (AB)
- Interim Appeal Arbitration Arrangement (MPIA)
- International Court of Justice (ICJ)
Key Phrases:
- “Crisis in the dispute settlement mechanism”
- “Paralysis of the appellate body”
- “Developing countries’ advocacy”
- “Alternative options”
- “Compromise solution”
Key Quotes:
- “The WTO’s DSM — its crown jewel — comprises a binding two-tiered process with a panel and an appellate body (AB).”
- “Consequently, countries have found an easy way to avoid complying with the WTO panel rulings. They appeal into the void, thereby rendering the WTO toothless.”
- “A fully functional dispute settlement, with the checks and balances that the appellate body provides, is the best bet for the developing world.”
- “India and other developing countries should continue striving for the ideal solution: The restoration of the AB in the form it existed till 2019.”
Key Statements:
- “The ongoing crisis in the dispute settlement mechanism (DSM) poses a significant challenge to the multilateral trading regime.”
- “Developing countries are pushing for the restoration of the AB to its original form to ensure fairness and predictability in dispute resolution.”
- “Alternative options may compromise the effectiveness of the DSM and undermine the enforcement of WTO rulings.”
Way Forward:
- Advocate for Restoration: Developing countries should continue advocating for the restoration of the AB to its original form, emphasizing its importance for ensuring fairness and predictability in the global trading system.
- Explore Compromise Solutions: Consider compromise solutions, such as allowing countries to opt out of the AB’s jurisdiction, to accommodate the concerns of key stakeholders like the US while maintaining the integrity of the DSM.
- Strengthen Interim Arrangements: If necessary, explore joining interim arrangements led by entities like the European Union to provide temporary solutions while working towards a more permanent resolution within the WTO framework.
Get an IAS/IPS ranker as your 1: 1 personal mentor for UPSC 2024
Attend Now
Note4Students
From UPSC perspective, the following things are important :
Prelims level: Jal Jeevan Mission (JJM)
Mains level: Swachh Bharat Mission-Grameen (SBM-G)
Central Idea:
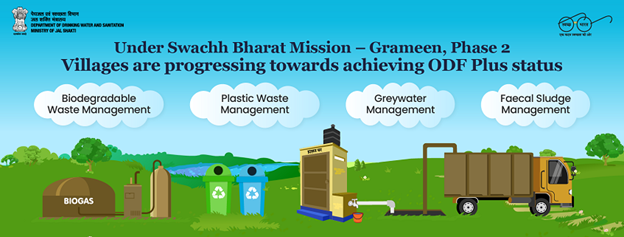
The article discusses the progress and challenges of India’s sanitation programs, particularly focusing on the Swachh Bharat Mission-Grameen (SBM-G) and its Phase II. It highlights the importance of behavioral change alongside infrastructure development for sustainable sanitation practices.
Key Highlights:
- Improvement in sanitation coverage in India from 39% in 2014 to 100% in 2019 under SBM-G.
- Launch of Phase II of SBM-G focusing on sustainability and ODF Plus status by 2024-25.
- Challenges including non-usage of toilets due to various reasons such as lack of infrastructure, hygiene issues, and social norms.
- Disparities in toilet access and usage across different states and socio-economic groups.
- Importance of social networks and behavioral change campaigns in promoting sanitation practices.
- Lack of synergy and coordination among various government programs addressing basic needs.
Key Challenges:
- Ensuring sustained usage of toilets post-construction.
- Addressing disparities in access and usage across different regions and socio-economic groups.
- Overcoming social norms and behaviors hindering sanitation practices.
- Lack of coordination among different government programs related to basic needs.
Key Terms/Phrases:
- Swachh Bharat Mission-Grameen (SBM-G)
- Open Defecation Free (ODF)
- Total Sanitation Campaign
- ODF Plus
- Jal Jeevan Mission (JJM)
- Social norms
- Behavioral change campaigns
Key Quotes:
- “The construction of toilets does not automatically lead to their use.”
- “Sanitation behavior also varies across socio-economic classes.”
- “Behavioral change in sanitation cannot happen independently.”
Key Examples/Anecdotes:
- Survey findings showing reasons for non-usage of toilets in different regions.
- Observations on the influence of social networks on sanitation behavior.
Key Statements:
- “Improvement in sanitation coverage needs to be viewed from the perspective of behavioral change for true sustainability.”
- “Social norms and economic conditions significantly influence toilet usage.”
Key Facts/Data:
- Sanitation coverage improved from 39% in 2014 to 100% in 2019 under SBM-G.
- NARSS-3 reported 95% toilet access but only 85% usage in rural India.
- Around 10 crore toilets were constructed between 2014 and 2019.
Critical Analysis:
The article effectively highlights the progress and challenges in India’s sanitation programs, emphasizing the importance of behavioral change alongside infrastructure development. It underscores the need for targeted efforts to address disparities and overcome social norms hindering sanitation practices. Additionally, the critique of the lack of synergy among government programs provides valuable insight into the inefficiencies in addressing basic needs.
Way Forward:
- Strengthening behavioral change campaigns tailored to different socio-economic contexts.
- Enhancing coordination among government programs addressing basic needs.
- Targeted interventions to address disparities in access and usage across regions and socio-economic groups.
- Continuous monitoring and evaluation to ensure sustained usage of sanitation facilities.
Get an IAS/IPS ranker as your 1: 1 personal mentor for UPSC 2024
Attend Now
Note4Students
From UPSC perspective, the following things are important :
Prelims level: United Nations World Food Programme
Mains level: women's empowerment and nutrition
Central Idea:
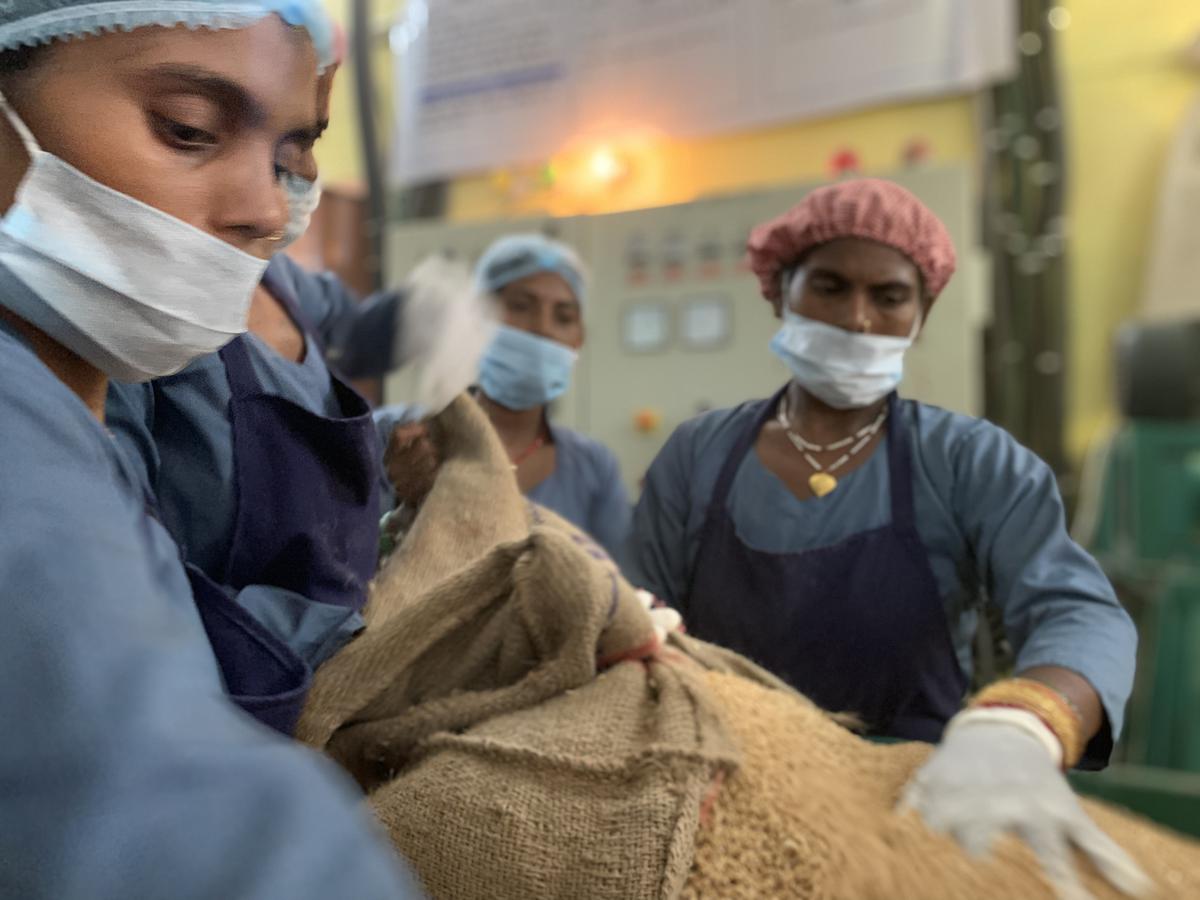
The article highlights the success of a decentralized approach to tackling malnutrition in Uttar Pradesh by empowering women through community-based micro-enterprises. This initiative, led by self-help groups, focuses on producing fortified and nutritious foods for pregnant/breastfeeding mothers and children, distributed via the Integrated Child Development Services (ICDS) programme.
Key Highlights:
- Collaborative effort between the Department of Women and Child Development and the Uttar Pradesh State Rural Livelihood Mission.
- Decentralized production of take-home rations by women’s enterprises.
- Positive impact on livelihoods with over 4,000 women engaged in 204 self-help group micro-enterprises.
- Re-formulation of take-home rations to enhance nutritional value and address monotony.
- Focus on strengthening demand through diverse and nutritious products.
- Innovation through app-based solutions and QR code tracking for supply chain management.
Key Challenges:
- Ensuring consistent quality and safety standards.
- Overcoming logistical challenges in decentralized production and distribution.
- Addressing potential resistance to change from centralized to decentralized models.
- Sustaining long-term engagement and empowerment of women.
Key Terms:
- Self-help groups
- Micro-enterprises
- Integrated Child Development Services (ICDS)
- Fortified foods
- Decentralized production
- Nutritional supplementation
- Livelihood opportunities
Key Phrases:
- Women’s empowerment for nutrition
- Decentralized model for take-home ration production
- Strengthening demand through diverse products
- Innovation and sustainability in food production
- Multi-stakeholder approach for effective solutions
Key Quotes:
- “Engaging women from the community to run the take-home ration production units is a game-changer.”
- “The State-wide expansion of micro-enterprises led by women confirms successful targeting and demonstrates how empowering women can bring about effective and sustainable processes.”
Key Examples and References:
- Collaboration between the Department of Women and Child Development and the Uttar Pradesh State Rural Livelihood Mission.
- Use of two pilot plants by the United Nations World Food Programme in Unnao and Fatehpur.
- Expansion to 202 production units across 43 districts, benefiting 12 million ICDS beneficiaries.
Key Statements:
- “This initiative presents an excellent opportunity for women to earn a livelihood and contribute to the local economy.”
- “The re-formulated take-home rations are nutritious and designed to support the health and well-being of children.”
Key Facts/Data:
- Over 4,000 women engaged in 204 self-help group micro-enterprises.
- Aim to generate an additional income of ₹8,000 a month for each woman.
- Products include sweet and savory options like aata besan halwa and daliya moong dal khichdi.
- Expansion to 202 production units across 43 districts, benefiting 12 million ICDS beneficiaries.
Critical Analysis:
- The initiative effectively addresses the intersection of women’s empowerment and nutrition, leveraging community resources for sustainable impact.
- Decentralized production and diverse product offerings enhance accessibility and acceptability.
- Challenges such as quality control and scalability need continuous monitoring and adaptation.
Way Forward:
- Continued support for women’s empowerment and capacity building.
- Strengthening of quality assurance mechanisms.
- Further research and innovation in product development and supply chain management.
- Collaboration with stakeholders for scaling up and sustainability.
Get an IAS/IPS ranker as your 1: 1 personal mentor for UPSC 2024
Attend Now